Advisor Perspectives welcomes guest contributions. The views presented here do not necessarily represent those of Advisor Perspectives.
This is Part two of a two-part article series. Please see article one here.
Michael Edesess’ article, The Trend that is Ruining Finance Research, makes the case that financial research is flawed. In this two-part series, I examine the points that Edesess raised in some detail. His arguments have some merit. Importantly however, his article fails to undermine the value of finance research in general. Rather, his points highlight that finance is a real profession that requires skills, education and experience that differentiates professionals from laymen.
Edesess’ case against so-called evidence-based investing rests on three general assertions. First, there is the very real issue with using a static t-statistic threshold when the number of independent tests becomes very large. Second, financial research is often conducted with a universe of securities that includes a large number of micro-cap and nano-cap stocks. These stocks often do not trade regularly and exhibit large overnight jumps in prices. They are also illiquid and costly to trade. Third, the regression models used in most financial research are poorly calibrated to form conclusions on non-stationary financial data with large outliers.
This article will tackle the first issued, often called “p-hacking,” and proposes a framework to help those who embrace evidence-based investing to make judicious decisions based on a more thoughtful interpretation of finance research. Part one of this series addressed the other two issues.
P-hacking and scaling significance tests
When Fama, French, Jegadeesh, et al. published the first factor models in the early 1990s, it was reasonable to reject the null hypothesis (no effect) with an observed t-statistic of 2. After all, the computational power and data at the time could not support data mining to the extent that it is now possible. Moreover, these early researchers were careful to derive their models very thoughtfully from first principles, lending economic credence to their results.
However, as Cam Harvey has so assiduously noted, the relevant t-statistic to signal statistical significance must expand through time to reflect the number of independent tests. He suggests that, based on several different approaches to the problem, current finance research should seek to exceed a t-statistic threshold of at least 3 to be considered significant. If the results are derived explicitly through data mining, or through multivariate tests, the threshold should be closer to 4, while results derived from first principles based on economic or behavioral conjecture, and with a properly structured hypothesis test, may be considered significant at thresholds somewhat below 3.
Harvey’s recommendations make tremendous sense. The empirical finance community – like so many other academic communities such as medicine and psychology – is guilty of propagating “magical thinking” for the sake of selling associated investment products, journal subscriptions and advertising. With few exceptions, journals only publish papers with interesting and significant findings. As a result, the true number of tests of significance in finance vastly exceeds the number of published journal articles.
A lack of reproducibility
Finance professionals should be cautioned by the fact that researchers are performing more and more tests each year, while journals only report a fraction of the tests that are performed. But these issues are amplified by the fact that many papers are never independently verified. Where researchers do attempt to verify results and find errors, journals just publish corrections that are often buried at the bottom of issues many months or years in the future. This is unsatisfactory.
The Merriam-Webster dictionary defines “profession” as “a calling requiring specialized knowledge and often long and intensive academic preparation.” Incumbent in this definition is the idea that professionals are responsible for understanding and validating research that they use to inform their recommendations to clients. But far too few advisors – even those of the evidence-based variety – take the time to thoroughly review the papers they rely on to form client portfolios. Far fewer have the skills, resources or inclination to independently validate the strategies they endorse.
My team has identified several major errors in research published in some of the most prestigious finance periodicals. In August we questioned the results of a paper on volatility published in one of the most popular practitioner journals. The author – shaken and contrite – confirmed that he had miscalculated the effect, and overstated the results by more than a factor of two. I genuinely believe the author did his best to present the facts, but errors happen. That’s why it is incumbent on practitioners to verify results before making allocations with other peoples’ money.
Out-of-sample confirmation
Harvey and his co-authors are not alone in their desire to bring statistical rigor to the financial research process. Many respected practitioners share their concerns and apply similar methods in their own practices.
One way for practitioners to gain greater confidence in prospective factors is through out-of-sample testing. Fortunately, there is an abundance of out-of-sample analysis validating the most robust factors. One obvious out-of-sample test involves testing the factor on a different universe from the one first investigated. For example, if a method worked on U.S. stocks, it should also work on stocks in other international stock markets. In addition, if a factor was identified in 1993, then tests over the 20-year period from 1994-2013 are considered out-of-sample. One might also ‘perturb’ a factor’s specification to test for robustness, say by changing the definition of ‘value’ from price-to-book value to price-to-cash-flow or price-to-earnings.
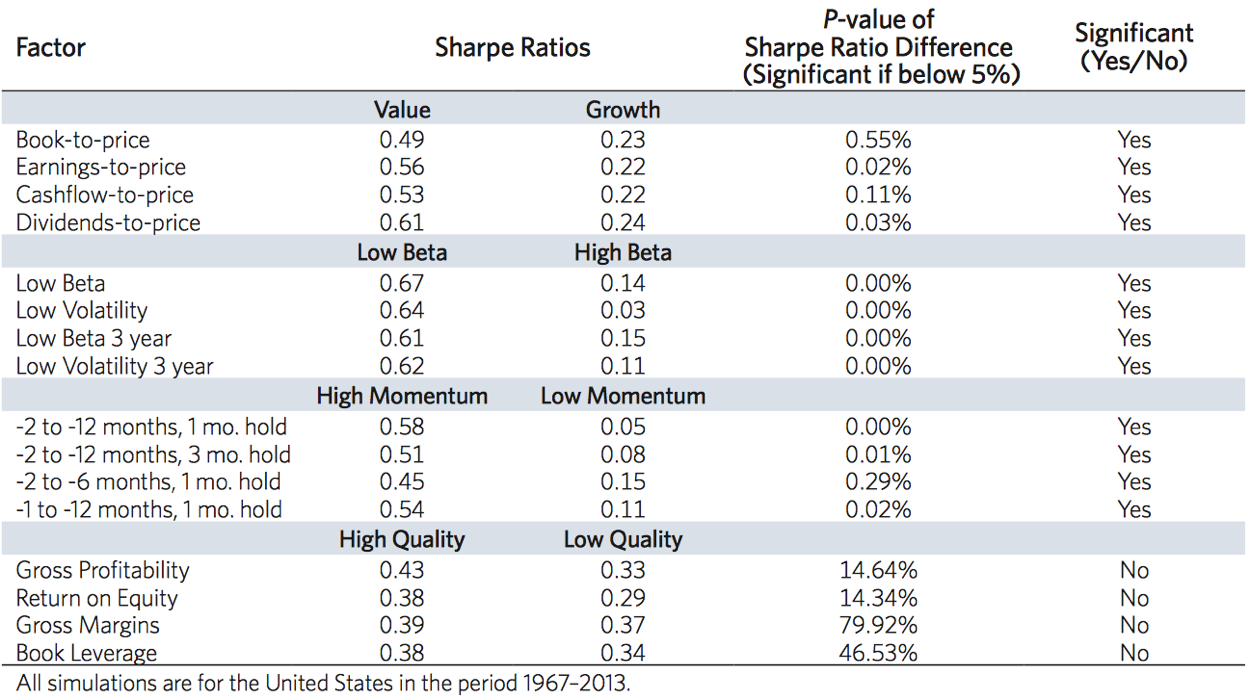
In Finding Smart Beta in the Factor Zoo, Jason Hsu and Vitali Kalesnik at Research Affiliates performed tests of the value, momentum, low beta, quality and size factors on stocks across U.S. and international markets. For tests on U.S. markets they used data back to 1967, while international tests were run from 1987. Recall that the size, value and momentum factors were first documented in the early 1990s, and the low-beta anomaly was first catalogued by Haugen in the mid-1970s. In addition, all factors were first identified using exclusively U.S. stocks. As such, by testing in international markets over the period 1987-2013 their analysis was legitimately out of sample. That is, they tested on out-of-sample universes, and over a 26-year horizon where 20 years were out-of-sample in time. Results in international markets were consistent with the results of the seminal papers.
In addition, Hsu and Kalesnik tested using different definitions of the factors. For example, they tested ‘value’ as defined by dividend-to-price, cash-flow-to-price and earnings-to-price as well as the original book-to-price metric. They also varied the lookback horizons and skip-months for momentum, and tested both beta and volatility for the low-beta factor, again with different lookback horizons. As you can see from Figure 1, the value, momentum and low-beta factors all proved robust to alternative definitions.
Figure 1. Value, low beta and momentum factors prove robust to alternative specifications
 Source: Research Affiliates
Clearly Hsu took seriously the concerns raised by Harvey, and took steps to increase empirical rigor of his solutions, but he and his team at Research Affiliates are not alone in their quest. Cliff Asness and colleagues at AQR performed their own analysis of the value and momentum factors across both a universe of global stocks and a universe of global asset class indexes. Their tests spanned the period 1972-2011, so about 40% of their analysis period is out-of-sample in time. Of course, about half of their global stock universe, and the entire global asset class universe, is also out-of-sample for the entire period. Their results are summarized in Figure 2 below.
Figure 2. Statistical significance of value and momentum factors across global stocks and asset classes, 1972-2011
Source: Asness, Moskowitz and Pedersen, “Value and Momentum Everywhere”
Highlighted in green, note the statistical significance of risk-adjusted excess returns from the value and momentum factors in global stocks (top) and global asset classes (bottom). This analysis validates the persistence of the value and momentum factors across a largely out-of-sample data set. Even better, the t-scores exceed the higher thresholds proposed by Harvey, and tests on the asset class universe overcome higher hurdles with substantial margin to spare (disclosure: ReSolve investment solutions utilize some of the multi-asset factors described above).
A professional way forward
Edesess asserted that, in the absence of reliable research, investment professionals should make life-changing decisions for clients based on “common sense.” But common sense is just a narrow data sample – one’s own experience – filtered through an often imperfect, emotionally charged, heavily biased cognitive prism. Further, there is no mention of “common sense” in the dictionary – or any practical – definition of the word “professional.” The fact is, to call ourselves professionals, investment practitioners must make judicious decisions based on finance research. There are many reasons why this may be challenging, but the alternative is unacceptable.
To be successful in empirical finance requires a mosaic of experience, mental models, data, humility and a fundamental understanding of how decisions are made in markets. For example, my framework considers that investors are corrupted by the following forces when faced with making decisions in uncertain markets:
- incentives
- agency issues
- behavioral biases (prospect theory, herding, overreaction, under-reaction)
- non-wealth-maximizing preferences (i.e. lottery preferences, leverage aversion, home-bias)
- structural challenges (i.e. siloed decision making, regulation, compliance, information diffusion)
A dense body of literature in behavioral finance, and my own experience with clients, advisors, and investment managers, supports the view that these forces drive investors to make decisions that are not purely in the interest of their own (or their clients’) wealth. These inefficiencies result in investable sources of excess return for those investors with the capacity to take the other side of the trade. As I seek to interpret the empirical literature, and innovate in pursuit of sustainable premia, there must be a clear connection between these forces and the premia under investigation.
Evidence-based investment professionals should also have a healthy understanding and respect for complex adaptive systems. Even where an investor is satisfied that an effect is rooted in the factors above, and economically significant, she must be honest with herself about whether there are sustainable barriers to arbitrage that would allow it to persist. A solid risk-based explanation is a wide moat that suggests an effect should persist. As Edesess asserted, the equity-risk premium (ERP) is solidly rooted in a risk-based explanation. The volatility risk premium is also similarly rooted, as is the duration premium. Some other commonly cited risk premia have plausible risk-based explanations, but also might be explained by behavioral biases or alternative preferences.
Most investors think about risk in terms of loss, but tracking error, regulatory risk, liability risk, career risk, and other types of risk play an integral role in investor decision making. Most investors find it very difficult to underperform their home market index, or miss out on bubble-like investments for any length of time. Regulators impose constraints on leverage and concentration. The new fiduciary standards may subject advisers to liability from making recommendations that deviate from other “prudent investors.” Institutional investors face career risk from recommending investments that may underperform in the short term. These forces result in non-wealth-maximizing decision making, and are real risks that manifest in persistent anomalies.
For example, equity mutual fund managers are typically incentivized on the basis of assets in their funds and investment performance relative to their benchmark. Benchmark-centric performance metrics such as information ratio penalize managers based on tracking error. Yet outperformance necessarily requires managers to take bets that are different from the index.
If there were no leverage constraints, a manager could overlay diversified beta exposure to complement their active bets. But regulatory constraints prevent 40-Act mutual funds from taking on leverage, except in certain narrow circumstances. In practice, this leads managers to place concentrated bets on certain stocks with large active risk.
To balance this risk, managers often lower portfolio tracking error by investing in a basket of high-beta stocks with their remaining capital. Thus, due to regulatory constraints and incentive structure, mutual fund managers place a premium on high-beta stocks that is independent of expected returns. This lowers the ex-ante expected return on these stocks, and is a strong candidate for the source of the low-beta anomaly. A few other commonly cited alternative premia have equally valid explanations rooted in similar forces. [Please see discussion of multi-asset strategies below, as an example of strong barriers to arbitrage].
The framework above is not perfect. It is an organic concept, which evolves over time with one’s own experience in markets. I invite you to append your own belief systems to make it your own. But it is a way forward. Ultimately, our goal as a profession should be that all advisers have the “specialized knowledge, and long and intensive academic preparation” to deliver informed, robust advice to clients. Common sense is a necessary, but profoundly insufficient, foundation for a professional code of conduct. Investors deserve better.
Adam Butler, CFA, CAIA, is co-founder and chief investment officer of ReSolve Asset Management. ReSolve manages funds and accounts in Canada, the United States and internationally.
Appendix: Multi-asset strategies: A case study in structural barriers to arbitrage
The framework above presents a compelling case for multi-asset strategies, which take active positions at the asset class level, using ETFs or futures, rather than at the level of individual securities. Multi-asset strategies include global tactical asset allocation (GTAA), managed futures, risk parity, lifecycle strategies, etc. Multi-asset anomalies like momentum, trend and carry arise from the same risk and behavioural sources as securities-based anomalies. However, they exhibit greater economic and statistical significance, and may have larger barriers to arbitrage.
At the level of individual securities, alternative premia persist because investors seek to avoid certain types of risk, such as volatility, skewness, or tracking error. But there are few structural impediments that prevent investors from deploying capital to harvest the premia. For example, most institutional portfolios are structured along asset-class silos, where each silo is charged with seeking alpha within its own narrow sandbox. As a result, the equity team at one institution competes with very little friction against the equity teams at every other institution. These teams have substantial latitude withing their asset class to pursue active risk in pursuit of excess returns.
However, there are large barriers to arbitrage at the multi-asset level. Institutions rarely take on material active risk at this level of the portfolio. The asset allocation is set by a policy committee, and guided by long-term capital market expectations. Some institutions are bound by rigid actuarial rules and are able to tolerate very little deviation from policy weights. Committee-level decisions are typically slow, incremental and reactive. And peer-oriented compensation schemes heavily and asymmetrically penalize short-term tracking error relative to long-term alpha generation. These are large and persistent structural barriers to arbitrage that don’t exist at the level of individual securities, and which suggest multi-asset anomalies like trend and carry have a long shelf-life.
For the structural reasons stated above, investors have been slow to embrace active multi-asset strategies. According to Blackrock’s research department (whom I queried on this very subject last year), multi-asset strategies account for just 13% of global liquid market capitalization. This stands in stark contrast to the proportion of active allocation in stocks and bonds, where 65% and 87% of these markets are dominated by active mandates, respectively. And this does not count assets tracking active indexes, like “smart-beta” ETFs, etc.
Figure 3. Proportion of actively managed assets by mandate
Source: Blackrock
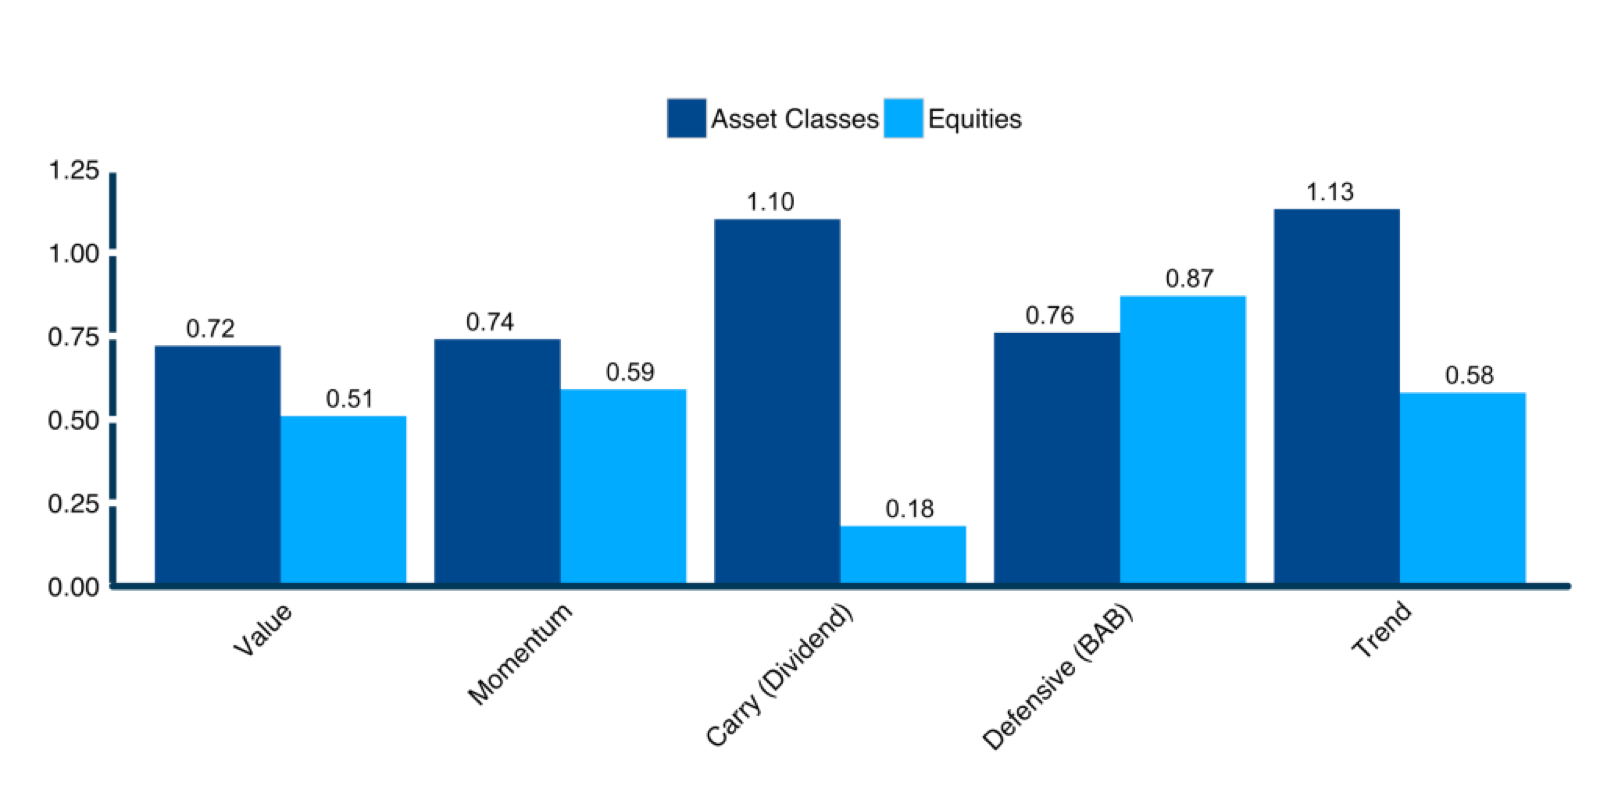
The apparent disinterest in active multi-asset strategies is certainly not due to lack of evidence. As shown in Figure 4 below, global multi-asset carry and trend strategies exhibit historical Sharpe ratios roughly twice what is observed in historical tests of traditional equity-based factors like cross-sectional momentum and value. Admittedly, some multi-asset factor strategies have struggled in the current central-banking dominated cycle, alongside many traditional equity factors. Stock momentum and value have had a very rough decade indeed.
It’s noteworthy that the period 1932-1942 was also a very difficult decade for factor based strategies, as central banks were also active during that period, distorting the natural price-discovery process. And more generally, factor based investors should expect to have long periods of “famine”; if factor investors feasted every night, the feast would quickly dwindle to a thin gruel as arbitrage would be risk-free.
Figure 4. Sharpe ratios: global equities vs. global asset classes
Sources: Value and Momentum data from Asness, Moskowitz & Pedersen “Value and Momentum Everywhere” (2013). Carry (dividend) equity factor is for U.S. only from Ken French database (long top decile value-weighted, short bottom decile value-weighted for stocks in top 30% by market capitalization). Carry factor is from Koijen et al., “Carry” (2013). Defensive factor from Frazzini & Pedersen, “Betting Against Beta” (2014). Equity trend data from “The Enduring Effect of Time-Series Momentum on Stock Returns over nearly 100-Years” by D’Souza et al. (2015). Multi-asset trend data from Hurst, Ooi, and Pedersen, “A Century of Evidence on Trend-Following Investing” (2017).
Read more articles by Adam Butler
 Source: Research Affiliates
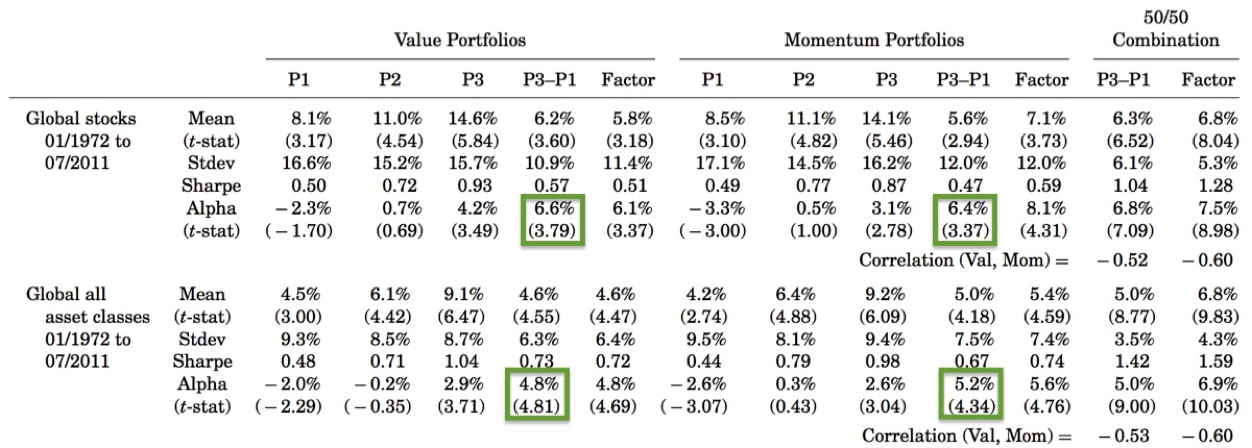 Source: Asness, Moskowitz and Pedersen, “
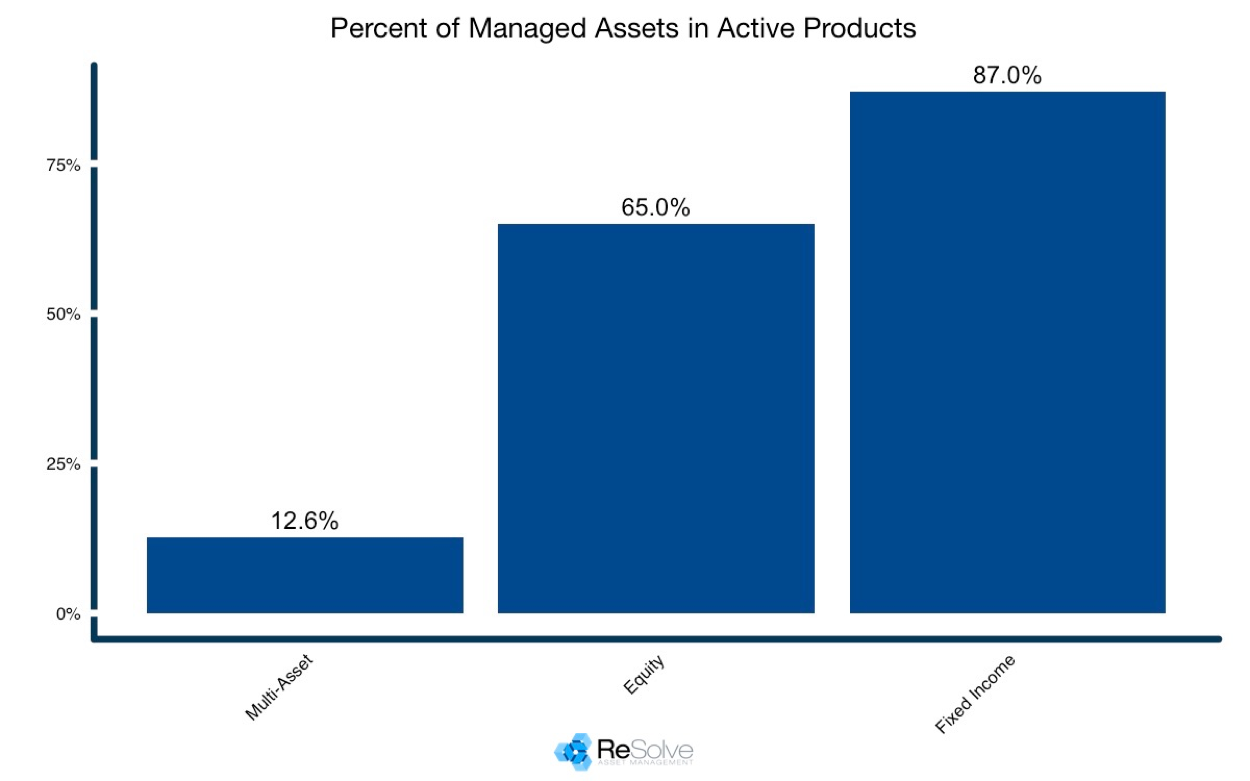 Source: Blackrock