Third Quarter 2022 Economic and Market Review
Membership required
Membership is now required to use this feature. To learn more:
View Membership Benefits Success in investing doesn’t correlate with IQ once you’re above the level of 25. Once you have ordinary intelligence, what you need is the temperament to control the urges that get other people in trouble investing.
The VIX, the market’s measure of volatility and thus uncertainty, has for most of 2022 been above the range of 13-19 that is considered average. And with all the geopolitical and economic uncertainties facing markets, the VIX ended the quarter above 30. Levels above 20 are not only considered high, but they have been found to be predictive of high volatility over the next month. Because investors, and thus markets, dislike uncertainty, volatility has been negatively correlated with equity returns – when the risks of negative outcomes increase, investors demand larger risk premiums, driving P/E ratios down. I will review the risks that investors are having to address, which explain the continued high level of uncertainty.
There are factors pointing to the risk of slower economic growth and the increasing risk of recession:
- Reduced fiscal stimulus, the result of a shrinking fiscal deficit – the federal budget deficit was $2.7 trillion in the first 11 months of fiscal year 2022 (October 2021-August 2022), $300 billion less than it was at the same point last year.
- Tighter monetary policy, as the Federal Reserve is expected to continue to raise interest rates because core inflation remains well above its 2% target. The Fed’s preferred inflation measure, the Personal Consumption Expenditures Price Index (PCE), was up 0.3% in August, bringing the 12-month reading to 6.2%, and the core PCE (PCE excluding food and energy) increased 0.6%, bringing the 12-month total to 4.9%. Another indicator, the Producer Price Index (PPI), showed inflation slowing only gradually, with the August figure at 8.7% over the prior 12 months, down from 9.8% in July and 11.2% in June. In addition, the Fed has announced that it will begin to shrink its roughly $9 trillion balance sheet by almost $100 billion a month beginning in September. As the Fed’s purchases of bonds during its period of quantitative easing helped drive bond yields lower, its reduction in holdings of bonds could cause yields to go higher. In addition, reductions in its holdings could also tighten liquidity conditions, which could cause credit spreads to widen. A 2022 study by Fed economist Bill Wei concluded that a $2.2 trillion passive roll-off of nominal Treasury securities from the Federal Reserve’s balance sheet over three years is equivalent to an increase of 29 basis points in the current federal funds rate at normal times but 74 basis points during crisis periods.
- The dramatic rise in mortgage rates has led to a sharp drop in home sales. August was the seventh straight month of decline in sales. In addition, home prices in August were down about 6% from their peak in June, the biggest two-month drop in prices in nearly a decade. Sales were down 20% from a year earlier, as surging home prices and rising interest rates (the rate on 30-year fixed-rate mortgages jumped from under 3% at the end of 2020 to 6.5%) negatively impacted affordability to the lowest in 30 years.
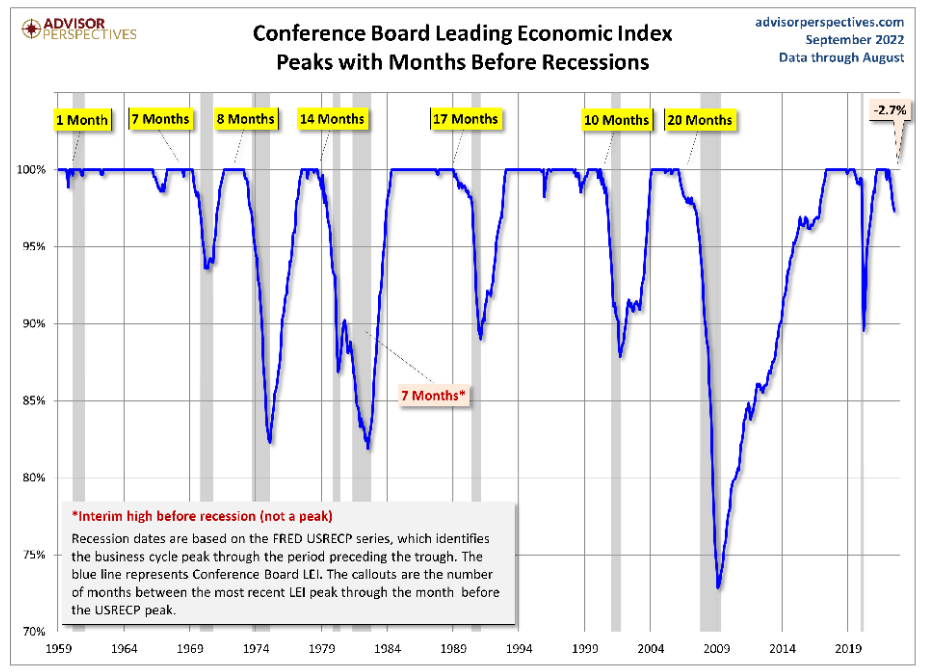
- The Conference Board’s August index of leading indicators fell for the sixth straight month, indicating an increasing risk of recession. The Leading Economic Index (LEI) fell 2.7% over the six-month period between February and August 2022, a reversal from its 1.7% growth over the previous six months. Over the past seven recessions dating back to 1959, the average time from the peak in the LEI to a recession was 11 months, with a range of just one month to as long as 20 months.

- The much stronger fiscal response to the COVID crisis by the U.S. resulted in our economy recovering faster than that of the rest of the world and our interest rates rising faster as well. That has led to a dramatically stronger dollar. From September 2021 through mid-September 2022, the dollar rose from about 92 to about 112, a two-decade high and an increase of 22%. The stronger dollar puts pressure on exports and increases our imports, increasing our trade deficit, negatively impacting economic growth as well corporate profits, as a strong dollar negatively impacts the foreign earnings of U.S. multinationals. That could lead to reduced earnings forecasts and lower P/E multiples.
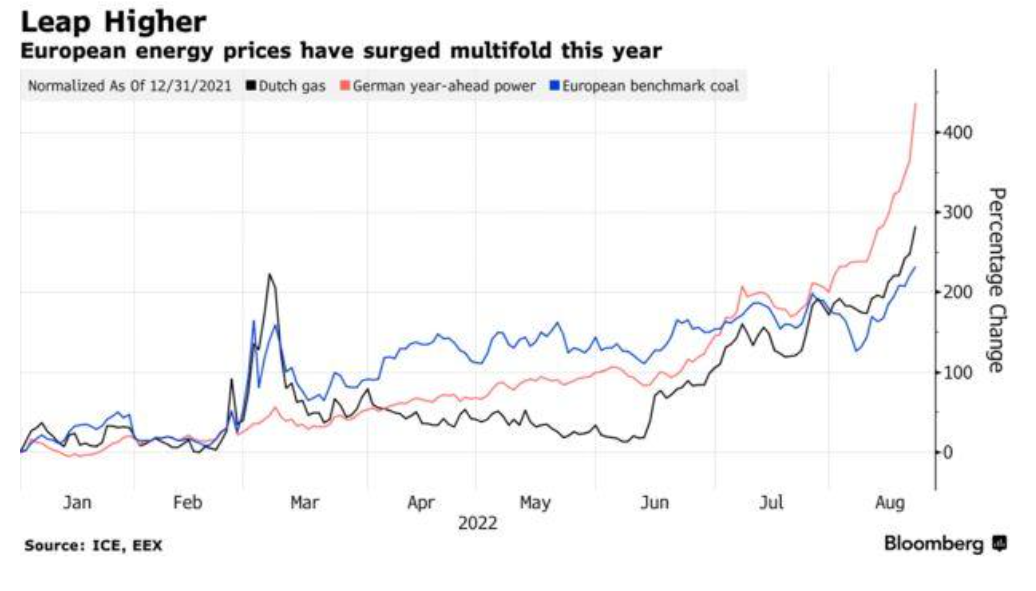
- The war in Ukraine has led to a dramatic increase in gas prices, pushing Europe into a recession, with Germany (the largest European economy) particularly vulnerable. Combined with the continuing negative impacts from COVID-related shutdowns in China, the Ukraine situation has slowed global growth, negatively impacting demand for U.S. exports. For example, growth in China’s economy, the second largest, is expected to slow to about 3.3% in 2022, the slowest in 40 years. And China faces a housing crisis similar to the one the U.S. experienced in 2008, with home sales down 40% this year. Housing is a much greater percentage of individuals’ net worth in China than in the U.S., creating greater risks to its economy.
Unfortunately, those are not the only negatives investors should be aware of. In the first quarter of 2022, productivity experienced the worst quarterly decline since 1947, -7.4%. The second quarter’s decline was almost as bad, -4.1%. Further, unit labor costs in the nonfarm business sector increased 10.2% in the second quarter of 2022, reflecting a 5.7% increase in hourly compensation and the 4.1% decrease in productivity. Over the last year, unit labor costs increased 9.3%, the largest four-quarter increase since the first quarter of 1982. Falling productivity and rising unit labor costs don’t bode well for corporate profits.
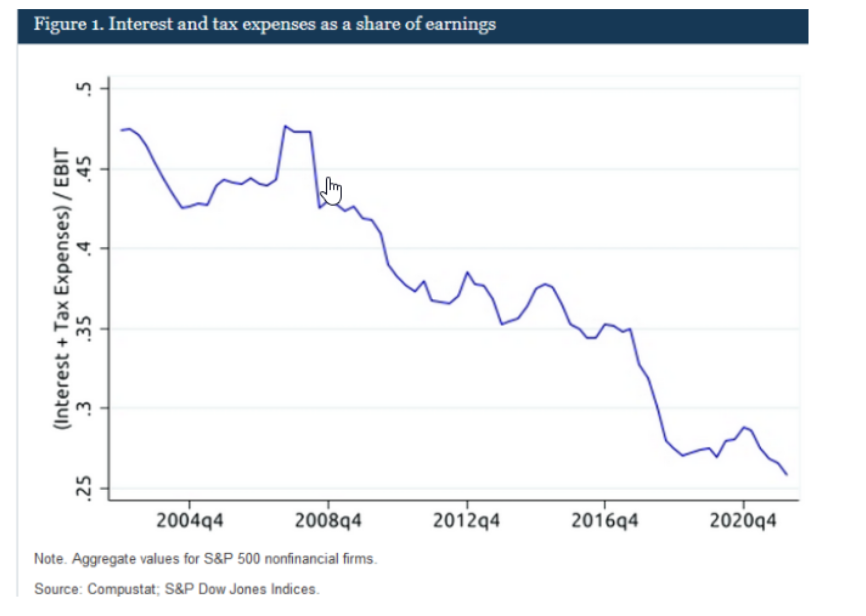
Another negative for corporate profits is that the rise in interest rates will increase the cost of debt.
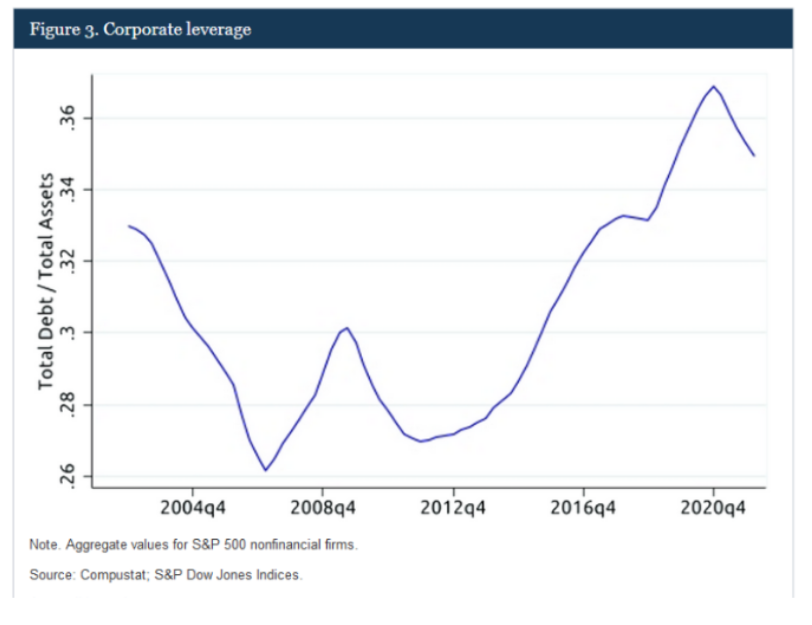
 The negative impact on corporate earnings will be compounded by the fact that corporations have increased their use of leverage (taking advantage of historically low rates), as seen in the following chart:
 Another problem is that while rising interest rates will slow demand for housing, the U.S. faces a housing shortage of about 4 million homes, helping to explain why, through midyear 2022, the year-over-year increase in home prices was 18%. That shortage, and the regulations that created the shortage (the NIMBY, or “not in my backyard,” problem), is why rents have been rising so dramatically. Rising interest rates will slow building and exacerbate the problem. This is one inflation problem the Fed cannot solve via monetary policy alone. Rents as reported in the CPI will likely continue to rise, as there is a significant lag in reporting because of the way the CPI is calculated (causing rents to lag the CPI by about 12-18 months).
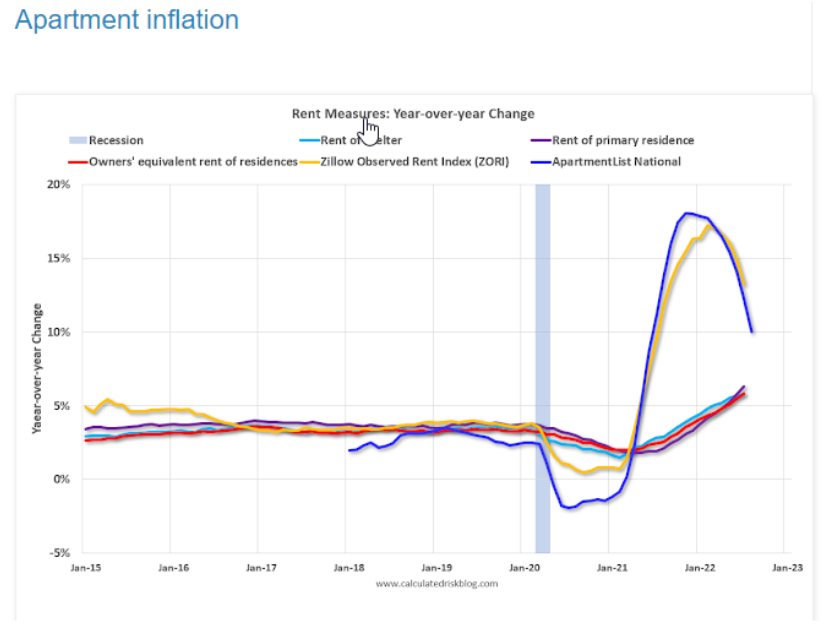 As the above chart makes clear, future increases in the rental component of the CPI are virtually guaranteed over the next year. That will keep upward pressure on the core CPI. Similarly, a shortage of personnel will likely continue to drive medical costs up at high rates (rising rates don’t slow demand for health care). And medical costs are another key component of the core CPI.
Not all the signs are bad
Not all the signs are negative.
1. One metric often used to indicate that the economy is in recession is two consecutive quarters of negative real gross domestic product (GDP) growth, which is what the U.S. experienced in the first half of 2022 – real GDP decreased at an annual rate of 0.6% in the second quarter of 2022 after declining 1.6% in the first. However, it is hard to make that declaration when the gross domestic income (GDI) – an alternative to GDP as a means of measuring economic activity – increased by 1.4% in the second quarter after increasing 1.8% in the first. Consistent with the growth in income, over the first eight months of 2022, the U.S. economy added about 3.5 million jobs, an average of about 440,000 a month. Despite adding 315,000 new jobs in August, the unemployment rate increased slightly from 3.5% to 3.7% due to an increase in the labor participation rate. 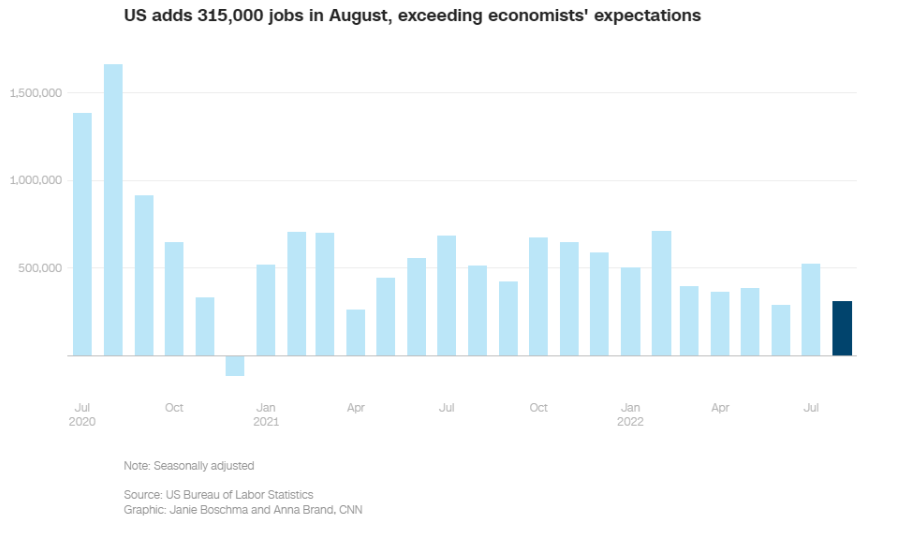
And finally, the Labor Department reported that initial claims for state unemployment benefits dropped 16,000 to a seasonally adjusted 193,000 for the week ended September 24. 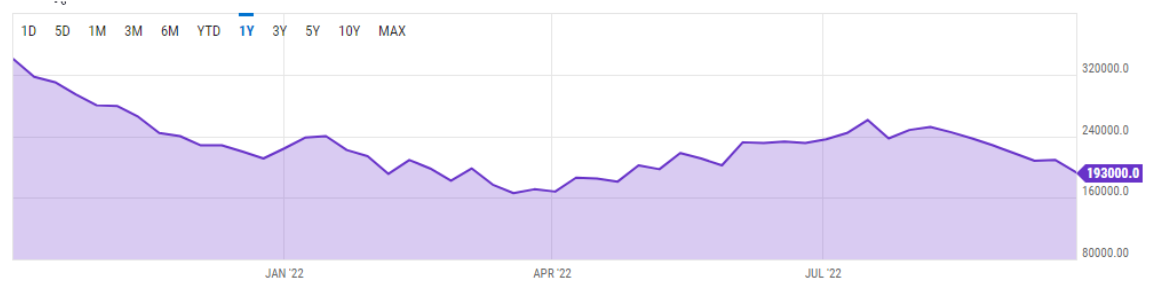
The employment data is just not consistent with the economy being in a recession.
2. Despite the ongoing war in Ukraine, the price of oil has fallen significantly, from above $120 a barrel earlier in the year to about $80, leading to lower prices at the pump – after peaking at over $5 dollar a gallon in June, the average national price fell to $3.70 by late September. And airfares have fallen as well. By late August the cost of domestic air trips to be taken in September and October had fallen 37% from May. That’s good news for consumers and will provide some relief in the form of a lower CPI. However, energy is not part of the core CPI measure, which is the focus of the Fed’s efforts to combat inflation. And thanks to the slowdown in housing, lumber prices have fallen more than 70% from their peak in March, back to about their pre-COVID levels.
The successful negotiations allowing the export of Ukrainian food supplies should allow the increase in food prices to moderate.
3. The tightness in the car market is loosening due to a drop in global demand and an easing of supply chain issues. For example, in August used car prices fell 4%, 11% below their January peak. And markups on new cars are shrinking. The supply chain problems that led to rising prices of new cars is expected to end by 2024.
4. The global slowdown has reduced the need to rebuild inventories, reducing supply chain pressures, which should reduce inflation related to goods. In addition, container shipping costs have begun to fall sharply. As shown in the chart below, the Baltic Dry Index, which measures the cost of shipping goods worldwide, had fallen to about 1,800 from its peak of about 5,500 about a year earlier, a drop of about 67%, and back to about pre-COVID levels. That too should help bring goods inflation down.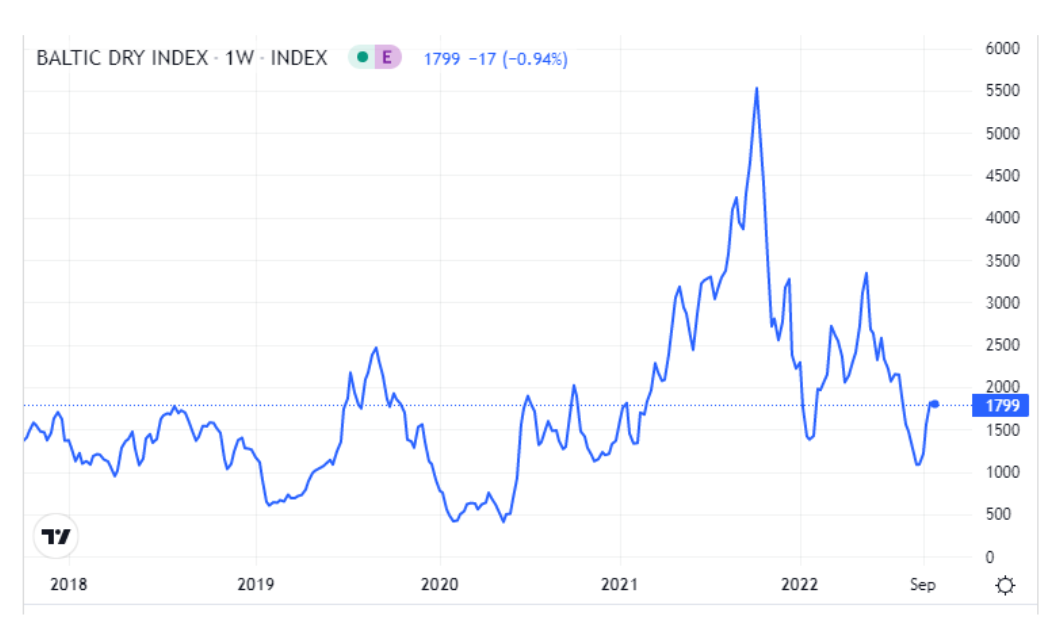
5. The U.S. labor market is the tightest it has ever been, with almost two jobs posted for every unemployed person (11.2 million job openings at the end of August versus unemployed of 5.7 million) and an unemployment rate of only 3.7%. There are now severe shortages in many occupations, such as pilots, nurses and teachers. Exacerbating the problem of a tight labor market is that the COVID crisis led to the early retirement of many workers. The move to onshore jobs (to reduce the risks of global supply chains) will further tighten the labor market, which probably accounts for consumer confidence (a leading indicator of economic activity) remaining relatively strong while stocks and bonds have been hit hard – The Conference Board Index rose in September to 108.0 (1985=100), up from 103.6 in August and 95.7 in July. Tight labor markets, while good for wages and the economy (as consumer spending accounts for about two-thirds of gross domestic product), has the reverse effect on corporate profits. Thus, we could see a margin squeeze as the negotiating power shifts from employer to employee.
6. While the Fed has been raising rates, monetary policy remains relatively loose because we still have negative real rates of interest on nominal bonds well below both the CPI and the core CPI. There is also some fiscal stimulus (just not as much as in 2020 and 2021), and both corporate and consumer balance sheets remain quite strong – not only have corporate profits been high, but corporations took advantage of historically low rates to refinance debt and lengthen maturities.
7. Perhaps most importantly, valuations are much lower, reflecting the heightened economic and geopolitical risks. For example, the Shiller CAPE 10 ended 2021 at 38.3 and finished the quarter at about 27. Using current earnings, the S&P 500 was trading at about a multiple of 17, about its long-term historical average. And value stocks were trading as if we were already in a serious recession. As live examples, Avantis’ U.S. Small-Cap Value ETF (AVUV) was trading at only about seven times earnings, as was its International Small-Cap Value ETF (AVDV); and its Emerging Markets Value ETF (AVES) was trading even cheaper, with the P/E multiple of closer to 6.5. As good a predictor as we have of future real returns is the earnings yield (E/P). Remember that it doesn’t matter to markets whether the news is good or bad, only whether it is better or worse than expected. At least for value stocks, the markets seem to be expecting almost the worst possible outcomes, as valuations are near levels reached at the depth of the great financial crisis.
Outlook for the U.S. economy
Everything just discussed is well known by the market, which explains why stocks and bonds have both performed poorly this year and valuations are lower. However, it doesn’t tell us much about the future other than that there are heightened risks and the dispersion of possible outcomes has widened. So, what do economists forecast for the U.S. economy?
The Philly Fed’s third quarter 2022 consensus forecast of professional economists, released in August, was that GDP growth would be just 1.2% in the third quarter and 1.1% in the fourth quarter. Its forecast for 2023 was 2.0%. Its odds of a negative quarter of growth were 34 and 36% for the third and fourth quarters of 2022, respectively. Its odds of a negative quarter for the first three quarters of next year were 38%, 37% and 34%, respectively. Its forecast for the unemployment rate was for a slight rise, to 3.9% in 2023 from 3.6% at year-end 2022. In terms of inflation, its forecast was for headline (core) inflation of 7.5% (5.9%) in 2022, falling to just 3.2% (3.1%) in 2023. The following chart shows the mean probabilities of real GDP growth in 2023:
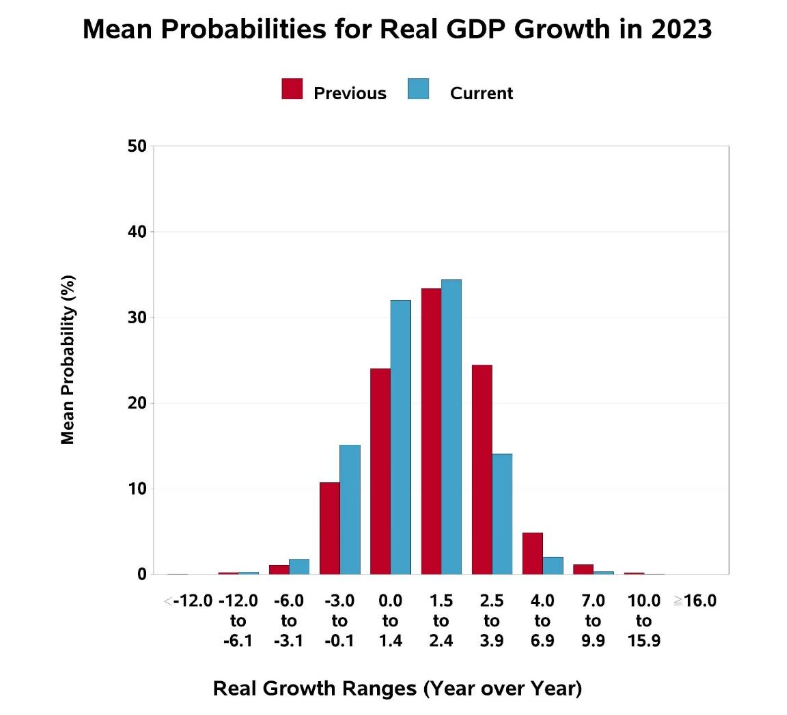 As the chart implies, the future is not knowable. Thus, investors should treat the mean forecast of 2.0% growth in 2023 in a probabilistic, not deterministic, way. The consensus forecast calls for slower growth (no recession) and moderating inflation, though not sufficient to reach the Fed’s objective of 2%. That could mean that the Fed will keep rates higher for longer, until their objective is achieved. In previous periods of Fed tightening to fight inflation, it never stopped increasing rates until the Fed funds rate was above the inflation rate. Thus, the Fed funds rate seems likely to increase to at least 4.5% and possibly higher as the core rate of inflation decreases but at a relatively slow pace. That would increase the risk of recession.
Uncertainty of forecasts: What could go wrong?
Smart investors know that investing is about managing risks, not returns, and that bear markets are a necessary evil (without them, there would be no risk and no equity risk premium). They accept that uncertainty of economic and geopolitical risks is the norm. And the evidence on the ability of active managers to outperform based on their forecasts is overwhelmingly against the strategy. That is why, for example, Warren Buffett ignores economic forecasts.
Instead of trying to manage returns, smart investors identify risks of concern and design portfolios that allow them to achieve their financial and life goals with the least amount of exposure to those risks. With that concept in mind, we will review some of risks we can identify (what could go wrong) and consider how they can be addressed, reducing them to an acceptable level.
- The COVID crisis led to massive fiscal stimulus, producing the huge budget deficit that has pushed our debt-to-GDP ratio to well above 100%, a level at which the empirical evidence demonstrates has had a negative impact on economic growth. The recently enacted Inflation Reduction Act will increase the deficit, as would the proposal to eliminate significant amounts of student debt. Thus, financial plans should at least consider that future economic growth will be slower than the historical average, which leads to lower future equity returns.
- The massive increase in the Federal Reserve’s balance sheet, from about $2 trillion in 2010 to about $9 trillion in July 2022, combined with massive fiscal deficits and extremely tight labor and housing markets could lead to inflation being more persistent than economists are forecasting. While safe bonds, like U.S. Treasury securities, have performed well when stocks performed poorly because of negative demand/deflationary shocks, both stocks and bonds have tended to perform poorly during high inflation regimes like the one we are experiencing now. During such periods, safe nominal return bonds have lost their diversification benefits.
- The COVID crisis disrupted supply chains, leading to inflationary pressures. This has important implications, as the globalization of supply chains not only had a deflationary impact on prices but also on innovations like just-in-time inventory management, which led to improved productivity, profits and economic growth. The COVID crisis has caused countries and companies alike to reconsider the implications of their reliance on offshoring supplies, likely leading to more onshoring (domestic sourcing). The result could be higher prices, lower economic growth, tighter labor markets, lower productivity and lower corporate profits.
- The war in Ukraine drags on for a long period. Russia is the main supplier of gas to several European countries, creating greater risks for Germany and Italy in particular. Plans for rationing across Europe are already in place. If Russia completely cuts off gas shipments to Europe, that could have a significantly negative impact on their economies, likely producing a deep recession that would negatively impact global growth. There is also the risk of a nuclear incident due to Russia’s war with Ukraine.
- As mentioned earlier, while the massive fiscal and monetary stimulus helped fuel the strong economic recovery in the U.S., it also led to the tightest labor market we have ever had. Exacerbating the problem of a tight labor market is that the COVID crisis led to the early retirement of many workers (e.g., the shortage of pilots), making the labor market even tighter, leading to increased pressure on wages and further fueling inflation. The move to onshore jobs will further tighten the labor market. Tight labor markets, while good for wages, has the reverse effect on corporate profits. Thus, we could see a margin squeeze as the negotiating power shifts from employer to employee. That could not only hurt profits but also lower the multiple of earnings investors are willing to pay.
- Government policies to discourage carbon-related energy production and distilling capacity, combined with the need to transition to greener forms of energy, have negatively impacted supplies, increasing inflationary pressures that could be long-lasting.
- With the debt-to-GDP ratio now in excess of 100%, the Fed has a difficult task in its efforts to fight inflation, as each 1.0% increase in interest rates leads to an increase of about $250 billion in interest costs and the budget deficit.
- The housing component of the CPI represents about one-third of the CPI and about 40% of the closely watched core CPI, and it has a significant lag because of the way it is calculated. And as noted earlier, supply is limited and labor markets are strong. That will likely keep upward pressure on rents and the CPI. However, the rate of increase that is passing through the CPI should slow, as over the first seven months of 2022, rents increased by a total of 6.7% compared to an increase of 12.0% over the same months of 2021), and they actually fell 0.1% in August, the first decline since the pandemic began.
- There’s the risk that the Fed is behind in tightening policy sufficient to dampen inflation. If that proves to be the case, it will have to raise rates higher and for longer than the market expects. While we have seen the prices of goods moderate – in fact, the goods component of the CPE fell 0.3% in August – the service component rose 0.6%. The tight labor and housing markets we discussed creates concerns, as services constitute about three quarters of the GDP. Thus, there is the risk that it will be difficult to bring inflation down to the Fed’s target without triggering a serious recession.
- As to interest rate risks, the historical evidence is a guide to possible outcomes. Let’s assume you are an optimist and believe the Fed will achieve its goal of 2% inflation in the relatively near term. If the roughly 0.5% historical real return on T-bills and the historical term premium of 2% are added to that, it results in a 10-year Treasury yield of 4.5%, a level that would likely not be good for either stocks or bonds, as it is much higher than the market currently expects. And if you are a pessimist on the outlook for inflation, the yield could end up much higher.
- China could decide to take action against Taiwan.
- A climate event, such as a major hurricane, disrupts U.S. energy supplies. Such an event could create serious disruptions and price spikes, as the Northeast has critically low supplies, down more than 60% from their five-year average. And there is always the risk of an unexpected “black swan” event (such as the COVID crisis).
- The Fed’s program of quantitative tightening (reducing the size of its balance sheet) will reduce liquidity in the capital markets, creating risks that are difficult to foresee. The combination of the reduction in liquidity, the rise in interest rates and the strength of the dollar could lead to unforeseen consequences around the globe, putting pressure on emerging markets and high-yield debt markets and creating the risk of contagion. This risk should not be underestimated.
What should investors do?
What should investors do with this information? If you are concerned about these risks, there are two ways to address your concerns. The first is to reduce exposure to both stocks and longer-term bonds and bonds with significant credit risk while increasing your exposure to shorter-term, safe bonds. That means accepting negative real returns (except in the case of TIPS, with five-year TIPS yielding about 1.7%). However, timing the market has been shown to be a loser’s game because you have to be right twice – once when getting out and then when getting back in. Thus, the more prudent way to address the risks you are concerned about is to diversify your exposure to risk assets to include other sources of risk that have low to no correlation with the economic cycle risk of stocks and/or the inflation risk of traditional bonds. The following are alternative funds that may provide diversification. Alternative funds carry their own risks; therefore, speak to your financial professional about your own circumstances prior to making any adjustments to your portfolio.
- Reinsurance.
- Private middle market lending (senior, secured, sponsored corporate debt).
- Consumer credit.
- Long-short factor funds.
- Commodities.
- Trend following (time-series momentum).
As Kevin Grogan and I demonstrated in our book, “Reducing the Risk of Black Swans,” adding unique risks has historically reduced the downside tail risk associated with conventional stock and bond portfolios. In general, while both traditional stock and bond portfolios produced large losses in the first nine months of 2022, those six asset categories have provided positive returns.
The historical evidence is very clear that dramatic falls in prices lead to panicked selling as investors eventually reach their “Get me out!” (GMO) point. Investors have demonstrated the unfortunate tendency to sell well after market declines have occurred and buy well after rallies have begun. The result is that they dramatically underperform the very mutual funds in which they invest. That is why it is so important to understand that equity investing is always about uncertainty and why it is important to not choose an equity allocation that exceeds your risk tolerance. Avoiding that mistake provides investors the greatest chance of also avoiding the mistake of letting their stomachs, not their heads, make investment decisions. Stomachs rarely make good decisions.
Larry Swedroe is the chief research officer of Buckingham Wealth Partners and Buckingham Strategic Wealth, a community of more than 140 independent registered investment advisors throughout the country.
For informational and educational purposes only and should not be construed as specific investment, accounting, legal, or tax advice. Certain information is based upon third party data which may become outdated or otherwise superseded without notice. Third party information is deemed to be reliable, but its accuracy and completeness cannot be guaranteed. Indices are not available for direct investment. Their performance does not reflect the expenses associated with the management of an actual portfolio nor do indices represent results of actual trading. Information from sources deemed reliable, but its accuracy cannot be guaranteed. Performance is historical and does not guarantee future results. By clicking on any of the links above, you acknowledge that they are solely for your convenience, and do not necessarily imply any affiliations, sponsorships, endorsements or representations whatsoever by us regarding third-party websites. We are not responsible for the content, availability or privacy policies of these sites, and shall not be responsible or liable for any information, opinions, advice, products or services available on or through them. The opinions expressed by featured authors are their own and may not accurately reflect those of Buckingham Strategic Wealth® or Buckingham Strategic Partners®, collectively Buckingham Wealth Partners. Neither the Securities and Exchange Commission (SEC) nor any other federal or state agency have approved, determined the accuracy, or confirmed the adequacy of this article. LSR-22-391
Membership required
Membership is now required to use this feature. To learn more:
View Membership Benefits