Advisor Perspectives welcomes guest contributions. The views presented here do not necessarily represent those of Advisor Perspectives.
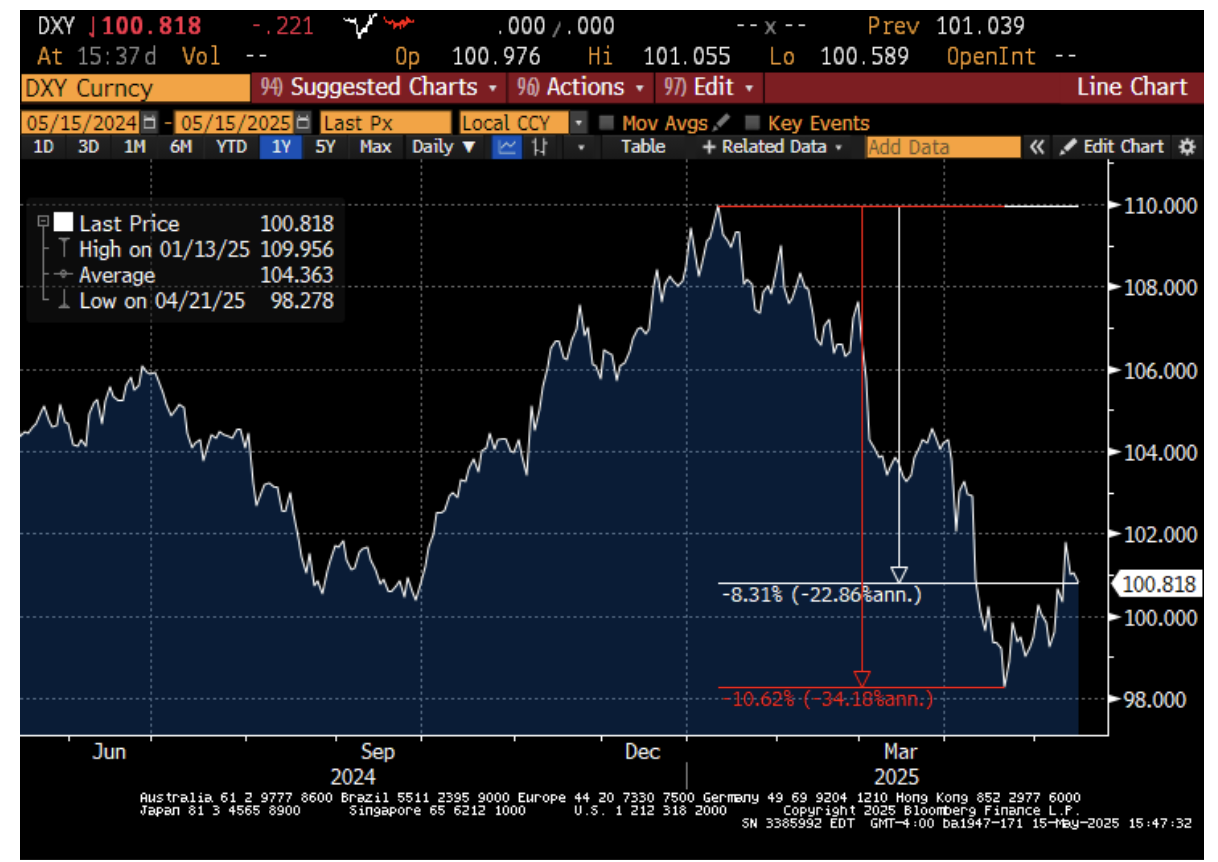
Since the beginning of 2025, the dollar is down a little over 8% relative to a basket of foreign currencies. This represents a small bounce off its lows from mid-April (at which point the dollar was down more than 10% from its January high). While the dollar has been weak all year, the move lower accelerated with President Trump’s April 2 “Liberation Day” tariff announcement.
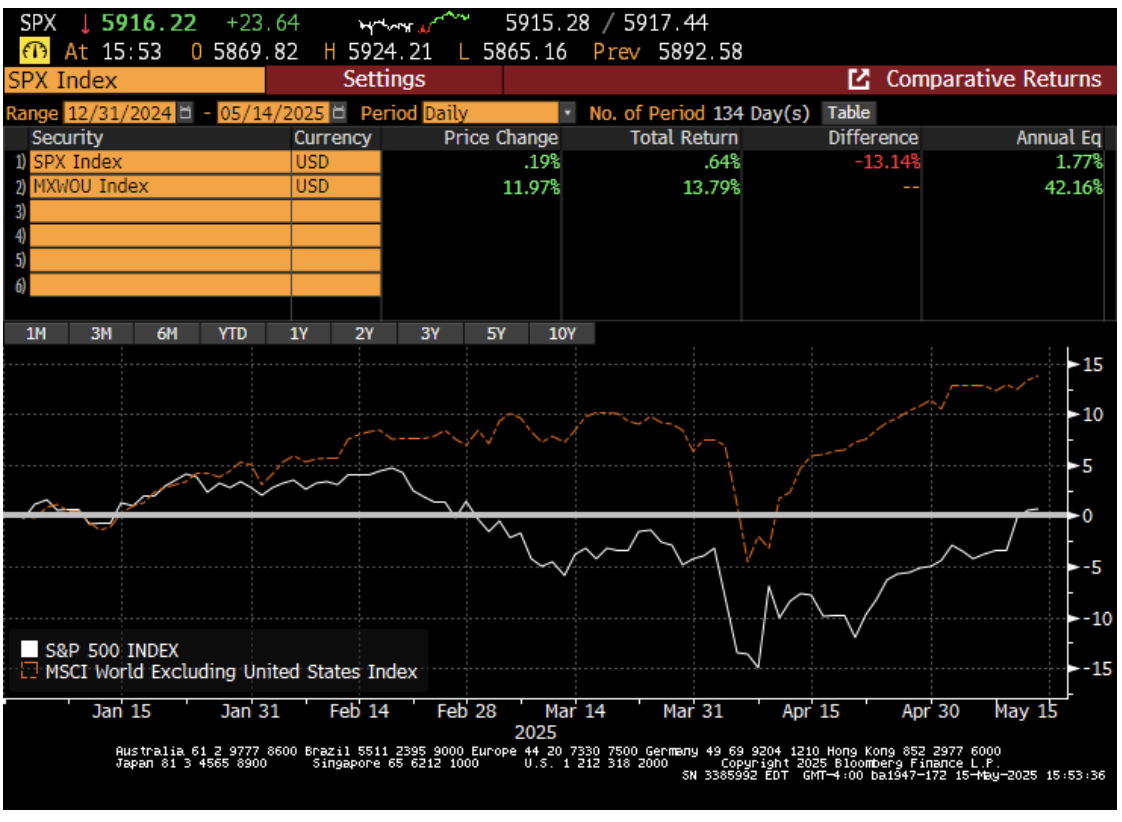
The dollar sell-off has been accompanied by a large underperformance of U.S. stocks relative to international peers. The next chart shows that the S&P 500 (SPX) has underperformed global stocks ex-U.S. (MXWOU) by more than 13% year-to-date. Part of this underperformance is attributable to dollar weakness (since MXWOU is the U.S. dollar price of foreign stocks).
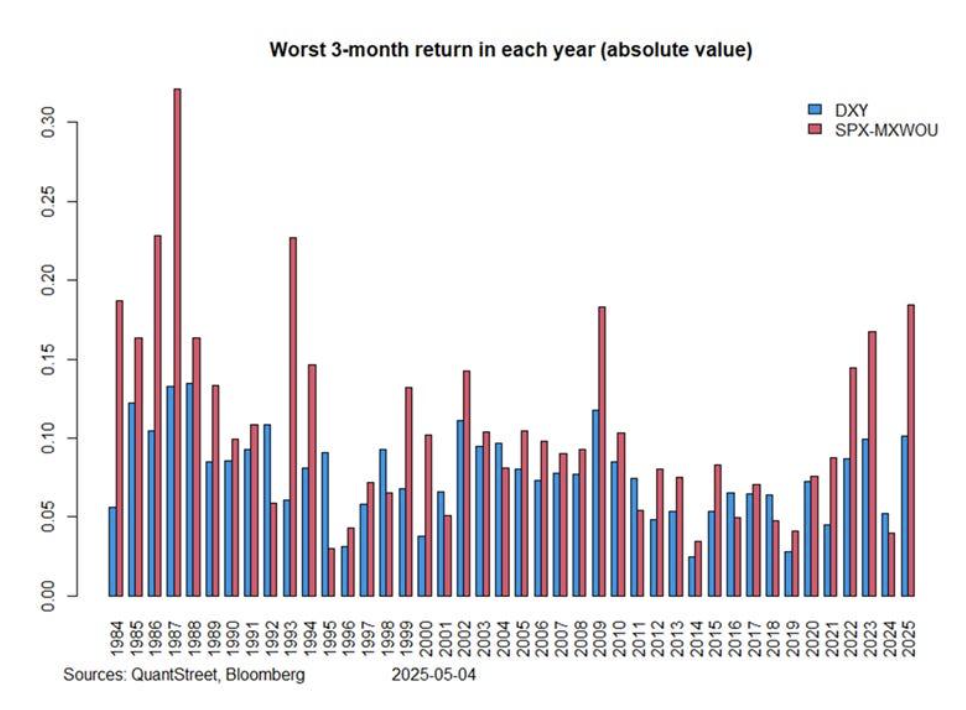
While this year’s dollar weakness and U.S. stock market underperformance are notable, neither is particularly anomalous in a historical context. The next chart shows the worst three-month dollar return and U.S. stock market underperformance (relative to MXWOU) in each year going back to the 1980s.
The blue bars show that this year’s dollar sell-off of around 10% has happened many times in the last several decades, most recently in 2022 and again in 2023. Both of those episodes were associated with U.S. stock underperformance, shown by the red bars, though this year’s trough underperformance is worse by a few percentage points. The last time the U.S. stock market was this much weaker than its global peers was during the Global Financial Crisis of 2009.
Nevertheless, in the grand scheme of things, this year’s dollar weakness and stock market underperformance are not particularly anomalous.
Why did it happen?
In a late-2024 research note on how to restructure the global trade system, Stephen Miran, chairman of the President’s Council of Economic Advisors, wrote that:
“The classic reason currencies offset changes in tariffs is that tariffs improve the trade balance, which then puts upward pressure on the currency for traditional reasons.”
That is, it was Miran’s belief (and the belief of many others) that once the U.S. began to impose tariffs on goods imports to the U.S., the dollar would strengthen, thus offsetting some of the tariff pain for U.S. consumers.
The “traditional reasons” cited by Miran reference a paper by Jeanne and Son (2024), who analyze the impact of a permanent increase in tariffs on the home country’s currency. In Jeanne’s and Son’s words: “In all cases, the exchange rate moves in a direction that tends to offset the impact of the tariff: a tariff on imports appreciates the home currency and a tariff on exports depreciates it.”
The mechanism works something like this: A permanent and unanticipated increase in tariffs on imports causes the price of imports to become high relative the price of the home good. Because (in the model) it is costly for firms to adjust prices, the adjustment to bring the relative price of the goods back into equilibrium happens through an appreciation of the home currency (thus making the import good cheaper in home currency terms).
The model is complex, and involves both supply and demand components. A simpler story is that an improved trade balance means there are fewer dollars leaving the U.S. to buy foreign goods, which effectively shifts the dollar supply curve to the left, thus increasing the price of the dollar in units of foreign currency. But the end results are the same: higher tariffs, stronger dollar.
Unfortunately, this is not (yet) how this particular tariff cycle has played out. Rather than dollar strength, we have seen pronounced dollar weakness, and alongside that, an underperformance of U.S. assets relative to foreign peers. Goldman Sachs attributes this to a decline in international dollar demand:
“The increase in trade tensions and other uncertainty-raising policies are eroding consumer and business confidence, Goldman Sachs Research senior currency strategist Michael Cahill writes in the team’s report. The team finds that changing perceptions of US governance and institutions are also affecting the appeal of US assets for foreign investors, and the rapid back-and-forth on policy decisions makes it difficult for investors to price outcomes other than high uncertainty.”
This explanation dovetails with an emerging media narrative of a decay in the dollar’s status as a reserve currency due to “erratic policymaking and rising trade barriers” (FT April 12, 2025). The same article mentions the market’s concern that “the Trump administration [may] take further steps to depress the value of the dollar.”
Though this particular concern has recently been rebuffed by members of the administration themselves: “Bessent has sought to dispel global angst that the US is actively seeking a weaker foreign exchange rate. Since February, he’s repeatedly said that the strong dollar policy remains ‘intact,’ including after Trump’s April 2 tariff announcement triggered a broad selloff in American assets.” (Bloomberg May 14, 2025).
What comes next?
The initial belief that tariffs will result in a stronger dollar have been replaced by the fear that the dollar’s status as the global reserve currency is being undermined by international angst about the Trump administration’s economic and trade policies.
So what comes next?
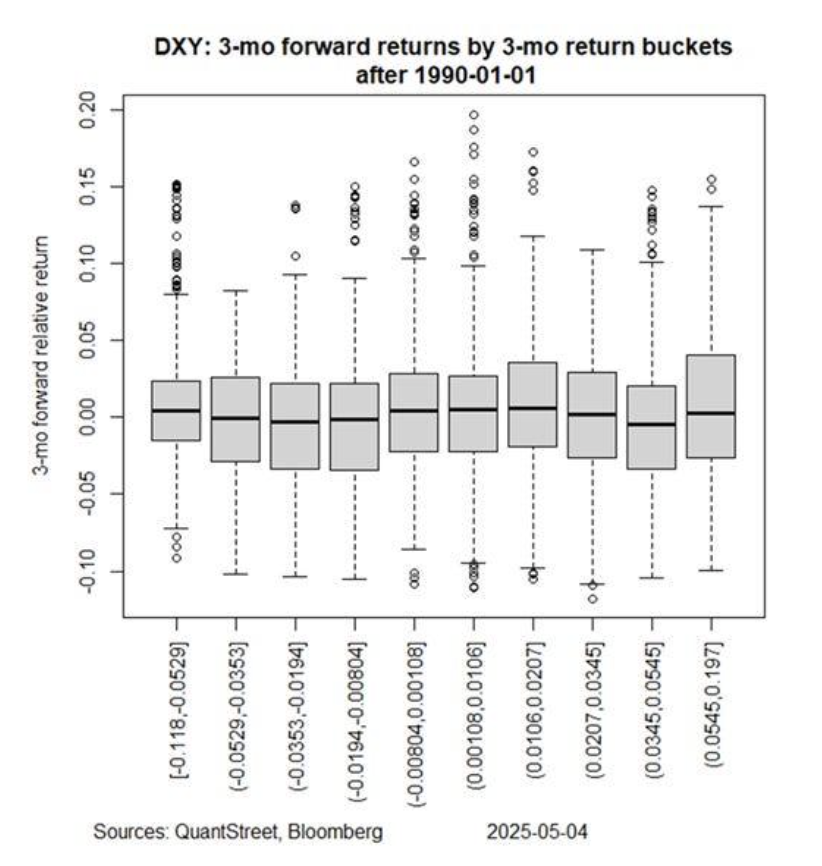
The next chart provides a historical take on this question. The x-axis in the graph shows decile buckets for dollar returns over the prior three months. The -10% trough return experienced by the dollar this year places the current situation into the 1st (worst) decile, which contains three-month dollar outcomes between -11.8% and -5.29%.
The y-axis shows the next three-month return starting from each decile bucket. The box in each decile shows the median (solid line) and the interquartile range (IQR) for future outcomes (between the 25th and 75th percentile). The top horizontal line (top whisker) represents the 75th percentile plus 1.5 * IQR and the bottom horizontal line (bottom whisker) represents the bottom 25th percentile minus 1.5 * IQR. The circles in the plot show next three-month outcomes outside of the whiskers.
Most extreme future moves following a three-month period of dollar weakness tend to be to the upside, with very few (only three) extreme downside moves. From a purely statistical viewpoint, the dollar has the potential to see strong next three-month returns.
Turning to the specifics of the present situation, the Trump administration has backed away from the more extreme aspects of the initial April 2 tariff announcement. Since that time, we’ve signed a trade deal with the U.K. and had fruitful negotiations with China, which led to a temporary (and hopefully ultimately permanent) reduction in reciprocal tariffs. There are active negotiations with many other countries.
In addition to this, the Trump administration has secured an agreement with Saudi Arabia in which the pledge to invest $600 billion into the U.S. In a gigantic order, Qatar has committed to buy 210 planes from Boeing, propelling Boeing’s stock to a 50% gain from its early-April lows. This is in addition to the hundreds of billions of dollars major corporations — e.g., Apple, Nvidia, and TSMC — have pledged to invest in high-tech manufacturing capacity in the U.S.
One may be forgiven for thinking that the Trump administration’s economic policy decisions are not quite as erratic as advertised. If market perception comes around to this point of view, and as long as the administration does not embark on a weak-dollar policy — which they have said they will not do — the dollar may yet begin to rally, and U.S. assets may reverse some (or all) of their recent underperformance relative to the rest of the world.
Harry Mamaysky is a professor at Columbia Business School and a partner at QuantStreet Capital.
QuantStreet is a registered investment advisor. It offers financial planning, separately managed accounts, model portfolios and portfolio analytics, as well as consulting services. The firm’s approach is systematic, data-driven, and shaped by years of investing experience. To work with or learn more about QuantStreet, contact us at [email protected] or sign up for our email list.
A message from Advisor Perspectives and VettaFi: To learn more about this and other topics, check out some of our webcasts.
Read more articles by Harry Mamaysky
 Advisor Perspectives welcomes guest contributions. The views presented here do not necessarily represent those of Advisor Perspectives.