Advisor Perspectives welcomes guest contributions. The views presented here do not necessarily represent those of Advisor Perspectives.
The Conclusion in Advance
“Everyone knows” falling interest rates are good and rising interest rates are bad for bond investors. But “everyone” is generally wrong. If, as is true of most individual investors, your fixed income portfolio has a shorter duration than does the future spending (of all kinds, even legacy) towards which you are investing, then as a bond investor you are better off with rising than you are with falling or stable interest rates, short-term losses from rising rates notwithstanding.
When I used the same cattle prod of an opener in my last article, the “everyone” was overstated, and it is surely overstated this time, too. Yet I find it very surprising how many smart, educated financial commentators are apparently comfortable with a “falling rates as tailwind” myth, perhaps having never bothered to check the math.
Examples for Motivation
Example 1: When interest rates spiked in 2022 in response to inflation, everyone (yes, even me) was compelled to memorialize “the worst-ever year for bonds.” And indeed, it was the worst year on record for bond returns, with the Bloomberg U.S. Aggregate Bond Index, for example, posting a -13% return when it had never previously lost more than 3% in a calendar year. But was 2022 a bad year for bond investors?
Example 2: When rates rise, that’s self-evidently bad for borrowers (or irrelevant, if their rates are locked). Does it make sense that it would also be bad for lenders? 1
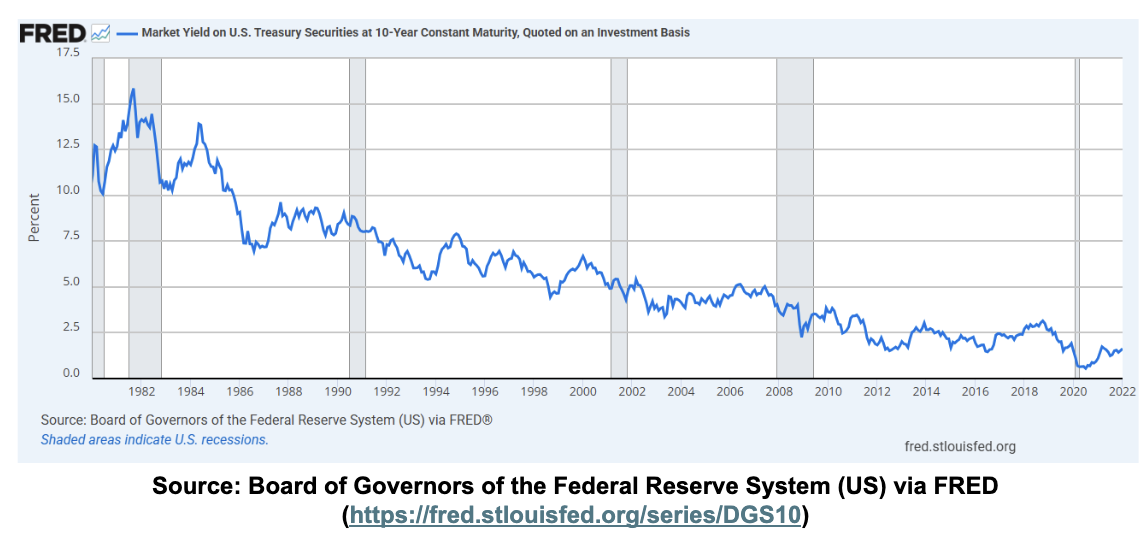
Example 3: In the early 1980s, short- and long-term Treasury rates were double-digits. They then proceeded to fall, unevenly but inexorably, for the next 30–40 years. Did these falling rates improve Treasury investors’ returns?
Cue Betteridge. But first, a couple caveats.
What This Article Is Not About
This article is not about whether rising bond rates are good or bad for stocks or other risk assets. However, it’s plausible that the arguments raised in this article apply to risk assets as well (e.g., via the application of a constant-ish equity risk premium above a varying risk-free rate2). Such questions are beyond the scope of the simpler structural argument made here. However, see endnote 8 in this closely related article.
This article is not about rising credit spreads as a potential harbinger of permanent capital loss via default. Although widening spreads have typically foreshadowed higher bond returns, this may best be viewed as a higher risk premium in exchange for increased risk, not as a free lunch. The focus here is on the relationship between bond prices and interest rates, assuming no defaults, or at least assuming default rates are the same regardless of the rate backdrop.Rather, the central thesis of this two-part series is that people get it backwards when it comes to the impact a change in interest rates will likely have on their bond investments’ ability to fund their future goals. They see their bond portfolio go up, and they think, “I’m rich!” or go down and think “I’m poor!” They are not merely overemphasizing the benefit/cost of a drop/jump in interest rates. They are directionally wrong.3
Falling Rates a “Tailwind”?
Okay, show of hands: How many of you have heard — or, be honest, even said4 — something along the lines of “falling interest rates were a tailwind for bond investors over the last 40 years”?
The intuition that rising rates are bad for bond investors is understandable. After all, every time interest rates go up, bond prices go down, so investors naturally associate rising rates with portfolio losses. Conversely, when rates fall, prices go up, so 40 years of falling rates means lots and lots of price-up-ness, right?
The problem with this intuition is that it loses sight of the fact that when interest rates rise, interest rates are higher. The present value of a fixed income investment declines, but the future expected return goes up.
How easy is it to disprove the “tailwind” notion? This easy:
- Interest rates were double-digits in the early 1980s.
- Had rates stayed double-digits, then annualized bond portfolio returns (sans defaults; just think in terms of Treasurys, if you like) would have been in the double digits.5
- But interest rates fell instead. And bond portfolio returns were single digits over those 40 years.
- QED.
Some Math
If proof-by-thought-experiment is insufficiently convincing, then here’s a little math: Suppose each year, an investor buys the latest 10-year Treasury STRIPS (i.e., no coupons, for simplicity), selling out of the prior year’s STRIPS to make the purchase. To calculate the performance of this chained 10-year series, we’ll make two contradictory simplifying assumptions, both of which tilt in favor of the tailwind hypothesis:6
A. The full year’s change in rates occurs immediately.
B. Nonetheless, the bond accrues the beginning-of-year interest rate over the course of the year.
We model (A) as an increase/decrease equal to the change in present value of a 10-year zero given an immediate drop/jump in interest rates from the prior 12/31 level to the next. Then we model (B) by growing the result of (A) by the 10-year interest rate on the prior 12/31.
Let’s consider three rate change patterns:
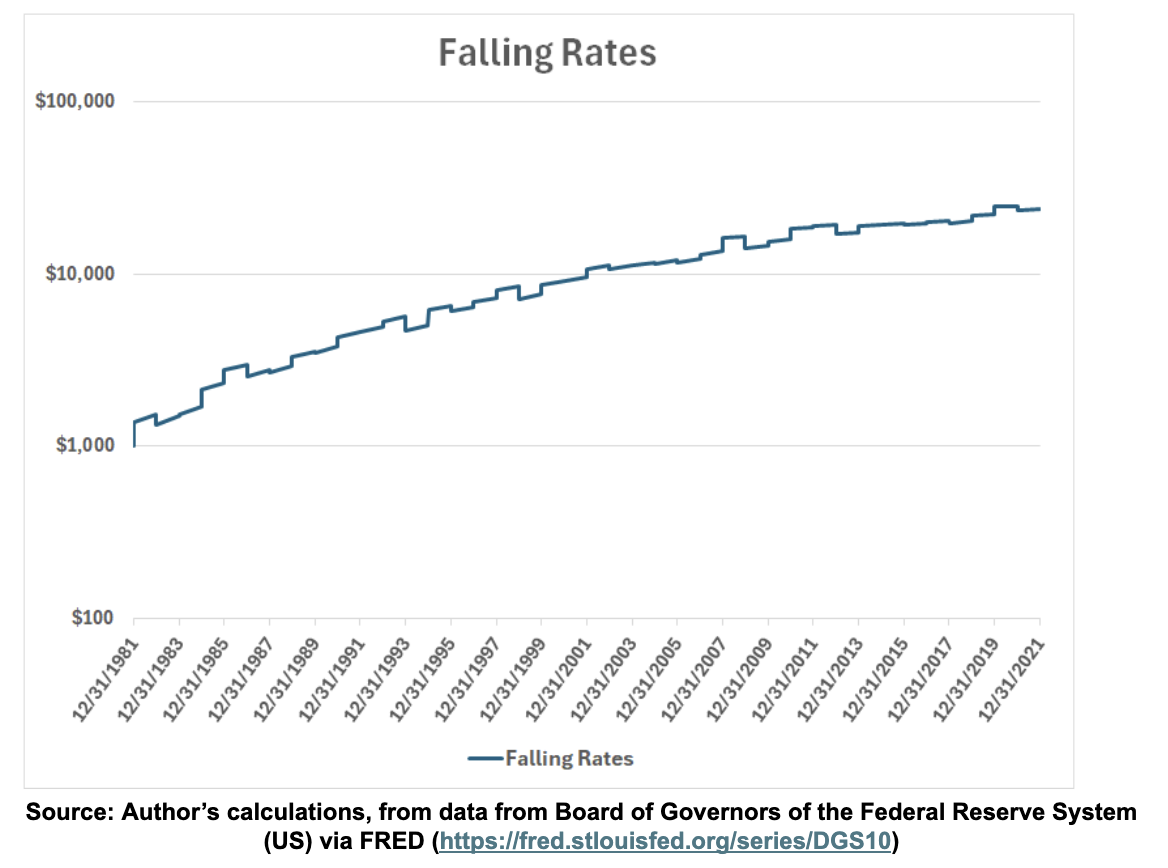
Falling rates: Start with the 12/31/1981 interest rate (a local maximum at 13.98%) and calculate the total return over the 40 years using the annual 12/31 10-year constant maturity Treasury (CMT) rate from the Federal Reserve’s FRED database.7 10-year rates were just 1.52% as of December 31, 2021, so rates did indeed do an awful lot of falling.
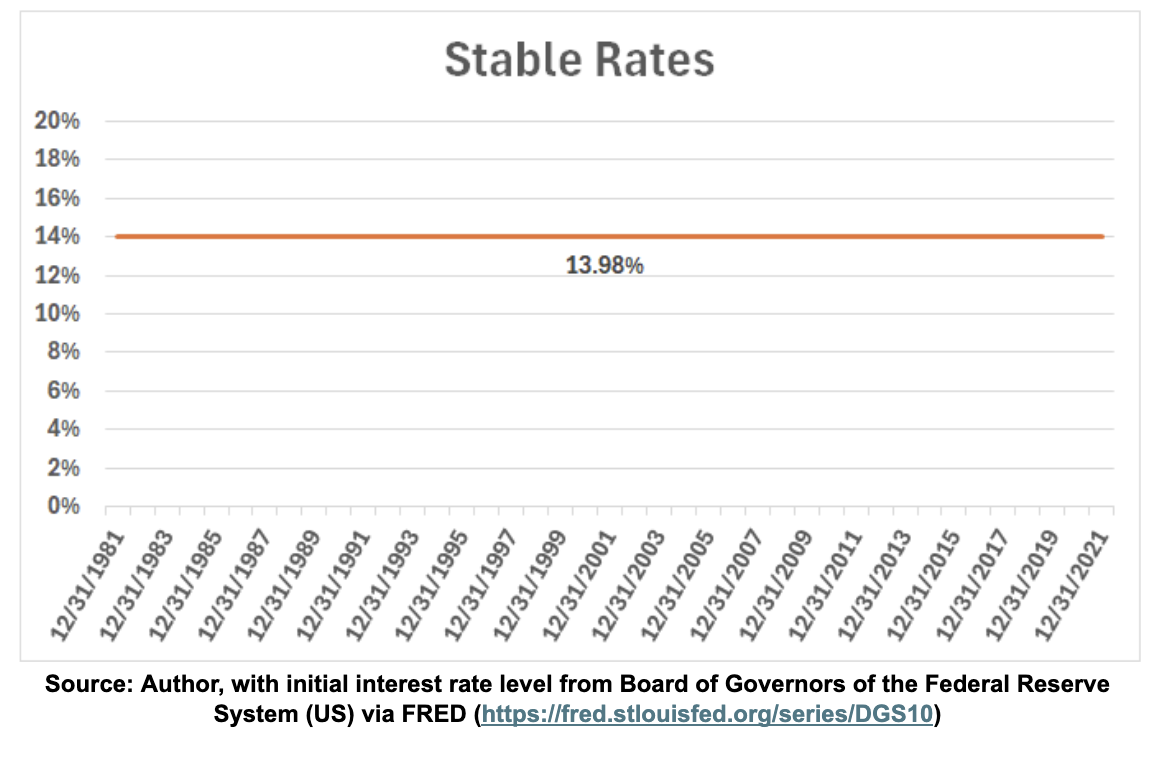
Stable rates: A revisionist history where 10-year rates remain at the 12/31/1981 level (13.98%) for 40 years.
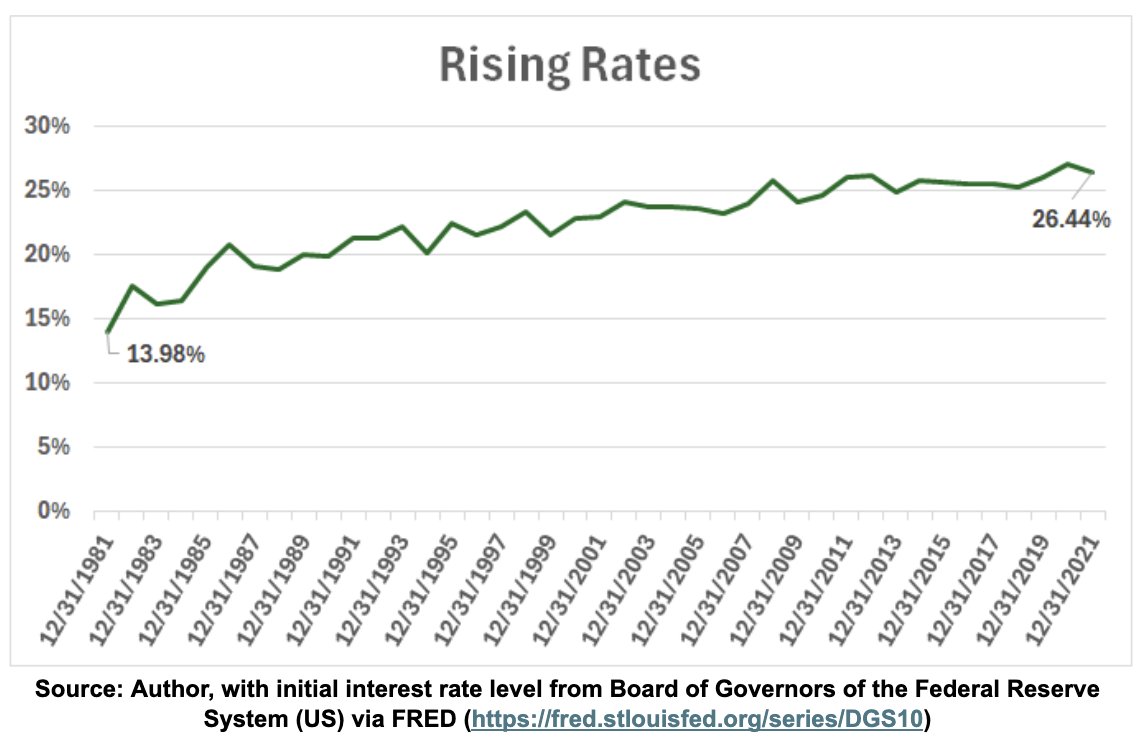
Rising rates: A yet-more-revisionist history where each year we impose the arithmetic opposite of the interest rate change that actually occurred.
Here’s what the experience looks like for the “falling rates” scenario:
The graph is punctuated by more and larger sudden jumps (our all-at-once annual rate drops) than sudden declines (annual rate increases). However, on a log scale, the growth rate noticeably tapers off as the negative effects from smaller interest rate accruals start to overwhelm the positive immediate effects from interest rate declines.
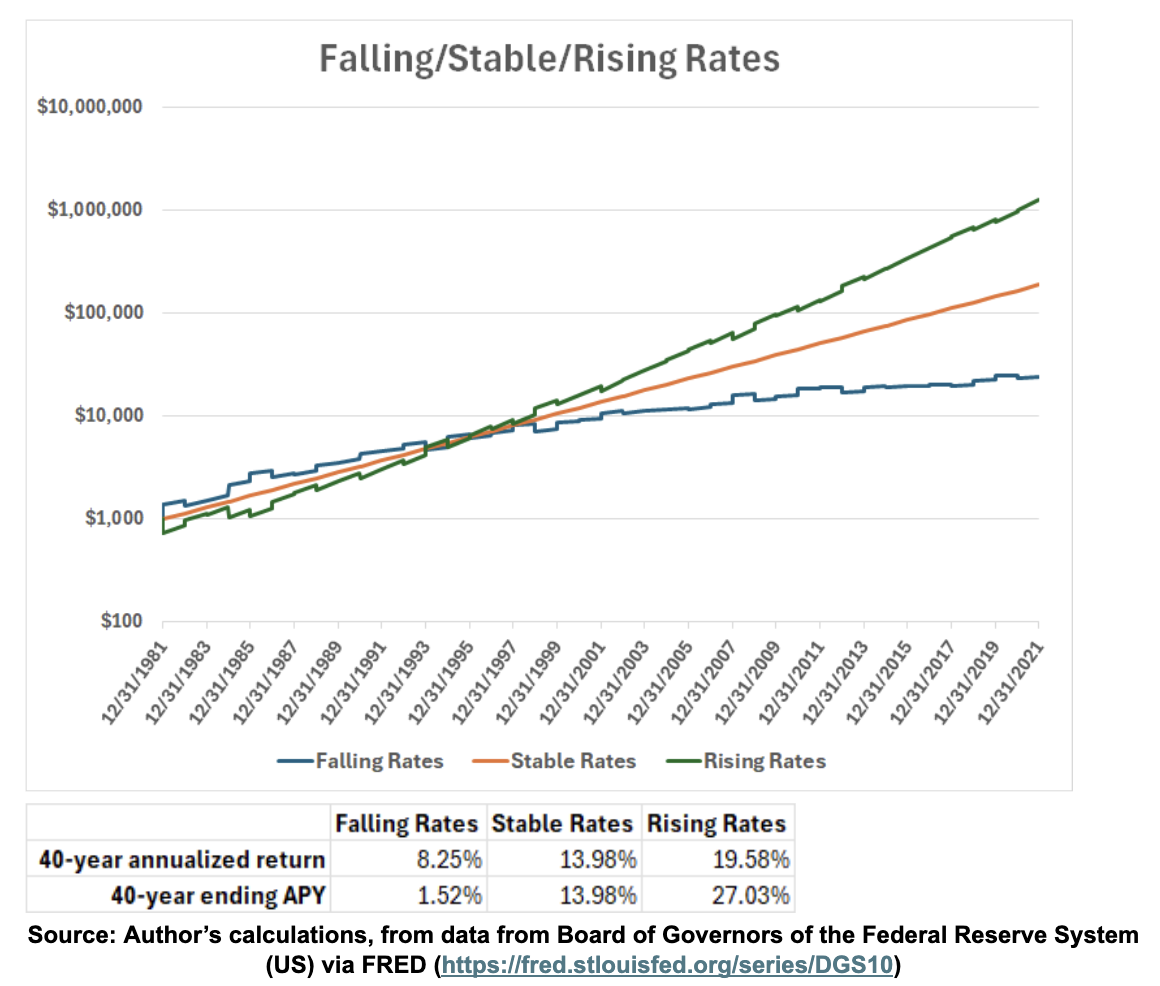
Now let’s add in the stable and rising rate scenarios:
Again, 10-year Treasury rates began this period at nearly 14%, and rates fell all the way to 1.5% over the ensuing 40-year period. Yet even when we make simplifying assumptions that heavily favor the “falling rates as tailwind” hypothesis, the calculations fail to achieve double-digit returns, while merely stable rates are locked in at the original 14% annualized return and rising rates — that ostensible bond investor bogeyman — clock in at a preposterous 19%+ annualized return, despite the frequent clobbering from one-time rate jumps.
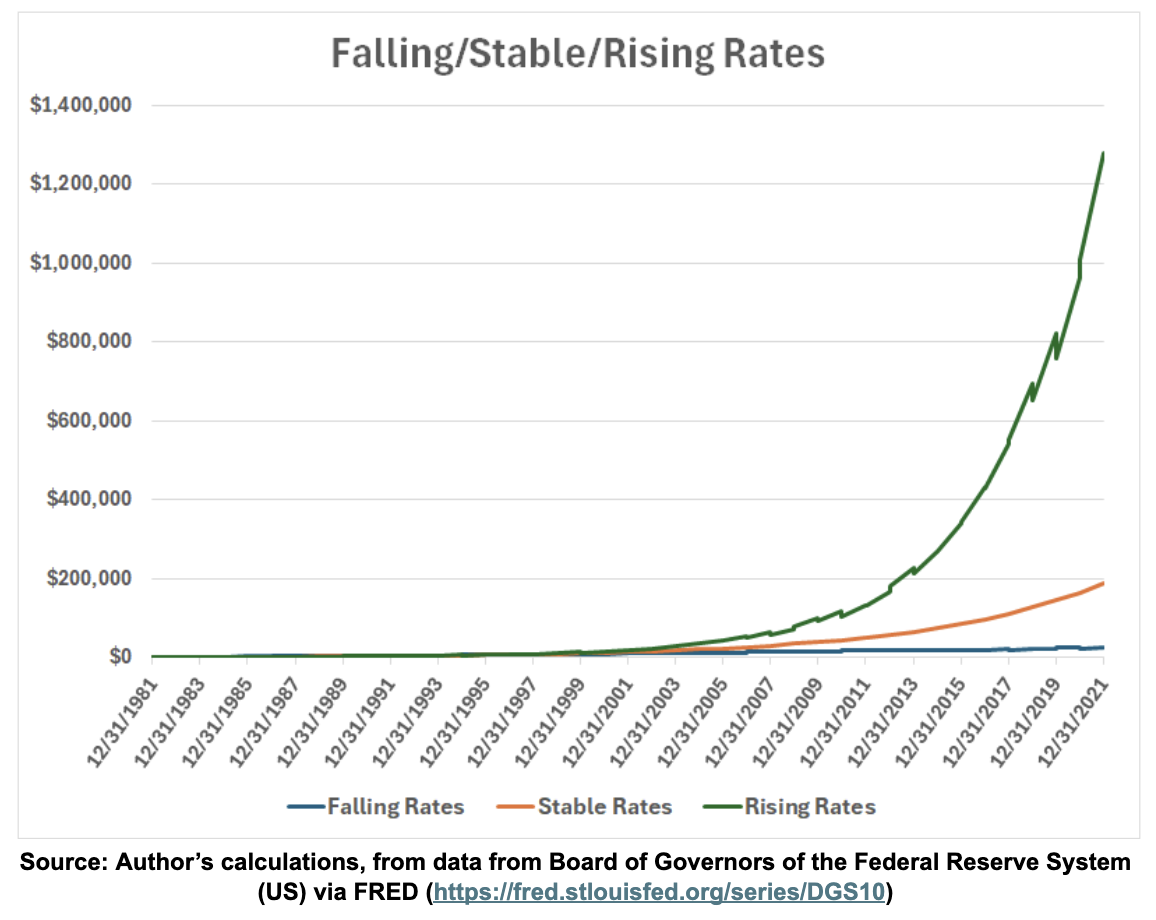
For the fun of it, let’s look at these curves on a linear scale:
But what kind of wind are rising rates now?
Of course, this 40-year period was a great backdrop for bond investors. But falling rates are not the magic investment return fairy that produced the happy outcome. Abnormally high rates to begin with were the key catalyst.8
But Wait!
Despite the enormous long-term outperformance of a rising interest rate series, we surely can’t help noticing that the falling rate series starts off in the lead, with stable and rising rates only catching up over time. Why is that?
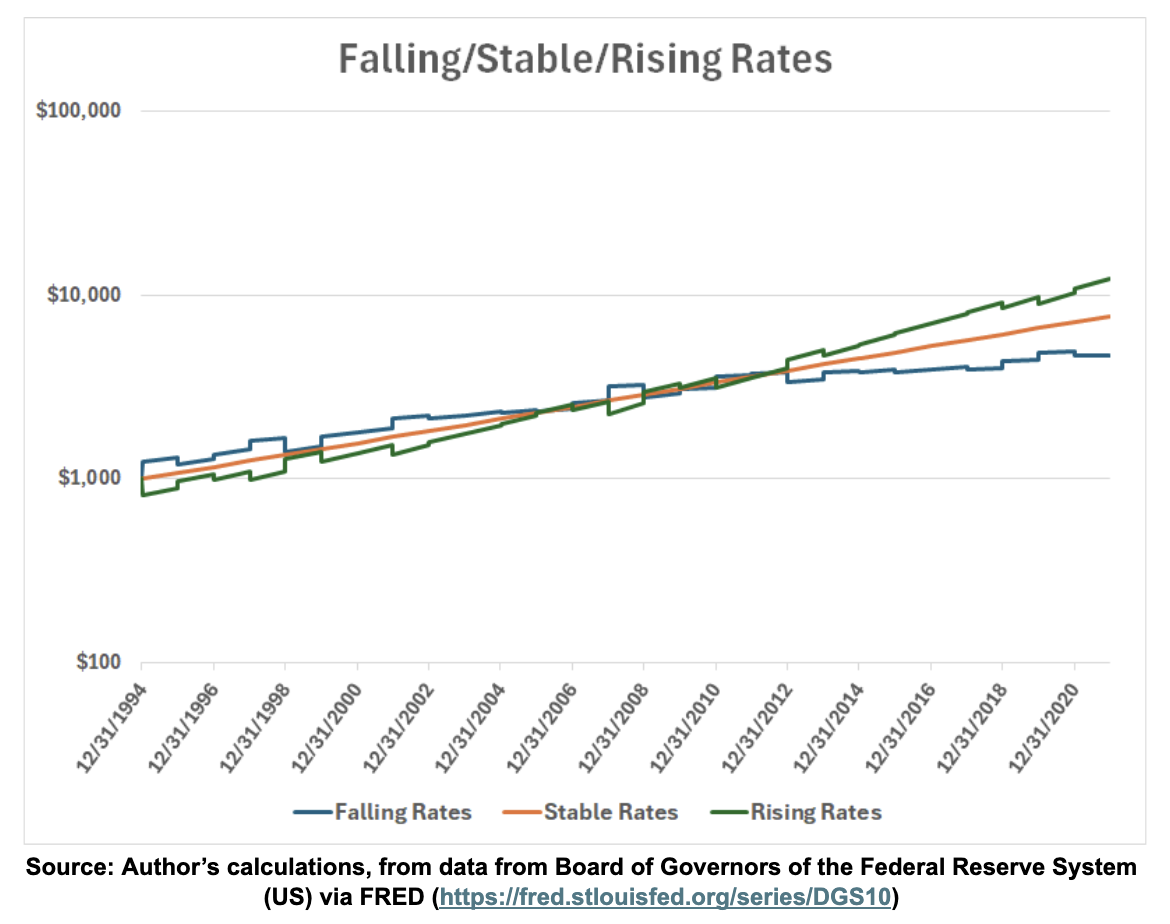
A simple hypothesis would be that falling rates worked as more of a tailwind in the 1980s and then stopped working thereafter. But this is wrong. For example, here’s what it looks like if you start the same process on 12/31/1994, just after the crossover event in the above chart.
Despite starting right when the rising rate series started to explode ahead in the last chart, this chart commences with falling rates in the lead for a decade-plus once again, before they fall behind for good. Hmm…
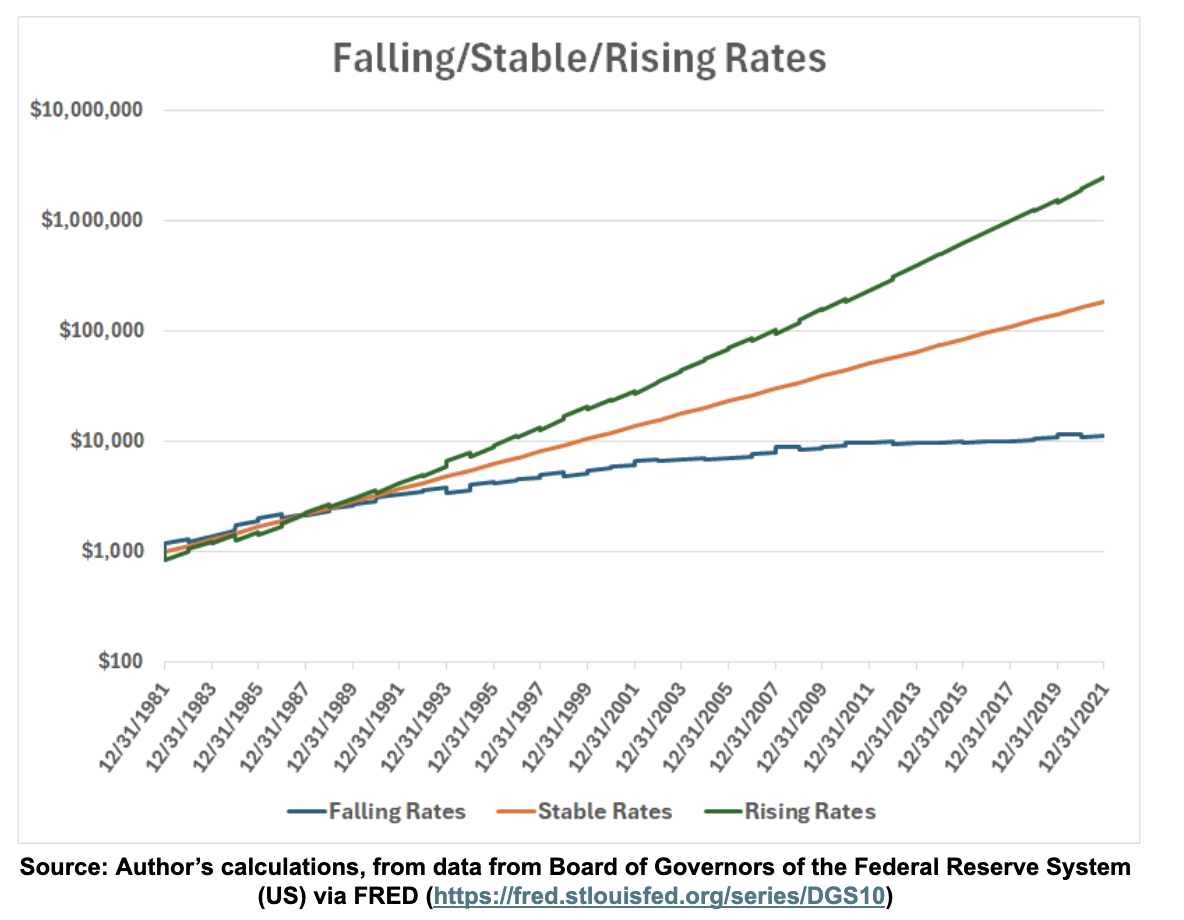
For another clue to what’s going on, here’s what the original time frame looks like if we roll 5-year Treasurys annually (with our simplified return assumptions) instead of 10-year Treasurys.
It’s the same basic outcome, except that the falling rates series drops back into last place sooner. Hmm, again…
Thought experiment: How long would it take for the falling rate series to fall behind if we simulated this using short-term T-bill rates instead? (Hint: This is not hard.)
So, it seems it is possible for falling rates to be good and rising rates to be bad for bond investors, but only if you hold longish-term rates for a shortish-term time. Can we formalize this observation? What does it mean for real-world bondholders? Aside from a suggestion that the word “duration” in the opening paragraph might have something to do with it, I can only recommend reading Part 2 of this series of articles!
In his roles as chief investment officer for Round Table Investment Strategies and portfolio manager for Torren Management, Nathan Dutzmann is responsible for applying financial science and investment research to the process of constructing portfolios tailored to the individual needs and goals of clients nationwide. Nathan was previously an investment strategist with Dimensional Fund Advisors and a partner and chief investment officer with Aspen Partners. He is also a member of the investment industry advisory council for The American College of Financial Services. He holds an MBA from Harvard Business School and a master’s degree in international political economy and a bachelor’s degree in mathematical and computer sciences from the Colorado School of Mines.
Endnotes
1. I’m cheating a bit with this one. The “rates are locked” thing causes bidirectional ambiguity. The next article will explain, and I want thinking caps firmly in place!
2 Down here in the footnotes, a more detailed explanation: Whether the equity risk premium (ERP) is viewed as a constant or variable factor, and whether it is viewed as a single value or a value with a term structure, it is still a risk premium above something. That something, logically, is the risk-free rate, an interest rate of the sort we’re investigating in this article. Unless our assumptions are such that the ERP grows when rates fall and shrinks when rates rise, by an amount greater than the change in underlying rates (which… what?), it seems reasonable to assume that equity expected returns, a combination of risk-free rate and ERP, positively correlate with interest rates. However, the fact that equity returns historically do not reliably comove with bond returns should give us pause! As, perhaps, should the fact that publicly traded companies are themselves consumers of debt whose expected profitability should benefit from lower rates. Notably, real-time adjustments to the latter objection (company as borrower) might partly explain the former (non-correlation of debt and equity), though time-varying risk premia are very probably involved as well.
3 I owe this paragraph, including the “I’m rich/poor” bit, to my favorite finance professor, Nobel Laureate Bob Merton, specifically from a video of a lecture that sadly seems to have disappeared from the internet.
4 I would like to take this opportunity to point out that my published article history is sufficient to prove that I have been a heavy em dash user since generative AI was nothing but twinkle in Sam Altman’s eye. (Eleven em dashes in this article alone…okay, that’s a little sad, actually.) But after all, AI had to learn the behavior from humans first, right?
5 In case it’s not obvious, the construction is thus: With no rate changes, there would be no exogenous bond price changes. All bond returns would be due to yield alone. And yields would be double-digit, by definition.
6 Here is why these assumptions are a tailwind for “tailwind”:
- Since rates generally fall during the period in question, the immediate imposition of the rate change means you’re typically applying the (always positive) interest rate to a basis that has experienced a step-change upward, rather than the more realistic experience of accruing interest rate variations throughout the course of the year.
- Despite pretending rates (usually) drop at the beginning of the year, we are nonetheless pretending that the bonds accrue the higher, pre-drop rate over the course of the year.
7 For simplicity, I’ve treated CMTs as if they were APYs (i.e., with annual compounding) in this article. CMTs should properly be converted to APYs via the method outlined by the Treasury here. I’ve done the math, and I’m happy to share it, but it makes no qualitative difference.
8 Corollary: Run away from any projection or Monte Carlo simulation than uses historical bond returns to model the future.
A message from Advisor Perspectives and VettaFi: To learn more about this and other topics, check out some of our webcasts.
More Private Equity Topics >
 Advisor Perspectives welcomes guest contributions. The views presented here do not necessarily represent those of Advisor Perspectives.