Advisor Perspectives welcomes guest contributions. The views presented here do not necessarily represent those of Advisor Perspectives.
Investors and asset managers are often looking to markets to see if there are any early warning signs before a market blows up. Some investors swear by metrics such as credit expansion, IPO mania, or even meme stocks as early evidence that something is about to go wrong. Correlations between assets are often cited as an overlooked warning sign.
Because of this, we decided to examine six different major volatility events over the past 30 years and see what happened to asset correlations before and during these events. To examine a full spectrum of changing correlations, we could hopefully find early indicators before market/VIX blowups in the U.S.
What we found in general was that excessively high correlations between equity classes are typically present leading up to a VIX event, and excessively negative correlations between gold and equity also is also a leading indicator. Diversification benefits in general unravel a bit during the actual market blowup, with most assets becoming more positively correlated.
The Data Inputs
To study this, my research assistants (Hugh Holtman and Ajeet Bondugula) and I pulled data for all asset prices going back 30-plus years. Included in this full asset pricing data set were commodities, debt, and equities. For commodities, we included gold, oil, natural gas, silver, platinum, corn, wheat, and coffee. For debt, we included high-yield debt, U.S. corporate debt, intermediate U.S. Treasuries, U.S. long-term Treasuries, the MSCI World Bond Index, TIPs, munis, GNMA, and short-term Treasuries. For equities, we included small-cap stocks, large-cap stocks, international equity, and U.S. growth equities.
We identified six major VIX spikes as our volatility events. In these VIX spikes, we looked at events during which the VIX doubled in less than three months. The final study included VIX events in 1998, 2002, 2008, 2010, 2011, and 2020.
Next, with this data in hand, we put together correlation matrices for the assets three months prior to the VIX event and an equivalent correlation matrix for the assets during the month of the VIX spike. We then examined how correlations changed in this three-month period for all VIX spike events.
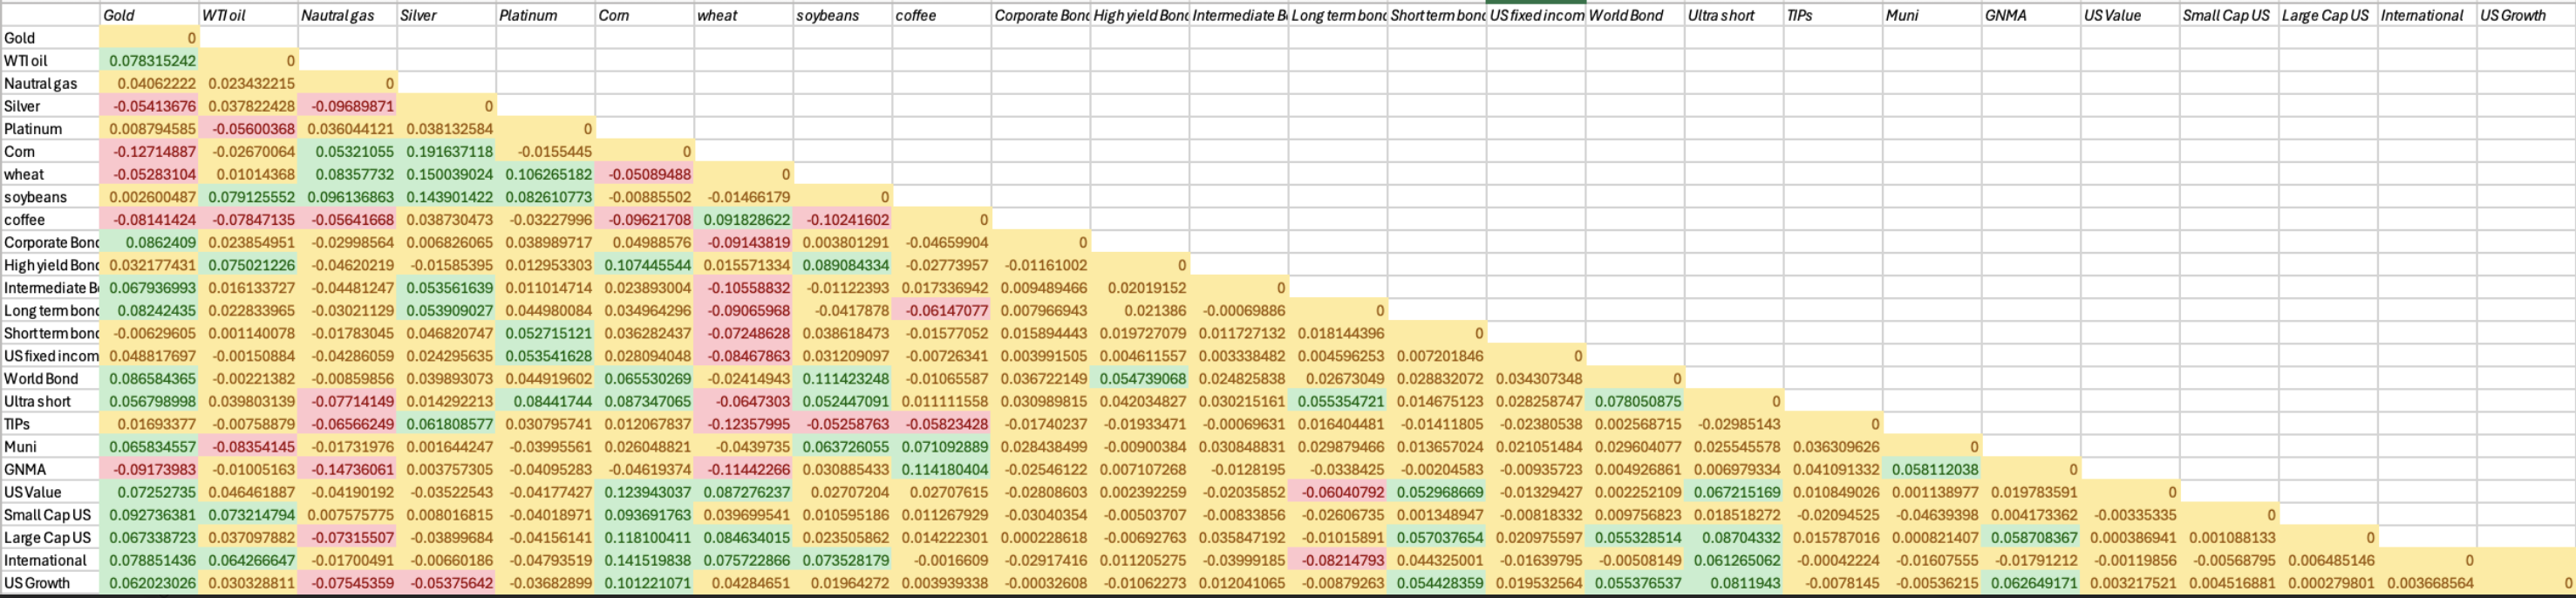
Below presents a conglomerate picture of all VIX events combined into one correlation matrix. This conglomerate picture details the change in correlations from three months prior to the event date (month of the VIX event).
Source: Authors and Morningstar Direct
Findings
The first interesting finding is the observation that the correlation between gold and equities has a positive and significant change. This means gold prices and equities become less negatively correlated once a market breakdown happens. We see a similar story with short-term debt and equities.
Following this, we note that diversification breaks down in these volatility events. Sixty percent of correlations increase during the VIX spike event. This means 60% of the categories begin to trade more positively with each other, which indicates a breakdown in the diversification benefits of holding different asset classes in a portfolio.
When we look at correlations entering the VIX spike (right up to it), we see excessively high correlations between all equity categories. On average, we see our value, growth, small-cap and large-cap indexes developing 0.90-plus correlations in all lead-ups to the VIX spikes.
In addition, we see excessively negative correlations between gold and equities as compared to historical levels, with gold and equity indexes averaging a -0.40 correlation in the lead-up to the volatility event. Further, gold and bonds demonstrate a higher-than-average correlation leading into the VIX spike. These are signs of typical froth or mania at the tops of valuation levels.
In general, the results highlight that significantly increasing correlations between equity classes could be an indicator of froth, as well as excessively negative correlation between gold and equities. Once you are aware that a VIX spike is in its early stages, be prepared to see diversification benefits dry up as things move in the same direction.
Dr. Derek Horstmeyer is a Professor of Finance at George Mason University. His research focuses on ETF performance and corporate governance. He also runs the Montano Student Managed Investment Fund.
Hugh Holtman is a Sophomore at The Potomac School pursuing a broad honors curriculum with a focus on finance. He is a founding member of the 2025-2026 Wharton Global High School Investment Competition team and competes in varsity wrestling and cross country.
Ajeet Bondugula is a student at Rock Ridge High School in Ashburn, Virginia. He is interested in finance and economics, especially asset-class correlations, market stress, and predictive analytics. He plans to continue his studies at the university level in financial modeling and econometrics.
A message from Advisor Perspectives and VettaFi: Did you know that we provide daily updates when key market and economic indicators change? Visit the AP Charts and Analysis site to get our expert insights.
Read more articles by Derek Horstmeyer, Hugh Holtman, Ajeet Bondugula
 Advisor Perspectives welcomes guest contributions. The views presented here do not necessarily represent those of Advisor Perspectives.