Stocks in the US seem unstoppable but investors shouldn’t be complacent because there are a number of markers suggesting the rally is more fragile than it seems.
It’s been a roller coaster year for markets. We’ve had tariff wars, actual wars, concerns about the weaponization of the dollar, an artificial-intelligence spending boom and some high-profile bankruptcies, or “cockroaches” in the memorable phraseology of JPMorgan Chase & Co. Chief Executive Officer Jamie Dimon. Yet despite the turmoil, stocks are very near all-time highs.
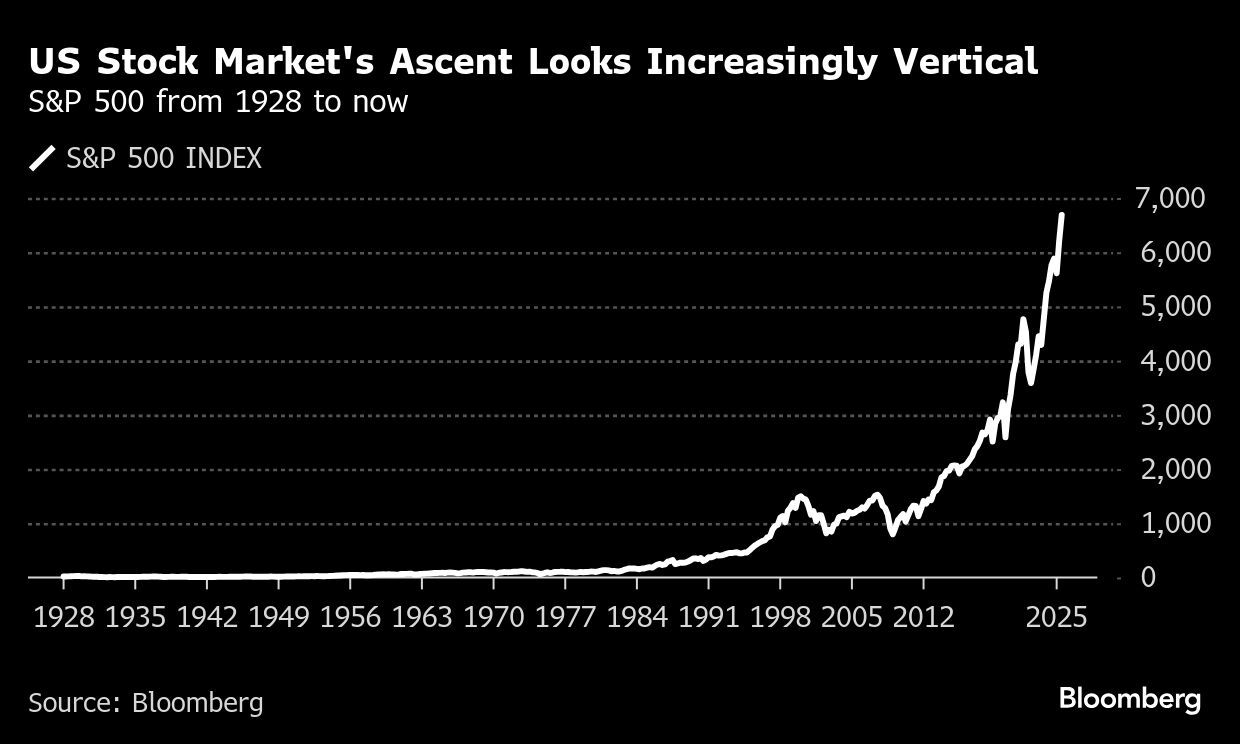
Not only that, from a longer-term perspective, the rise in stocks is becoming parabolic. To any investor seasoned in markets before crypto’s time – where so-called HODL-ers fear little from near-vertical market moves – that’s typically a warning sign.

However, picking market tops is a mug’s game. Unlike market bottoms, which tend to be dramatic and V-shaped, tops are a longer-term process that can unfold over many months. But that doesn’t mean there aren’t signs that a top is forming, and that investors should start to be a little more fearful of the rally – or at least skeptical – and less greedy.
And there are several reasons to be so inclined. Let’s start with something very unusual, related to technicals. These are a way of analyzing the stock market and its constituents to gauge whether it is overbought, and therefore more likely to correct lower, or oversold and perhaps ready to deliver a strong bounce.
A “negative divergence” is when a technical study is telling us the overall health of the stock market is deteriorating even as the price increases, which can be a bad omen. The number of stocks in the S&P 500 Index making a new one-year low has been rising even as the market was rallying. In fact, this divergence has reached an extreme never seen before.
The previous times when this happened were before the S&P 500 corrected in 1998, and not long before the major market top in March 2000, when the tech bubble burst. With AI companies spending hand over fist on data centers, it’s far from inconceivable we’re nearing the threshold of another tech bust.
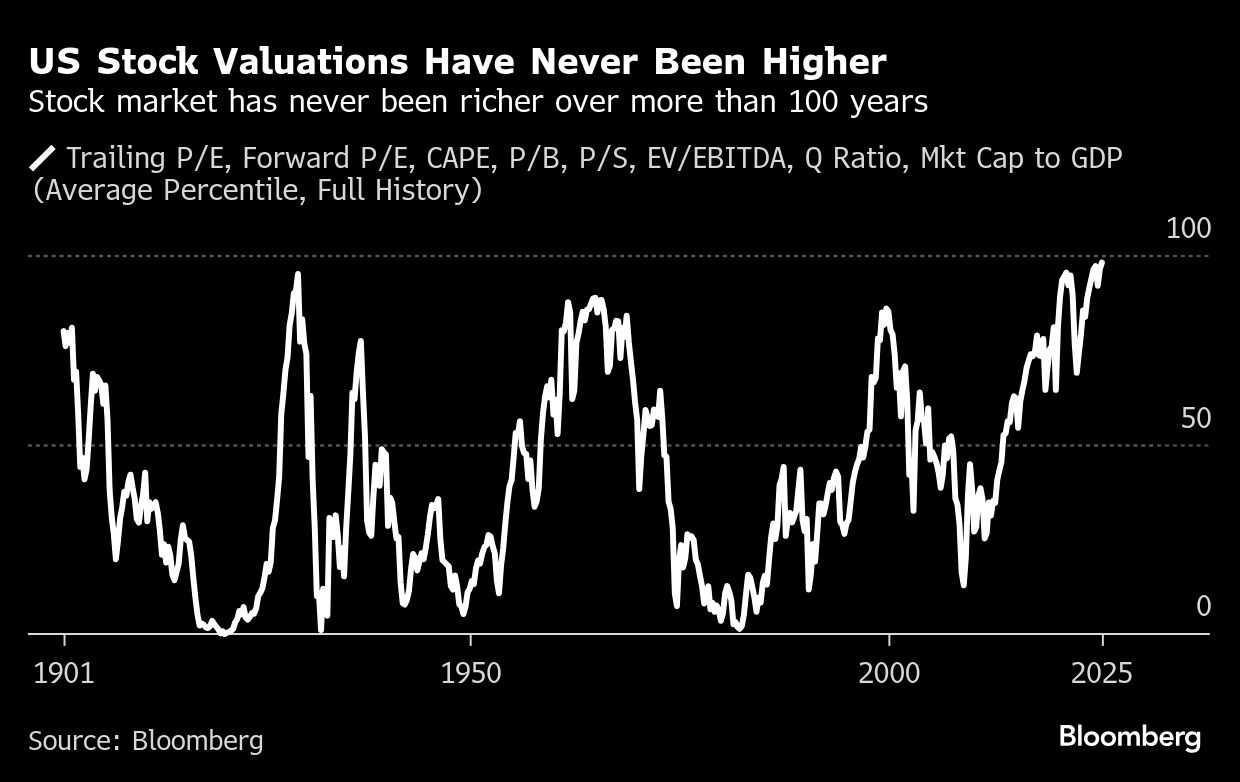
And the fall could be steep. Valuations don’t tell you when the market will fall but they can give a good indication of how far it will eventually fall. A blended average of several valuation metrics for the US stock market is at a record high in data going back over 100 years. If the market could drop 30% to 50% as it has on other occasions when valuations were exceptionally high, that does not give one investing in equities today great confidence.
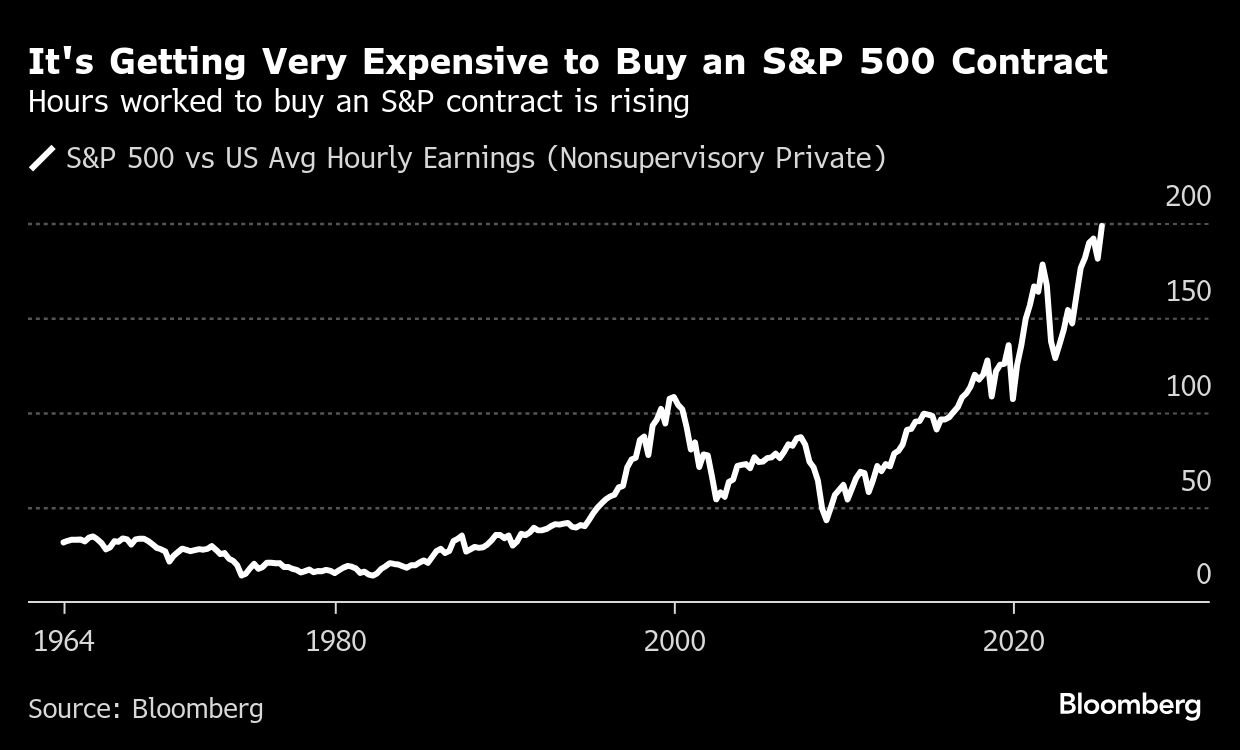
Valuations are also becoming high in a very real sense. The number of hours that need to be worked, based on average earnings, to buy one contract of the S&P 500 index has jumped to more than 200. That was only 140 hours on the eve of the pandemic and not much above 100 hours at the market top in 2000, which preceded a fall of more than 50% over the next two years.
There are a lot of people potentially ready to sell stocks, too. The household sector in the US has never owned so many equities relative to their financial assets. When households gorge themselves on stocks it tends to push valuations up past sustainable levels and lead to a long period of poor returns. It’s another reason to play it safe with this market.
Markets are surfing on a wave of optimism for now, but buyer beware: on the surface, all might look rosy, but underneath there are enough warning signs that stocks may suddenly reverse course. It’s hard to know what the ultimate catalyst will be, but when it arrives, we will know all about it. Portfolios that are insured against losses will be at a big advantage.
Simon White is a macro strategist and his observations are not intended as investment advice.
A message from Advisor Perspectives and VettaFi: Discover something new! Click here to register for our upcoming webcasts.
Bloomberg News provided this article. For more articles like this please visit
bloomberg.com.
Read more articles by Simon White