A third straight week of market turbulence left US equity investors searching for any edge on how to position ahead of what is normally a strong seasonal stretch for stocks.
While there was no satisfyingly simple answer to what caused last week’s manic moves, several bull narratives came under scrutiny. Artificial intelligence bets unwound, certainty in a Fed hike next month wobbled and data suggested the economy is slowing. Speculative bets, on everything from Bitcoin to profitless tech, unwound rapidly.
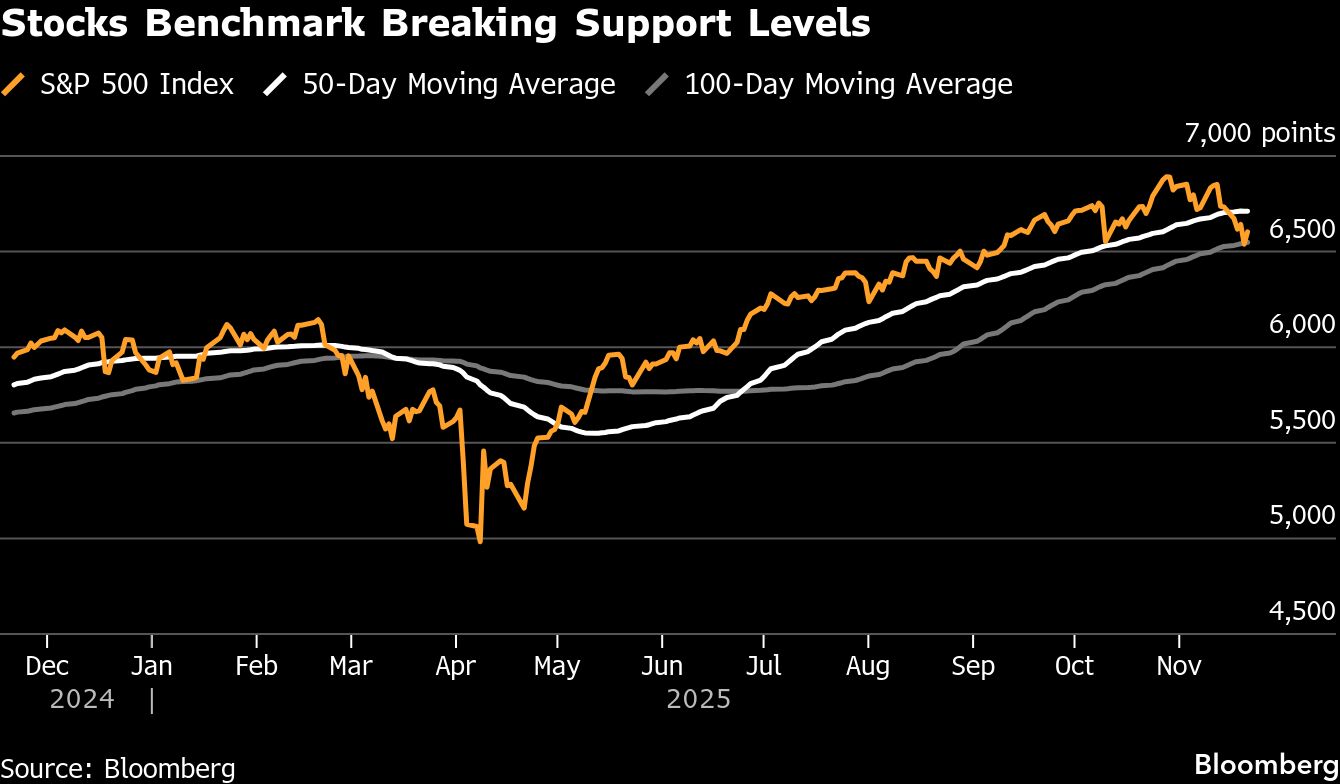
When the dust settled, the S&P 500 had fallen just a bit under 2% to 6,602.99. But along the way, the index tested some key technical supports, leaving analysts scouring charts to suss out support levels or signs of an all clear.
“The lines and boundaries are being set for the next weeks and months, and if we break them — in both directions — it will become an important signal,” said Todd Sohn, a senior ETF and technical strategist at Strategas. “Some of these lines are becoming important reference points.”
The S&P 500 fell below its average price of the past 100 days on Thursday, a level it hadn’t breached since February. Friday’s rally brought it back above the line, but not the 50 day, whose curve plateaued in an ominous sign.
“We’ve already been lightening up our positioning, and if the S&P 500 breaks below the next support levels, it would prompt us to be even more defensive,” said Joe Gilbert, portfolio manager at Integrity Asset Management.
Multiple strategists said they were watching the 6,550 level on the S&P 500, the gauge’s October low. Thursday’s selloff sent it careening past it before the Friday rebound.
John Kolovos, chief technical strategist at Macro Risk Advisors, said that a “clean break” of that support would trigger a move down toward 6,400, then 6,200 and “fully exhaust the downdraft that began in late October.”
A sustained drop below 6,550 would be a “worrisome condition,” Kovolos said, and could “not only shape things in how the rest of the year unfolds, but perhaps how next year might playout, too.”
Will Tamplin, senior analyst at Fairlead Strategies, said that 6,533 is a “natural place for an oversold bounce to unfold” and could potentially, if briefly, interrupt a correction.
The S&P 500 is down 3.5% this month, on track for its worst November since 2008. And yet technical charts are far from flashing the oversold levels that tend to precede a rebound. Some 39% of S&P 500 companies traded above their 50-day moving average lines on Friday, above the 15%-20% level that typically signals a full-fledged washout, data compiled by Wells Fargo show.
That’s not to say that the volatility will persist. The violence of Thursday’s trading triggered an overnight buy signal in Barclays Plc models. The firm’s Equities Timing Indicator, known as BETI, fell below -7 for the first time since Aug. 4, Alexander Altmann, global head of equities tactical strategies wrote in a note to clients on Friday. That level has a 10-year track record of signaling near-term advances in the S&P 500.
A worrying sign for any bull is the elevated level of the Cboe Volatility Index. It peaked at 28.27 on Thursday before falling back below 24 into the weekend. That’s still above its long-term average of 19 and a signal that sharp moves may not be over.
At Oppenheimer & Co., head of technical analysis Ari Wald says the all-clear won’t come until the S&P 500 falls all the way to 6,430 — a level that sits near a notable Fibonacci retracement, one where the index has shed 23.6% of its entire rebound since its April low.
“Should the selloff continue, 6,430 is where the S&P 500 could find a bottom,” he said.
Others are looking for support not from the index itself but from correlated factors.
“We also need to watch Bitcoin as over the last week or two, the move in cryptocurrency was leading the move in the S&P 500,” said JC O’Hara, chief technical strategist at Roth Capital Partners. “The S&P 500 won’t be able to find support until Bitcoin does and, to me, $75,000 is the support level.”
Bitcoin fell to as low as 80,553.57 on Friday.
Even after Friday’s rally, the “internal damage” to the stock market is real, Kolovos wrote in a note to clients. It is “sitting on one of the most important support levels since the April bottom,” he added.
A message from Advisor Perspectives and VettaFi: Discover something new! Click here to register for our upcoming webcasts.
Bloomberg News provided this article. For more articles like this please visit
bloomberg.com.