Advisor Perspectives welcomes guest contributions. The views presented here do not necessarily represent those of Advisor Perspectives.
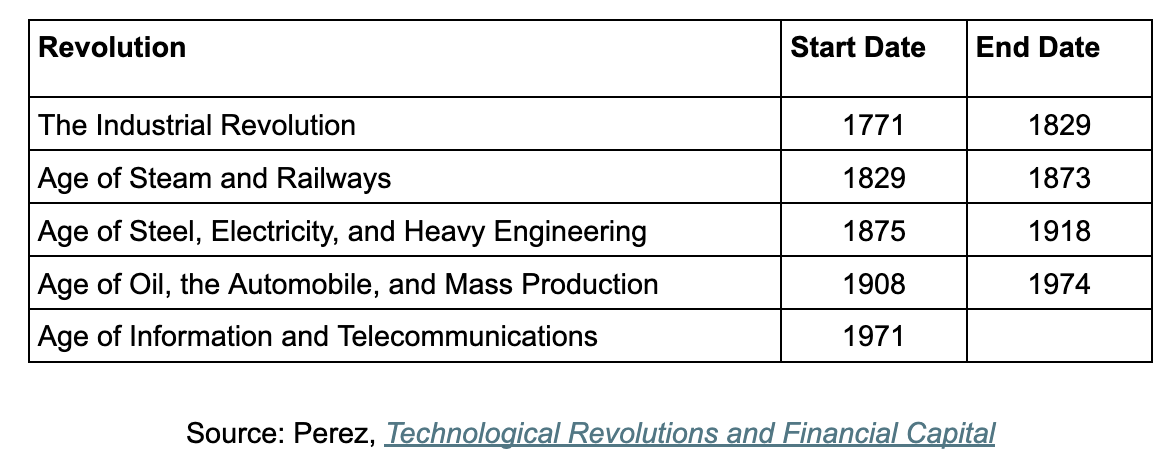
Carlota Perez, in her 2002 book "Technological Revolutions and Financial Capital," argues technological revolutions occur in roughly 50-year cycles. She identifies five such episodes, starting with the Industrial Revolution in Britain (1771) and ending with the information and telecommunications revolution in the U.S. (1971).
In light of the AI revolution — which arguably began on November 30, 2022 with the introduction of ChatGPT, almost exactly 50 years after the start of the Information Age — her book appears especially prescient.
Perez argues that each revolution proceeds in four phases:
- The irruption phase sees the introduction of the new technology to the world.
- This is followed by the frenzy stage, when society begins to understand the power of the new technology and invests resources in its development. The interaction of financial capital and technological change ultimately leads to a market crash at the end of this stage.
- At this point, the synergy stage begins, where the best uses of the technology are discovered and resources are efficiently funneled into supporting them.
- Finally, the revolution enters its maturity phase, at which point most investments have already been made, and the technology settles into the fabric of ordinary life. At this point, a new “great surge” begins as another revolutionary technology enters the public consciousness.
Against this backdrop, Perez produces timelines of the five great technological revolutions. In her estimation, the Industrial Revolution started in 1771 and lasted through 1829. At this point, the Age of Steam and Railways began, lasting until 1873. In 1875, steel, electricity, and heavy engineering began, ending in 1918. The Age of Oil, Automobiles, and Mass Production lasted from 1908 until 1974, overlapping for a decade with the end of the prior technological epoch. Finally, the Information and Telecommunications Age began in 1971 and was ongoing when the book was published in 2002.
Financial Markets and Technological Revolutions
Our contribution is to connect Perez’s timelines with stock return data, which we obtain from the macrohistory.net website. This data set covers annual economic and market statistics about 18 developed market economies, starting in 1870.
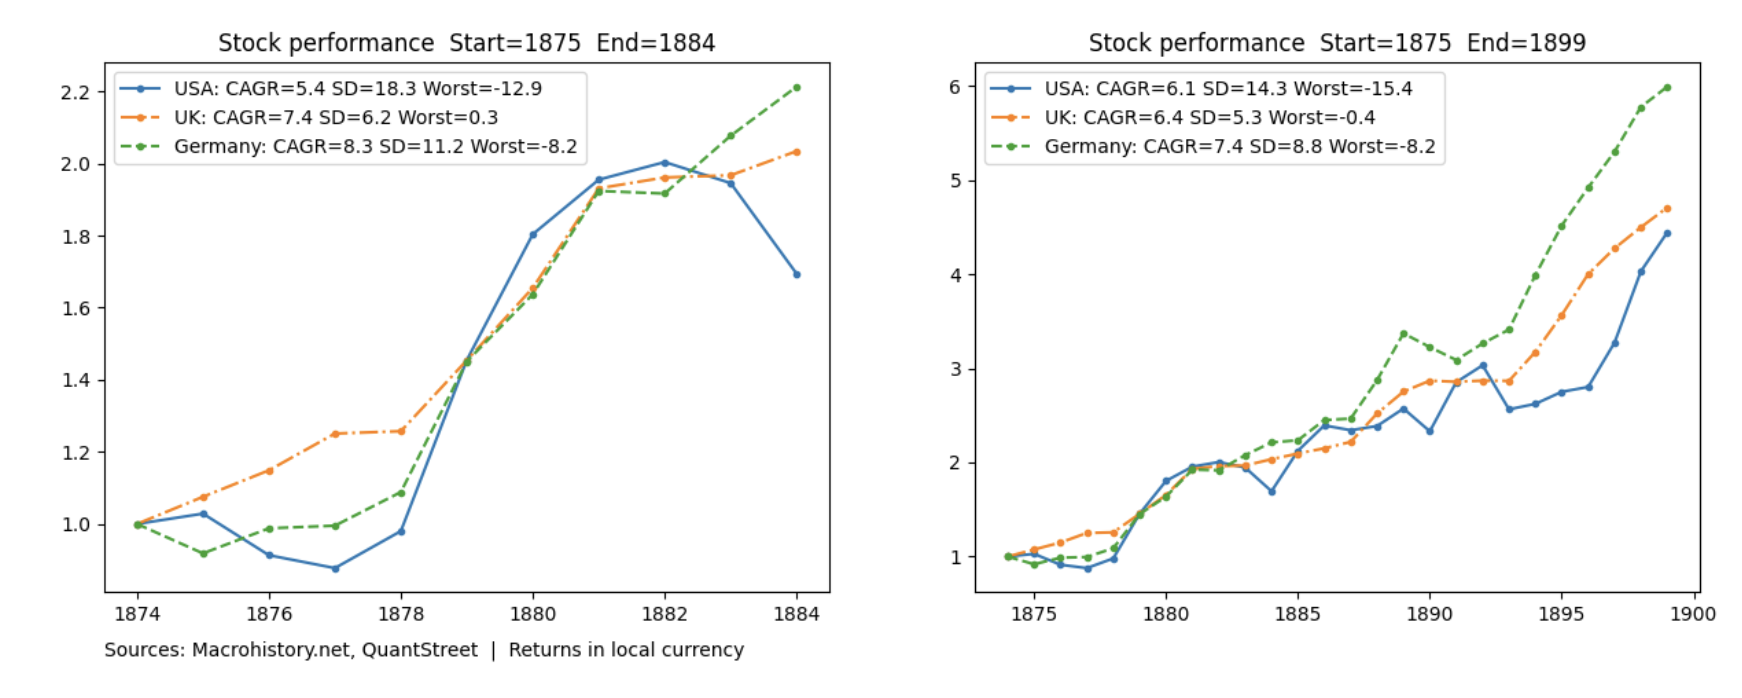
The chart below shows the value of one unit of local currency invested into the U.S., U.K., and German markets starting at the end of 1874. The left graph zooms in on the first ten years of data. The legend shows the compounded annual growth rate (CAGR) of each market, as well as the annual volatility and the worst one-year performance in the sample period.
In the ten years following the beginning of the Age of Steel, Electricity, and Heavy Engineering in 1875, world stock markets were up between 5.4% and 8.3% per year. The worst one-year performance was -12.9% in the U.S. in 1884. The selloff in the U.S. market in 1876 and 1877 represents the tail-end of the Long Depression of 1873-1877, which began in response to over investment in railroads, the focus of the prior technological revolution (1829). The right graph extends the analysis window to 25 years, through 1899. Over this time, the compounded annual growth rate was between 6.1% and 7.4%. The worst one-year return was -15.4% in the U.S. in 1893. Overall, the Age of Steel, Electricity, and Heavy Engineering saw reasonably robust stock market performance for the next 25 years.
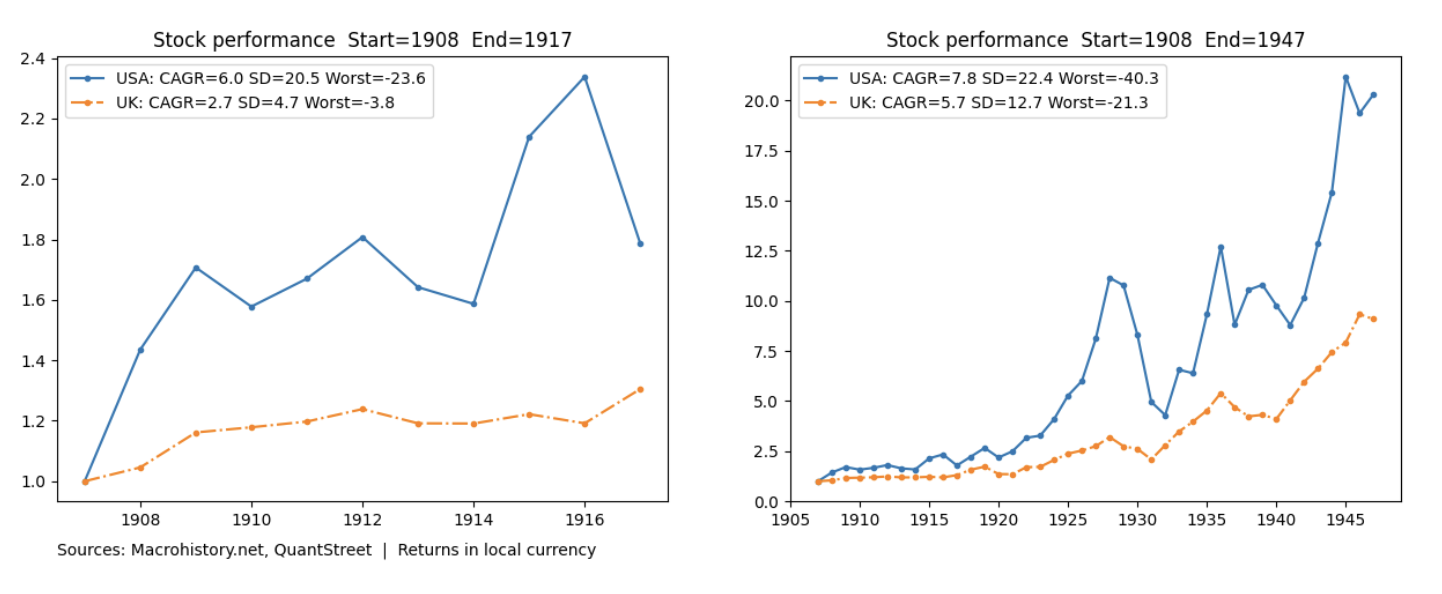
The chart below shows the 10- and 40-year performance after the 1908 start of the Age of Oil, Automobiles, and Mass Production. The left graph shows that in the ten-year period after the end of 1907, the U.S. market was up 6% per year, with a worst one-year return of -23.6% in 1917, ten years after the start of this technological epoch.
The right graph above shows that extending the analysis to the end of World War II captures the market crash that happened during the Great Depression. Over 1930 and 1931, the U.S. market was down 54%. The U.S. market would not sustainably reach a new high until the early 1940s, over ten years after the start of crash. The market crash associated with the Great Depression happened 20 years after the start of the oil and automobile age — even if it was partially caused by technological over investment (which is not the common narrative).
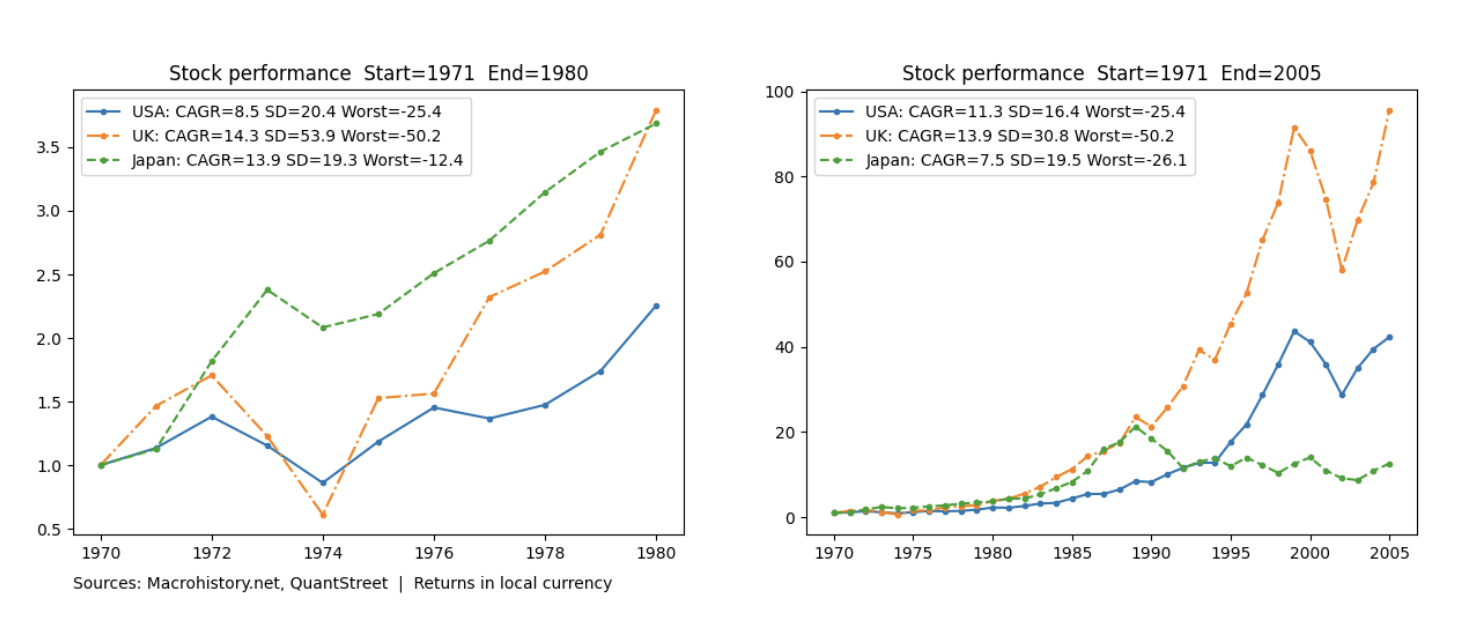
Finally, the start of the information and telecommunications revolution saw strong global market returns from the end of 1970 until 1980, with CAGRs of 8.5% to 14.3% per year, as seen in the left graph below. However, both the U.S. and U.K. markets experienced severe strains in 1973 and 1974, down 38% and 64% respectively, due to the 1973 oil price shock. This shock was caused by conflict in the Middle East and was not directly related to the technological revolution itself.
Expanding the analysis to the 35-year period following 1971 shows annualized returns between 7.5% and 13.9%. There were two more large shocks in this extended time frame. First, the Japanese market was down 46% in between 1990 and 1992, largely due to the bursting of the Japanese asset bubble. Second, the U.S. and U.K. markets would continue to set new highs until the dot-com bubble burst in 2000, falling into a decline until 2002, a period over which the U.S. stock market was down 34% when measured using end-of-year prices. While the dot-com selloff was attributable to overly exuberant tech company valuations, the bubble did not materialize until almost 30 years after this tech epoch began in 1971.
The Age of AI
On November 30, 2022, OpenAI introduced ChatGPT. This arguably began the Age of AI, and set in motion an unprecedented rush to develop the software and hardware infrastructure needed to support the AI revolution.
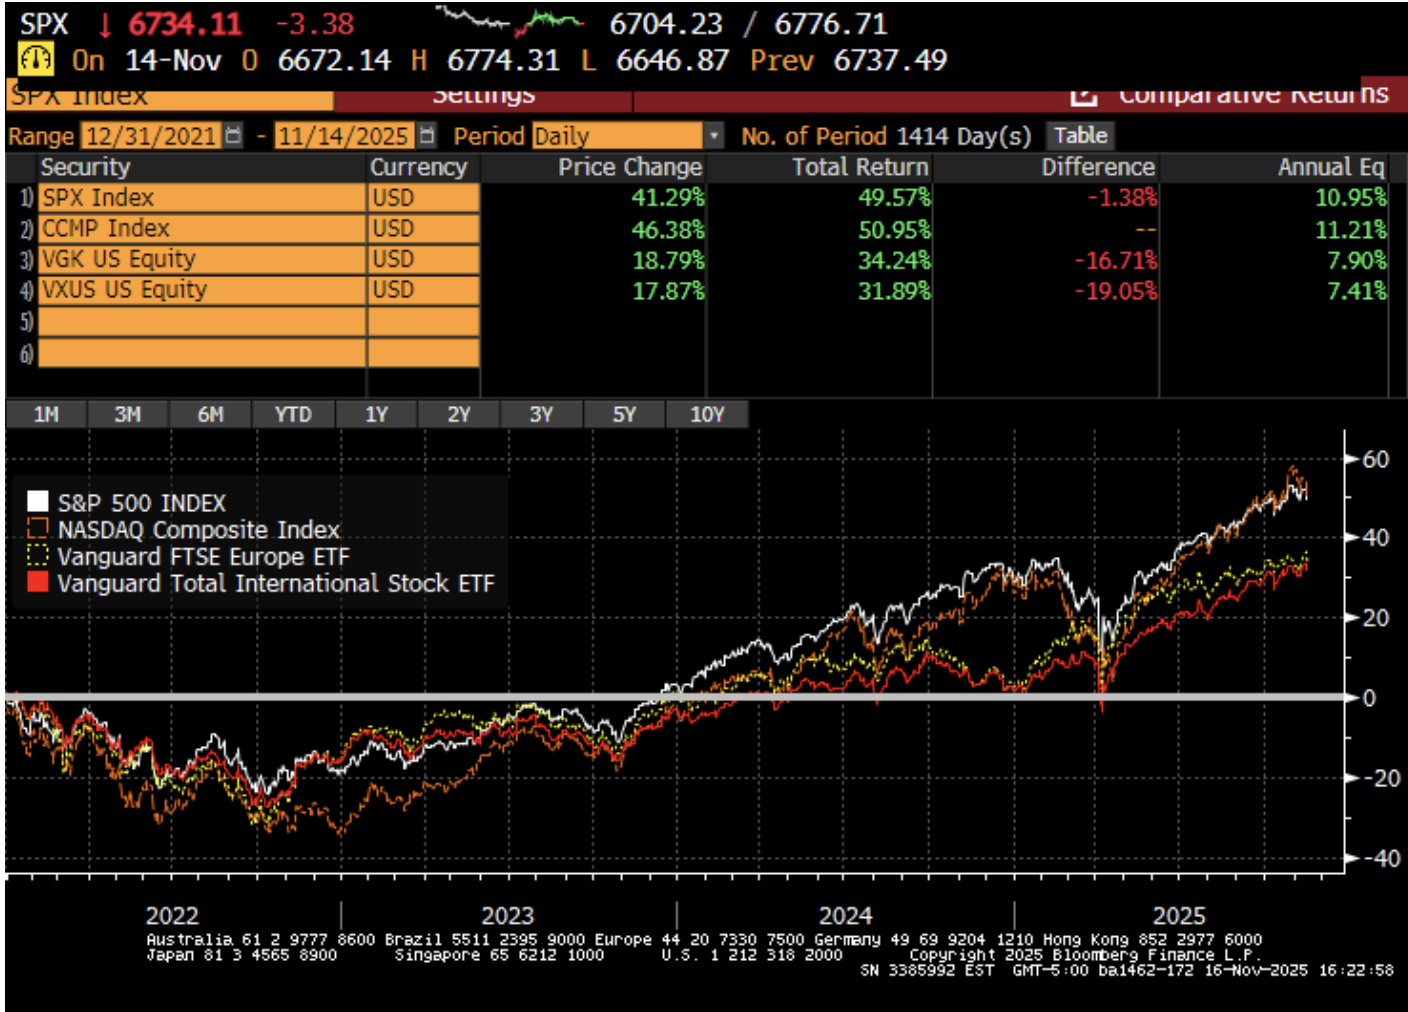
Taking 2022 as the starting point, the annualized rates of return across global markets so far have ranged from 7.4% to 11%. This is higher than the CAGRs in the ten-year windows following 1875 and 1908, but in line with the ten-year window following 1971.
History shows that the starting points of technological revolutions are not invariably followed by the onset of large stock market selloffs, though certainly the latter do occur in the subsequent years and decades. What comes next this time around is a topic for another day, but the historical precedent we obtain from Perez’s book coupled with the macrohistory.net data provides a bit of guidance.
Harry Mamaysky is a professor at Columbia Business School and a partner at QuantStreet Capital.
QuantStreet is a registered investment advisor. It offers wealth planning, separately managed accounts, model portfolios and portfolio analytics, as well as consulting services. The firm’s approach is systematic and data-driven, but also shaped by years of investing experience. To work with or learn more about QuantStreet, contact the firm at [email protected].
A message from Advisor Perspectives and VettaFi: Discover something new! Click here to register for our upcoming webcasts.
Read more articles by Harry Mamaysky
 Advisor Perspectives welcomes guest contributions. The views presented here do not necessarily represent those of Advisor Perspectives.