With a headline like that, I could be talking about my Law School Alma Mater, the University of Michigan, making it back into the Final Four for the first time since 1993 by beating the University of Florida in the NCAA South Regional basketball Finals yesterday. Or it could be the exclamation of most Michiganders with the first sunshine-filled days this weekend since spring had sprung earlier in March (yes, the ice also finished melting on our lake this week…finally).
But no, I’m saving this “finally” for the S&P 500 stock market Index. While other stock indexes like the Dow and the Russell 2000 had already topped their former all-time highs, the S&P 500 had been a singular holdout.
That all changed on Thursday last week, as the oft-cited benchmark measure “finally” topped its closing high of October 9, 2007. It took five and a half years to do so, or 1,985 days, but it did. While it still needs about 0.4% to overtake its intra-day high, the financial world is celebrating the accomplishment reached at Thursday’s close.
But let’s take a moment and, like the partygoer who steps outside onto the balcony and then gazes back in at the festivities, try to view it from a different perspective than simply being in the moment. What are they celebrating?
They’re reveling in the knowledge that an investor who was foolish enough to put all of his assets into a portfolio of all of the stocks in the S&P 500 or who bought the mighty SPY ETF (the world’s largest ETF) has now (drum roll, please) … broken even.
And if we take one more step back from the party (be careful, that’s the balcony’s railing up against your back and we are at lofty heights), and look at a chart of the last thirteen years, we’ve been here before.
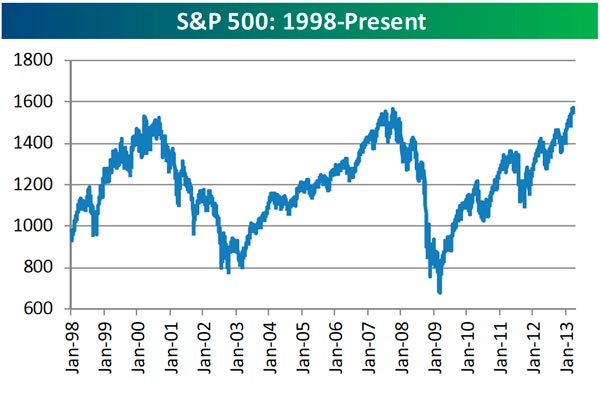
Source: Bespoke Investment Group
The highs in both 2000 and 2007 were followed by 50%-plus collapses. Each time investors were forced to spend over five years retracing their steps to return to breakeven. Both instances required a gain of more than 100% to accomplish the task.
Of course, in my eyes, this record should cause investors, first and foremost, to question the S&P’s use as a benchmark for anyone’s portfolio. Should anyone invest in a portfolio that loses more than 50% twice in a decade? If not, why would you use the S&P 500 as a gauge of your investment performance? Only if you want a portfolio that has such significant downside risk should you use that measure as a scale of performance.
Another reason not to use the S&P as a portfolio benchmark is that it is a portfolio that I believe most investors cannot live with in any event. Very few investors that I have met over the years have been able to buy and hold a portfolio of stocks that is falling 20 or 30 percent … even when it is just a part of one’s portfolio and certainly not when it is all of it! And a loss of more than 50%…?
Still, the S&P 500 is regularly cited when performance is compared. Why? Like the Dow, it is a recognizable name. Second, it is crafted by an independent agency. And third, people have so many diverse investment profiles that it is hard, and the financial media is too lazy, to customize an index for everyone.
Enter Flexible Plan Investments, Ltd., where we create a personal benchmark for each of our clients. Our OnTarget Investing process uses each client’s answers to our suitability questionnaire and the research results for the exact portfolio of strategies held by them to create a personal benchmark against which to track their portfolio performance. It’s sent to every client each quarter in our quarterly investment report.
Speaking of the suitability questionnaire, it reminds me of another reason why the S&P 500 is so inappropriate as a comparative measure of a client’s investment performance. If you were to go to your trusty Thesaurus and look up “suitability,” you’d see words like aptness, fitness, correctness, rightness, and appropriateness.
What do these terms mean? They all relate to one’s ability to stick with the original course of action and to live with its consequences. In investing, what is suitable is often interpreted as being “invested in a portfolio that lets you sleep at night.” Given the record outlined above, is the S&P 500 such a portfolio?
At the same time, it is a maxim of investing that “return earned is often a function of risk taken.” While I would quarrel a bit with this conventional wisdom, it is true that for most investments, with higher returns comes higher risk.
For that reason, is it logical to compare the returns of a less risky investment to a more risky investment? As we have seen, the S&P 500 is a very risky investment. Does it make sense to compare returns from portfolios termed “conservative,” “moderate,” “balanced,” or even “growth,” where risk is desired to be less than an aggressive index like the S&P, to such a measure’s returns? Not in the real world!
So this week we will celebrate the return to breakeven of a venerable index. Since 1929, it has provided a gauge of what stocks have been doing in the financial environment that surrounds us relative to other investment alternatives. But we won’t jump on the bandwagon and join the herd in relating it to what we are doing in our own or our clients’ portfolios. For them, the index is irrelevant and inappropriate. It is not suitable.
After reviewing the rest of today’s hotline (check out Strategic Solutions, for example, where we provide an overview of our over 100 strategies and profiles available on our Strategic Solutions program at Trust Company of America), I think you’ll find that our performance in March compares very well, whatever the standard. March was a very positive month in a very positive quarter.
I was especially happy with the March returns for MAPS and SAS. You’ll recall that the allocation process was updated in February by David Varadi and Jason Teed in our Research department. March was the first full month under the new approach. Next week, we will implement the last third of the “time diversification” addition to the process as well.
What does a positive quarter suggest for the future? I checked the archives and it appears that a positive quarter has a higher tendency to be followed by good returns in the future than a negative one. And quarters where the performance topped 10%, as was the case this year, have tended to lead to higher-than-average returns for at least a year into the future.
|
Post quarter returns since 1987 |
|||
|
3 month % change |
6 month % change |
1 year % change |
|
|
Losing quarters |
1.64% |
3.51% |
6.83% |
|
Winning quarters |
2.20% |
4.46% |
9.48% |
|
Better than 10% quarters |
4.39% |
6.65% |
11.59% |
|
Worse than -10% quarters |
4.73% |
9.64% |
13.14% |
|
All quarters |
2.01% |
4.33% |
8.73% |
Data from www.standardandpoors.com
Interestingly, and this is why I still count myself as a contrarian, the best quarters for future performance are quarters where returns fall more than 10%! Still 10%-plus quarters have ushered in quarters with a gain more than 65% of the time and 12-month total returns following such performance have been positive over 93% of the time since 1987.
As always, there are a few party-poopers at the festivities. With new highs comes the reminder that the markets at these heights are by definition overbought, and while investors seem not to have been caught up in the parade as yet (on a contrary note – a good sign), corrections can begin at any time – even at new highs.
In addition, as we pointed out last week, analysts continue to downgrade next quarter’s earnings. Furthermore, economic reports, which have been outperforming their predictions and fueling much of this quarter’s advance, have suddenly started to weaken (see chart below – 11 out of 15 were weaker than expected this week alone). And do I need to even mention Europe?
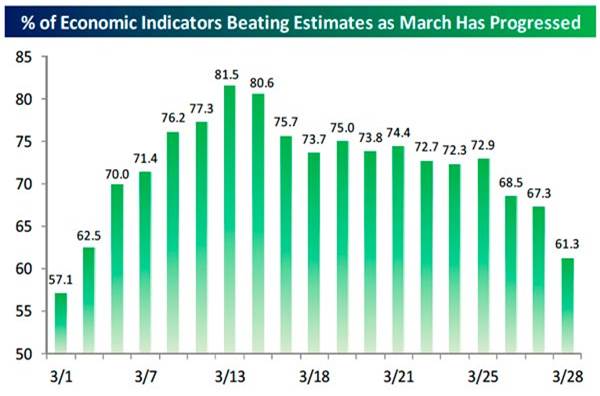
Source: Bespoke Investment Group
Finally … today is April 1st, April Fool’s Day! I think you’ll enjoy this report summarizing some of this year’s best pranks.
All the best,
Jerry
© Flexible Plan Investments