2013 was tough for risk parity. Many of the most popular funds such as Bridgewater, Salient and AQR were flat or down even as investors in the S&P 500 enjoyed a return of almost 30%.
What happened?
It might be helpful to look at interest rates, which have been trending downward since 1982.
Here’s a graph of the 10-Year Treasury Constant Maturity Rate:
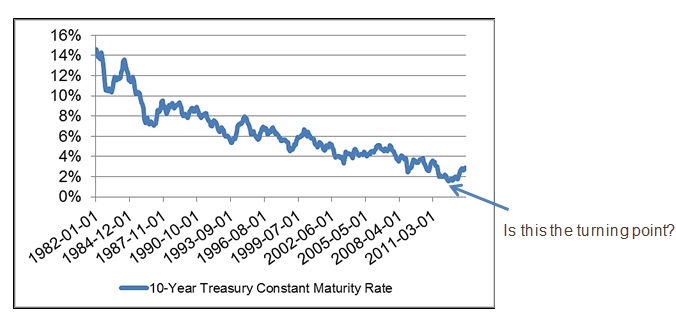
Source: Federal Reserve Bank of St. Louis
As interest rates have gone down, Treasury bond prices, of course, have gone up, and it is plausible that interest rates were a factor in the strong performance of risk parity through the end of 2012. But in 2013, the trend showed signs of reversing, and that might have affected risk parity funds in two ways. First, higher rates mean lower bond prices. Second, higher rates mean higher financing costs. Since a levered bond portfolio is a key component of many risk parity funds, we might expect changes in rates and fund returns to move in opposite directions.
We saw this in 2013 for AQR’s fund:
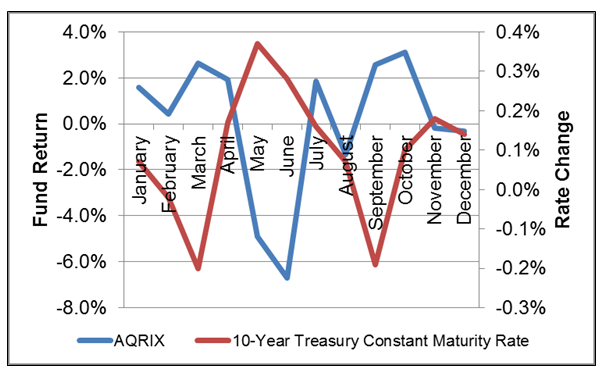
Sources: Federal Reserve Bank of St. Louis and Morningstar
and Salient’s:
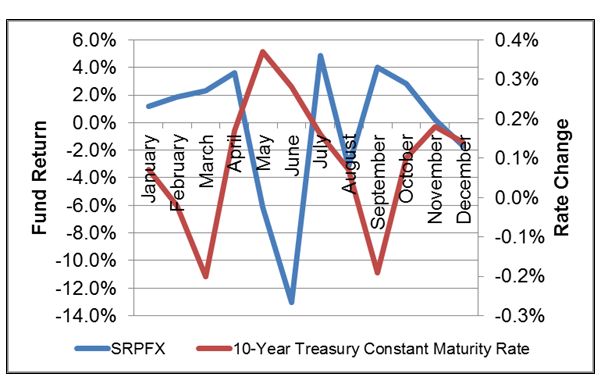
Sources: Federal Reserve Bank of St. Louis and Morningstar
Does 2013 mark the end of a phenomenal 30-year bond rally? Who knows? But a negative relationship between changes in interest rates and a strategy that levers a bond-heavy portfolio is not hard to understand.
Would you like to read more about this subject?
1) Will My Risk Parity Outperform?
http://www.cfapubs.org/doi/abs/10.2469/faj.v68.n6.7
2) The Decision to Lever
http://papers.ssrn.com/sol3/papers.cfm?abstract_id=2292557
3) The Dynamics of Rising Interest Rates
http://riskcenter.berkeley.edu/documents/ThomsonReutersDynamicsofRiskingInterestRatesArticleOnly.pdf
Disclosure: For comparison, we include below a chart showing 2013 returns to the Morningstar Tactical Allocation Funds, which includes AQRIX and SRPFX, and changes in the 10-Year Treasury Constant Maturity Rate.
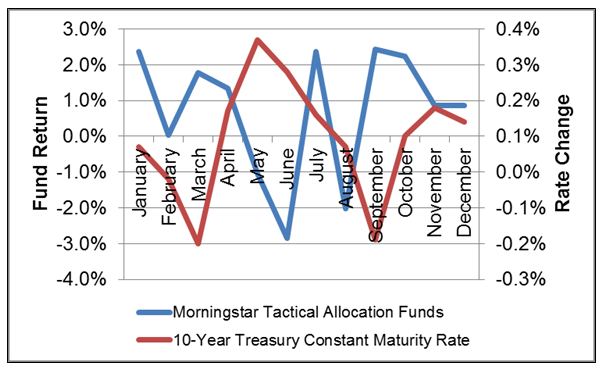
Sources: Federal Reserve Bank of St. Louis and Morningstar
The performance shown above is past performance and is not an indication of future returns. Current performance for the AQR and Salient risk parity funds and the Morningstar Tactical Allocation Funds may be lower or higher than the performance data quoted above. Performance shown above is based on the total returns of the mutual funds in the category and includes the reinvestment of dividends and capital gains. Investment returns and principal will fluctuate with market and economic conditions and investors may have a gain or loss upon redemption.
Information provided herein reflects Aperio’s views as of the date of this piece. Such views are subject to change at any point without notice. Aperio obtained certain information provided herein from third party sources believed to be reliable but it is not guaranteed. Information contained herein is for informational purposes only and should not be considered investment advice or a recommendation to buy or sell any types of securities.
Ten Year Treasury Constant Maturity - An index published by the Federal Reserve Board based on the average yield of a range of Treasury securities, all adjusted to the equivalent of a 10-year maturity. Yields on Treasury securities at constant maturity are determined by the U.S. Treasury from the daily yield curve. That is based on the closing market-bid yields on actively traded Treasury securities in the over-the-counter market.
The S&P 500 Index is a market value weighted index consisting of 500 stocks chosen for market size, liquidity, and industry grouping, and is meant to reflect the risk/return characteristics of the large cap universe.
These indexes are not available for direct investment.