Five years and counting
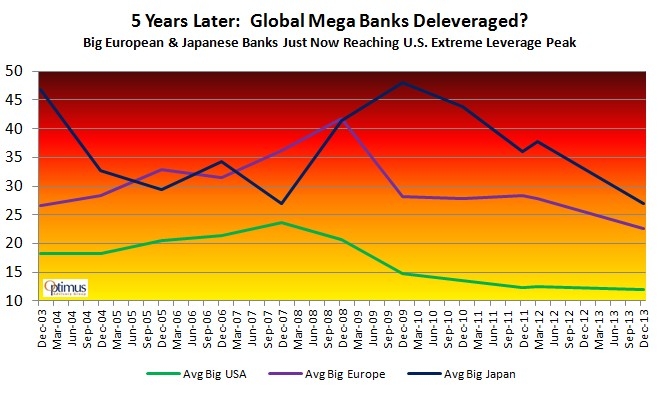
Fortunately, for those of us in the U.S., things look better on a relative scale. While our own mega banks were highly leveraged (24:1) pre-crisis, we've made great strides (thank you taxpayers!) in dropping that level back down to earth.
There is a different story, however, on the other side of the world. European mega banks' financial leverage peaked at 42:1, while Japanese banks peaked at 48:1. They weren't using punch bowls back then; they were filling up the swimming pools! Shockingly, five years removed, European banks are just now hitting U.S. peak leverage levels, while Japanese banks still have a little ways to go. To put it another way, Europe has just now reached our dangerously high levels of leverage from 2007 and Japan is still in the "extremely dangerous" level we never actually reached.
International Mega Bank Hit Parade
Examples of the "swimming pool" sized punch bowls overseas are not hard to come by. In 2008, Deutsche Bank AG in Germany had leverage of 72:1! Five years later, they have brought it down to only 32:1.
European Bank Credit Agricole's current financial leverage is 24:1 and they are rated "F" by Morningstar for financial health, which is a rarity. Current financial leverage is 24:1.
Japan's Mizuho Financial's leverage hit 66:1 in 2008-2009 and is now only 32:1.
Along with Japan's Mizuho Financial, Europe's Barclays Bank is the only other bank on our Global Mega Banks Watchlist that has the dubious distinction of running greater than 50:1 financial leverage four years in a row! No wonder they backed out of any Lehman deal in 2008.
There Will Be A Test
Our fragile financial system may be going through another real-life stress test soon. Who can say what the so-called "trigger" will be: China credit crisis/hard landing/property market collapse? Emerging markets currency crisis? The Russian/Ukraine crisis?
At this juncture, allocating assets toward tactical equity & bond strategies that can move to safety makes sense, especially since we are so long overdue for a double-digit correction in the equity markets.
Disclosures
The performance results shown include the reinvestment of dividends and other earnings. Comparison of the Optimus Advisory Group Programs to any other indices is for illustrative purposes only and the volatility of the indices used for comparison may be materially different from the volatility of the Optimus Advisory Group Programs due to varying degrees of diversification and/or other factors. Different types of investments involve varying degrees of risk and there can be no assurance that any specific investment will be profitable. Optimus Advisory Group does not make any representation that the Optimus Advisory Group Programs will or are likely to achieve returns similar to those shown in the performance results in this presentation. Optimus Advisory Group reserves the right to trade different funds within their models.
The historical S&P performance results (and those of all other indices and index funds used as proxies for indices) are provided exclusively for comparison purposes only, so as to provide general comparative information to assist an individual client or prospective client in determining whether the performance of the Optimus' portfolio meets, or continues to meet, his/her investment objective(s). It should not be assumed that any Optimus portfolio holdings will correspond directly to any such comparative index.
Different types of investments and/or investment strategies involve varying levels of risk, and there can be no assurance that any specific investment or investment strategy (including the investment strategies devised or undertaken by Optimus Advisory Group) will be profitable for a client's or prospective client's portfolio. All performance results have been compiled solely by Optimus Advisory Group and have not been independently verified.
The Optimus performance results do not reflect the impact of taxes.