This morning, as I was driving in to work, I heard that we are going to break the second longest streak of 80+ degree days today, as the high temperature is expected to be 79 degrees. How long was this streak? 17 days. For many of you reading this in places south and southwest, I am sure you can’t fathom such a short period of warm weather, here in Wisconsin this portends the end of summer.
As we enter the lazy days of August, historically one of the worst months for stock market performance, we are likely to experience more of what we saw last week. We had increased market volatility, gyrating interest rates on every piece of economic data and low volume. However, August tends to be a month without much conviction as the number of investors in the market wanes due to summer vacations.
Looking at the Numbers
Last week was packed with economic data including the first look at 2nd quarter GDP, Consumer Confidence and the Employment Cost Index. We also had an update from the Federal Reserve regarding their interest rate decision.
Second quarter Gross Domestic Product (a measure of real growth in the U.S.) was reported up 2.3% and the first quarter was revised up to 0.6%. The revision to the first quarter is positive because originally it was reported as declining. Still, the first half of the year looks like another modest grower. While the first look at the second quarter is subject to change (we’ll get that on August 27th), there are some interesting tidbits in the report.
The increase was due in part to “an acceleration” in PCE [personal consumption expenditures], a deceleration in imports, and an upturn in state and local government spending…according to the Bureau of Economic Analysis. They noted that disposable personal income was up $145 billion in the second quarter, a 22% increase over the first quarter. They said that one of the reasons for the increase was an upturn in “personal interest income.” So, while the Fed hasn’t moved, the fact that markets have already anticipated the move is providing some benefit to those with savings investments.
Consumer Confidence took a hit when it was reported last week that the Conference Board’s Index measure was at 90.9 down from 99.8 and well below the expectation of 98.0. The bulk of the decline came from the Expectations Index which declined from 92.8 to 79.9. Some of this decline is likely due to headlines surrounding market volatility, the Greek debt crisis and the Chinese stock market sell-off, all of which dominated headlines in July. We will have to keep an eye on this measure as it has a high correlation with consumer spending over time.
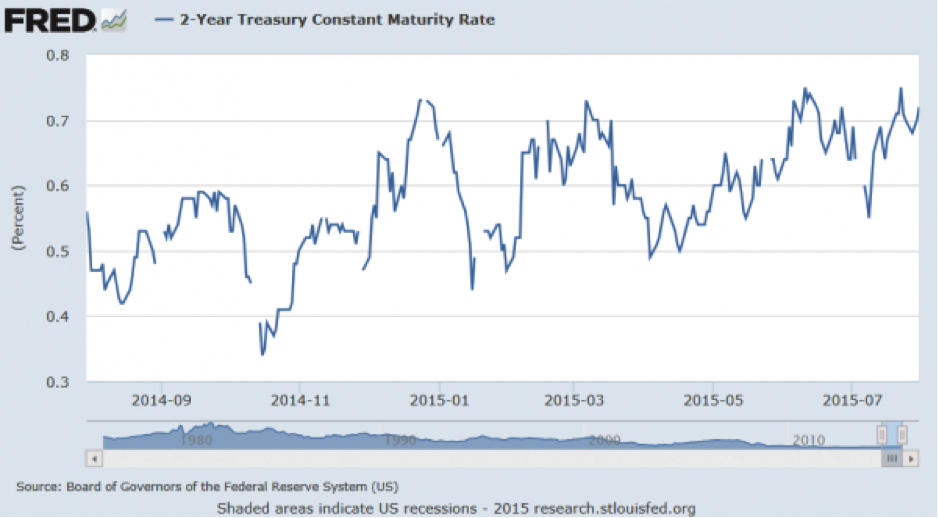
Markets put a lot of weight on the ECI (Employment Cost Index) last week because anything having to do with the labor market and inflation will be over-analyzed. Because the Fed Chairwoman, Janet Yellen, has indicated that their next move with short-term interest rates is “data dependent”, any of the data she watches will be scrutinized. The index came in at the lowest level since 1982 and as a result, yields on Treasuries fell. In particular, short Treasuries such as the two-year fell as investors believed the data may suggest a longer wait by the Fed.
However, as you can see from the chart below, the market has been raising two-year Treasury yields since 2014 in anticipation of the Fed’s first move. The yield has gone from a low of 0.30% to approximately 0.70%. This rate does a good job of forecasting where the Funds rate may go so it bears watching.
Haves and Have Nots
We continue to see a divergence in the stock market between those companies whose stock prices move higher and those that are punished for missing earnings estimates and because they rely more heavily on exports or overseas sales for earnings. The strength of the dollar has been highlighted as one of the main reasons many of these companies have underperformed the broader market. In addition, those companies having anything to do with the production, distribution or servicing of commodity related sectors of the economy have also been sold off.
Commodity prices for things like energy, agriculture, and metals have really been hit hard this year. The Dow Jones UBS Commodity Index is down -12.03% this year, with components like oil (-18.54%), copper (-16.51%) and corn (-9.44%) leading the way down.
Large cap growth stocks are up 7.12% since the beginning of the year while large cap value stocks are up only 1.00%. Small cap growth stocks have returned 8.80% on average while small cap value stocks are down -3.05%.
There is something interesting about the fact that growth stocks continue to outperform their value brethren. The market, while not up a lot, is still in positive territory year-to-date, despite the challenges of weak economic data, a stronger dollar and volatile markets in Europe and China. This provides some insight into how investors view the future earnings of U.S. companies positively, although more selectively, than two years ago.
August is generally a low volume, volatile and not usually positive performance month. So, enjoy the dog days and look forward to an interesting fall market environment.


