A couple of months ago I wrote an article about how risk, like death and taxes, is always with us. That was written as the market made new all-time highs, and I wanted to make it clear that such highs did not mean that risk was absent. Risk is always with us—like the air we breathe.
After a week like the last one, where we went from the greatest level of an oversold S&P 500 Index since the beginning days of WW II, to a two-day rally that exceeded 99.6% of all of the two-day rallies in the almost 90-year history of the Index, it is now apparent that the earlier article had it right.
Some would say that with the volatility subsiding that the risk, too, has subsided. After all, prices are at lower levels, so doesn’t that mean that value abounds? The answer in a word is “no.” As we said: Risk is always with us—like the air we breathe.
The life-sustaining property of air is, of course, oxygen. Air contains about 21% oxygen.
The funny thing about this is that if one decreases the amount of oxygen a person is receiving one can die. Yet if one increases the amount of oxygen to levels that are too high for too long, one can also die. Both extremes can bring about dire consequences.
In the financial markets, we find a similar relationship. If we are at high levels of risk for too long, we can go broke. If we are in a prolonged period of low volatility, eventually it spikes and that usually means lower prices as well.
The latter is the condition we found ourselves in entering the week before last. I even posted a graph that Monday showing how prices had been locked in a narrow bandwidth, traveling a virtual straight line for most of 2015. What a difference ten trading days makes!
Image posted on 8/17/15
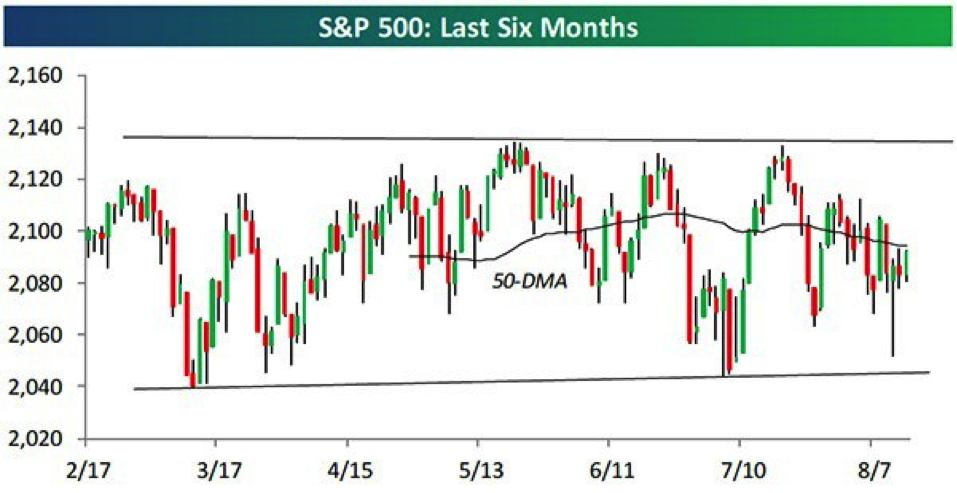
Source: Bespoke Investment Group
S&P 500 Two weeks later
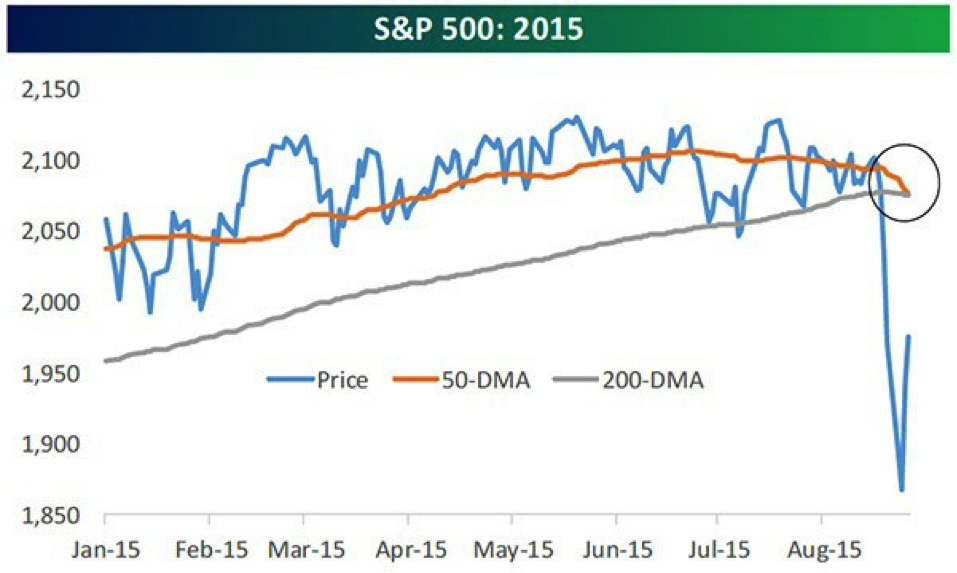
Source: Bespoke Investment Group
After the carnage of 8/16 and 8/17, I stated last Monday that I expected a bounce to commence soon. And it did, taking last week, incredibly, into positive territory, despite Monday’s losses.
But because of the way the mathematics of declines work, at Friday’s close we are still down 6.7% from last May’s high point. While I expect last week’s rally to carry prices still higher in the very short run (maybe a week or so), I am not expecting prices to recover new high ground until after we re-test the latest lows. Remember, I also said last week that we might obtain last October’s lows before this is over. That could take the S&P 500 down another 8% from today’s likely close.
Why do I believe there is more negative action to come? The reason is because so many of our active strategies have moved to defensive positions. Some hold larger-than-normal percentages of cash, bonds, or gold, others have moved completely to cash, while a few are actually holding inverse funds for the first time in years. (Inverse funds make money when the index they are tracking falls in price, as is happening today to most indexes as I write this.)
In addition, last week a few of the longer-term indicators I follow joined their short-term compatriots in moving into bearish territory. The so-called “Death Cross” of the 50-day moving average of the S&P crossing over a declining 200- day average usually (80% of the time) has led to lower prices over the next month. And the Bull/Bear Market Indicator is telling a similar story:
Bull/Bear Market Indicator
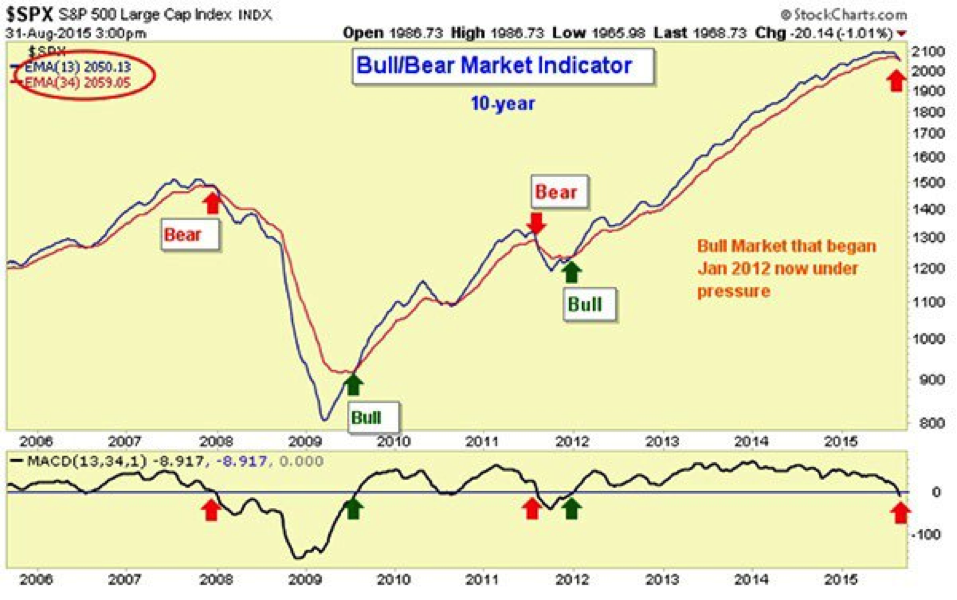
Source: StockCharts.com
Still, I believe, it is quite likely that we have not seen the highs yet for 2015. A fourth-quarter rally seems likely, not just because it happens almost every year, but also because the conditions for a crash just don’t exist and the extent of the current tumble is historically overblown.
As the next chart illustrates, the S&P 500 rarely slides into a bear market when no economic recession is on the horizon. At the present, it is hard to find any reputable economist pointing to a solid case for a recession in the near future here in the US.
Still, there have been three occasions since 1928 when prices have fallen into a bear market without a recession.
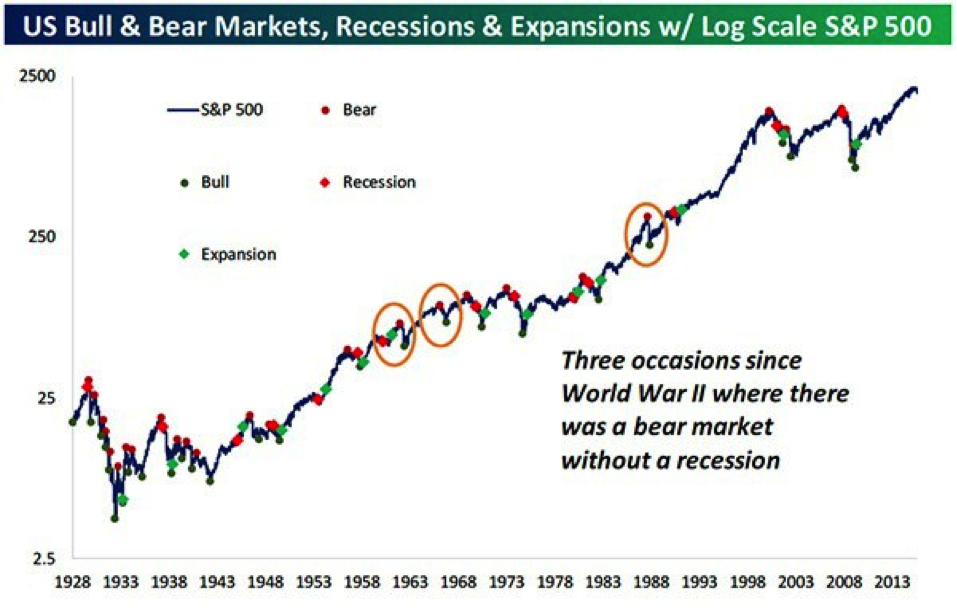
Source: Bespoke Investment Group
After each of these short non-recessionary bear markets, the index moved fairly quickly to higher ground.
Of course, this chart also demonstrates what I said last week: You have to put the current downturn into perspective. I know the point swings (1,000 points on last Monday morning alone) are scary, but as in most things, it’s the percentage swing that matters the most.
So far the percentage swing has been well within the percentage decline associated with corrections, not bear markets. Before the present decline we had not had a correction for four years. All year I have been reminding one and all that we were overdue and that this year was going to be a correction year.
The correction was expected, it was only the exact timing that was unknown.
If it was expected, why didn’t we exit stocks and move to cash at the beginning of the year?
To answer that, we have to return to the discussion of risk. We saw with oxygen that it had two opposite effects at different levels of exposure. Around 21% it was life sustaining, significantly above or below that level it can be life threatening. Risk is similar, but in a different way than I have already discussed.
The primary risk measurement utilized by Wall Street is a statistic called standard deviation. High standard deviation means that risk has increased. Low standard deviation indicates a lower level of risk.
That seems straight forward, until you realize that high standard deviation can mean that prices are moving quickly lower OR quickly higher. That’s right, high risk as measured by Wall Street can mean you are taking a lot of losses or making a lot of profits.
Just as when you stay in the market you always have the chance of losing money, when you are out of the market you have a chance of losing the opportunity to make money and stay ahead of money market rates and inflation. Both of these risks are, like the air we breathe, always with us.
So what’s an investor to do? Over 40 years ago I solved this dilemma. I began using dynamic, risk managed, active investing methodologies to gain my exposure to the various financial markets – stocks, bonds, gold, and other alternatives – rather than following a buy-and-hold approach to any market.
I’ve been happy with the results, and I hope most of our clients are as well. Check out the returns last week of two of our most active strategies, FUSION and S&P Trading Patterns. They are designed for this kind of market. The former seeks to create a portfolio allocated among indexes and active strategies to robustly contend with any market regime. The latter was created to take advantage of sideways and falling markets.
And, we have a whole new category of strategies that are designed to perform well in bull, bear, and sideways markets. We call the category ALL TERRAIN and the strategies are All Weather Static, All Weather Dynamic (leveraged and unleveraged), Trivantage (leveraged and unleveraged), and Smarter Beta. All of these are available now upon request for ETFs and mutual funds (Smarter Beta is reserved for ETFs only, however). Watch for our formal rollout, coming soon.
Why did we choose to bring out a whole new category of strategies? The reason was to have a different class of strategies that seek in different ways to gain ground, not simply tread water, regardless of the type of market we are in at any given time. They seek to outperform in down markets and hold their own in bull and sideways markets. Looking at the last two weeks’ preliminary numbers, they seem to be accomplishing that goal.
Why do we need access to All Terrain strategies? Because risk is always with us – just like the air we breathe. It is balancing the risk of loss and the risk of lost opportunity that must always guide today’s investors.
All the best, Jerry
PS—Have a safe and happy Labor Day Weekend!
http://www.flexibleplan.com/market-hotline/disclosures
Jerry C. Wagner, JD | President of Flexible Plan Investments, LTD | [email protected]
Jerry C. Wagner has been President and sole shareholder of Flexible Plan Investments, Ltd. since its formation in 1981. He has been active in market analysis, designing methodologies and management of personal investment portfolios since 1969.
© Flexible Plan Investments, LTD