As August wound down and families enjoyed the last few lazy days of summer, financial markets clearly had another idea in mind. After trading in a relatively tight range for most of the summer, the last two weeks of August were marked by volatility, the likes of which haven’t been seen since 2011. We attribute this heightened volatility to the confluence of global macro conditions with technical factors.
Market in Review
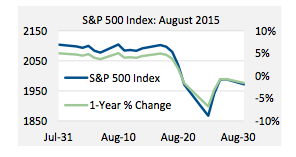
After trading in a range of less than 100 points for the entire summer, on August 18 the S&P 500 broke out to the downside, falling 235 points in six days before finishing the month down 132 points. August’s decline is the first greater than 5% in more than three years and has pushed its one year return into negative territory:
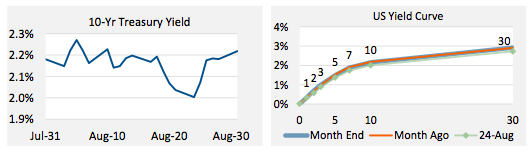
After rising to 2.45% in July, the yield on the 10-year Treasury spent most of August between 2% and 2.25%. In spite of all the market volatility, it only briefly dipped to 1.90% intraday on August 24, but never closed below 2%:
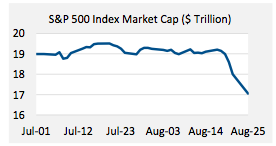
Volatility in Focus: Tuesday, August 25 marked the sixth consecutive daily drop in S&P 500 Index. The cumulative drawdown of 11.2% marked its largest six-day decline since August of 2011, erasing more than $2 trillion of market capitalization:
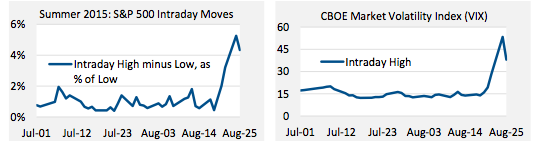
Volatility also picked up sharply. After averaging 0.93% during July and the first two weeks of August, the intraday range on the S&P 500 quickly climbed to more than 5%, while the VIX increased more than 3x:
The selloff was not limited to only equities or the US; most markets and asset classes around the globe were affected.
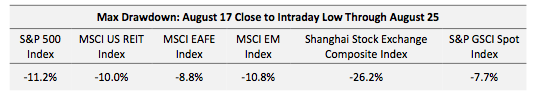
The broad nature of the selloff provided a reminder that while diversification is an important part of managing portfolio risk, it is insufficient on its own to protect against systematic risk, when markets sell off broadly and correlations tend to increase.
What Drove the Sell Off?
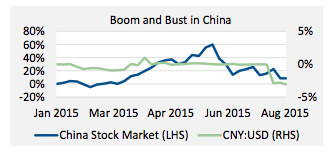
From a fundamental perspective, global macroeconomic factors were, and arguably still are, cause for investor concern. There is perhaps no bigger question surrounding the global economy than China. In recent years, China has accounted for upwards of 50% of the world’s GDP growth, but in 2015 its economy has experienced growing pains.
The yuan’s gradual unpegging from the dollar and its steady increase in value has hurt China’s export market, leading China to sharply devalue the yuan in early August. After rising sharply in the first half of 2015, China’s stock market is down more than 40% this summer, in spite of government intervention to support it:
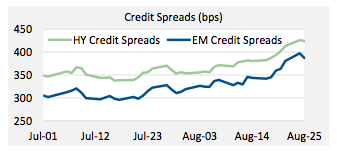
These conditions in China are generating a spillover effect into other regions of the world. The reduction in demand for China’s exports means China is demanding smaller amounts of commodities for the production of those exports. Commodity prices have been down as much as 25% in 2015 and more than 40% from a year ago. These lower prices are negatively affecting emerging market economies that are particularly reliant on revenues from commodity exports.
In addition to being the world’s largest exporter, China is also one of the world’s largest consumers of luxury goods. The decline in both China’s stock market and the value of the yuan are contributing to a reduction in demand for imported luxury goods, particularly from Europe, where economic growth has already been anemic for years.
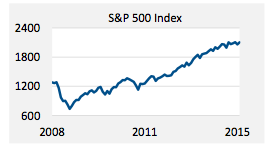
In the US, the stock market has been on a largely uninterrupted bull run since March 2009:
Earnings growth along the way has supported higher stock prices, but earnings multiples have also increased. Since hitting an all-time high in September 2014, corporate earnings have leveled off. The market, however, has continued to climb, pushing P/E ratios higher:
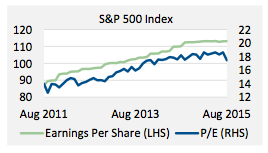
While the current PE levels generally couldn’t be classified as being outside historical ranges, the absence of any meaningful earnings growth over the past year is yet another factor weighing on US markets.
Finally, the world’s central banks have spent years testing the bounds of monetary policy’s ability to stimulate economic activity and are already looking toward normalization:
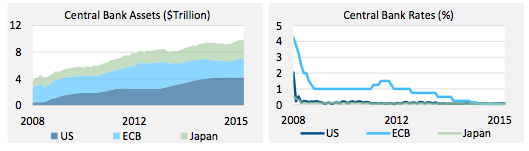
Given the limited number of remaining policy options, investors are understandably skeptical about prospects for future growth and the efficacy of additional stimulus measures.
Yet, while these conditions pose real challenges and risks to investors, they aren’t new developments either. Rather, they have been on investors’ radar for some time now. As such, the fundamentals in this instance are an important part of the story in explaining the sharp nature of the selloff, but not the only reason for the sudden increase in volatility.
Risks naturally abound in financial markets and on any given day, there are plenty of potential reasons to sell. Nevertheless, it is rare when so many investors are all looking to get out with so few looking to get in. In an effort to shed some light on the technical nature and makeup of August’s volatility, here’s a breakdown of where some of the selling pressure came from.
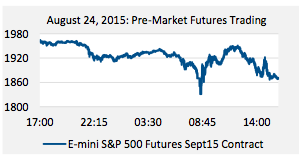
With a market capitalization of nearly $20 trillion, comprised primarily of the largest, most liquid stocks in the US, the S&P 500 is arguably the world’s most widely recognized benchmark. Over the course of the week, selling pressure erased approximately $2 trillion of its market cap. August 24th was the biggest down day of the week and also had the largest intra-day decline. Prior to the open, the futures market had already set the tone for the day, having traded down significantly:
Lipper data show that equity mutual funds in the US experienced net outflows of nearly $18 billion during the week ended August 26th. By way of context, the previous four weeks saw an average outflow of just $1.2 billion. Much of that $18 billion outflow was from exchange-traded funds (ETFs), with the SPDR S&P 500 ETF (SPY) alone shedding $6 billion.
Some ETFs also experienced significant mispricing, potentially associated with exchange-related circuit breakers. For example, one of the large low-volatility ETFs traded down more than 40%, while its intra-day NAV was down less than 7%. Situations like these contributed to investor confusion and angst.
In addition to selling their mutual funds and ETFs, many investors are also reported to have had stop-loss orders in place that were triggered at the market open, generating additional sell pressure.
In addition to increased sales by investors of individual securities, mutual funds, and ETFs, the sharp market decline and increased volatility also resulted in sales activity by other investor segments such as Commodity Trading Advisors (CTAs), Risk Parity strategies and Volatility Control funds. As a leading provider of risk management services and managed risk equity funds (volatility target + capital protection), Milliman is able to offer a valuable perspective, particularly during times of heightened volatility.
Many volatility control strategies had the benefit of holding fixed-income securities when the sell-off began. We estimate an average fixed-income exposure of approximately 40% across all volatility control funds in the market at the start of the selloff. The simultaneous flight to quality during the equity market sell-off helped to stabilize these portfolios, as the higher-quality bond positions increased in value. These hedges notwithstanding, the exceptionally high level of volatility required further reduction in equity exposure. We estimate the funds in this space, across all target levels, reduced their equity exposure from an average of about 60% to approximately 30%.
During this period, futures markets functioned as they were designed to, including brief and orderly market stoppages on Monday, August 24, consistent with well-established exchange-based policies and circuit breakers. Our trading team operates out of locations around the globe, with the ability to trade around the clock. Though markets have been volatile, volume across all exchanges has been more than adequate to execute all required trades in an orderly manner.
Against the backdrop of ongoing macro risk and uncertainty, we believe risk management remains a critical component of any investment plan. By seeking both to control volatility and minimize exposure to sustained drawdowns, we believe managed risk equity strategies offer a compelling solution to help investors meet their risk and return objectives through all market environments.
To receive Millman’s commentary, email [email protected] with the word “commentary” in the subject line.
Unless otherwise noted, all data is sourced from Bloomberg, LP.
Disclaimer: Milliman Financial Risk Management LLC does not make any representations that products or services described or referenced herein are suitable or appropriate for the recipient. Many of the products and services described or referenced herein involve significant risks, and the recipient should not make any decision or enter into any transaction unless the recipient has fully understood all such risks and has independently determined that such decisions or transactions are appropriate for the recipient. Any discussion of risks contained herein with respect to any product or service should not be considered to be a disclosure of all risks or a complete discussion of the risks involved. The recipient should not construe any of the material contained herein as investment, hedging, trading, legal, regulatory, tax, accounting or other advice. The recipient should not act on any information in this document without consulting its investment, hedging, trading, legal, regulatory, tax, accounting or other advisors.