The low-to-negative yield environment has been a growing challenge for European insurance companies. With German Bund yields near historical lows and other European high quality bonds offering only tight spreads above the “riskless” government bonds, the typical reaction has been to diversify in two ways: by investing the marginal euro into more global credit exposures (such as global investment grade, high yield and emerging market debt, in particular) and by shifting the asset allocation out of bonds and into other income-generating, long-dated investments, such as real estate or infrastructure debt. At the margin, European insurance companies have increased their allocation to equities; but this has been a relatively small move.
More recently, insurance companies have begun to focus on two types of alternative investments: liquid absolute return and hedge fund strategies that aim to achieve a high level of alpha over LIBOR (absolute return emerging market debt, for example) and illiquid private equity and real estate investments that aim to capture illiquidity premiums and exploit precise expertise.
Insurers are sometimes wary of adding alternatives to their portfolios because of the high capital charges, such as those under Solvency II (S2). With alternatives often classed as ”Type 2 equity”, they incur a capital charge of almost 50% under the S2 standard model. This leads some to conclude that a 5%–10% allocation increases capital requirements by 2.5%–5% at the total balance sheet level, which would generally be considered too capital-intensive. However, the increase in required capital can actually be much smaller for several reasons. First, alternatives tend not to be perfectly correlated to other parts of the portfolio, such as bonds, meaning that diversification can help reduce risk. This effect may be limited under the S2 standard formula (which effectively assumes a 100% correlation with equity) but is often more meaningful when using an insurer’s internal model that can use more realistic correlation assumptions and reduce capital requirements. Second, investment and underwriting risks diversify because they are not correlated.
We find that adding 5%–10% alternatives increases required capital by at most 1%–2%, both on an internal model basis and under the standard method. Combining this with higher expected investment returns, albeit with a meaningful increase in risk, can result in higher return on capital (ROC).
Alternatives’ value proposition
Leaving solvency capital considerations aside, the logic behind the popularity of absolute-return-focused alternatives is straightforward: When returns from traditional risk-factor beta, such as duration, credit spread and equity, are expected to be lower, returns from alpha-dominated strategies become relatively more attractive. So, despite the average hedge fund’s failure to keep pace with equities, which have generally surpassed expectations over the last several years, demand for those with demonstrated strong risk-adjusted returns remains high. For illiquid alternatives, including various private equity and real estate strategies, the logic is similar. Any return premium earned by investing in illiquid assets and creating value from hands-on asset management becomes more valuable compared with the lower returns we expect going forward from risk-factor beta, even if they are more easily and cheaply obtained.
Alpha-dominated hedge fund strategies have the potential to provide strong diversification benefits to most portfolios. If they can equally provide a sufficiently high level of absolute return, some of which may be achieved with leverage, then there is clearly a strong case to include them in portfolios. In fact, the mantra for hedge funds has long been their potential to provide equity-like returns with bond-type volatility (many hedge fund managers target a 4%–7% volatility range) and low correlation to traditional asset classes. Whether they are successful in these three pillars or not depends of course on the managers’ investment prowess.
Clearly, it is no easy task to produce sufficiently high returns dominated by alpha. Nor is it easy to identify managers that can deliver them. Before hiring portfolio managers for PIMCO’s own hedge fund strategies, we consult intensively with them so they can develop and refine their strategies before taking in client capital. We then monitor their trading and risk management on an ongoing basis, an important distinction from many other third-party managers. Insurers also have transparency requirements that many hedge funds are unable or unwilling to meet. For these reasons, the average hedge fund may not be a good fit for the average insurance company.
Private equity and real estate strategies provide economic exposure to traditional risk factors, but are largely illiquid and cannot be sold immediately without a potentially significant impact on price. However, they can offer the incremental yield of an illiquidity premium. That premium tends to provide better compensation where there is the least competition for the assets, typically due to distress or complexity, or where active management or transitioning of the asset is required. In each case, the emphasis is on creating or releasing value over time. Given the record amount of capital raised in private-equity-style funds in recent years and the possibility that we may be reaching the limits of generating returns merely by refinancing assets, these pockets of deep value may offer more persistent opportunities by virtue of the intensive resources required to unlock them. Again, when it comes to capturing higher returns from illiquid alternative strategies, the industry average may not be the best representation of a target exposure; but rather, investors should look to experienced managers that have the resources to manage all the aspects of less common and more challenging asset types.
Alternatives in an insurance context
We believe that a selective approach to alternatives can improve portfolio efficiency (measured by the Sharpe ratio), and key insurance performance measures that take into account the higher capital consumption of alternatives, such as ROC. To illustrate this for a general insurer, we take a typical balance sheet and add alternatives to the asset mix. We have done a similar exercise for a typical life insurer and reached the same conclusions.
So what does this typical balance sheet look like?
We assume the insurer has a healthy solvency position with excess reserves equal to 40% of assets. The assets are mainly invested in fixed income (90%), with 5% allocated to equities and real estate each. Figure 1 summarises our key assumptions used to calculate the estimated ROC for this typical insurer. The main components of this calculation are:
- Estimated return on assets (a): We calculate this as 0.7% based on PIMCO’s Capital Market Assumptions (CMAs), and netting off the estimated liability growth rate as 0.5%. For simplicity, we assume that assets and liabilities are fully duration-matched.
- Market risk capital requirement (b): This represents the capital required based on the hypothetical portfolio’s market risks. We estimate this amount at 9.3% based on PIMCO’s internal risk-factor model, and at 5.5% based on the S2 standard model. The internal model capital requirement is higher due to more conservative risk assumptions.
- Underwriting risk capital requirement ©: We assume the underwriting business incurs a 35% capital requirement (of liabilities; 21% of assets, or 35% x (1-0.4)).
- Total required capital (d): This represents the aggregate capital required for market risk (b) and for insurance risk ©, assuming a +25% correlation between the two.
- Underwriting risk ROC (e): We assume this to be a 7% ROC.
Note: For both underwriting risk capital requirement and underwriting risk ROC, we believe these calculations to be realistic assumptions based on our experience.
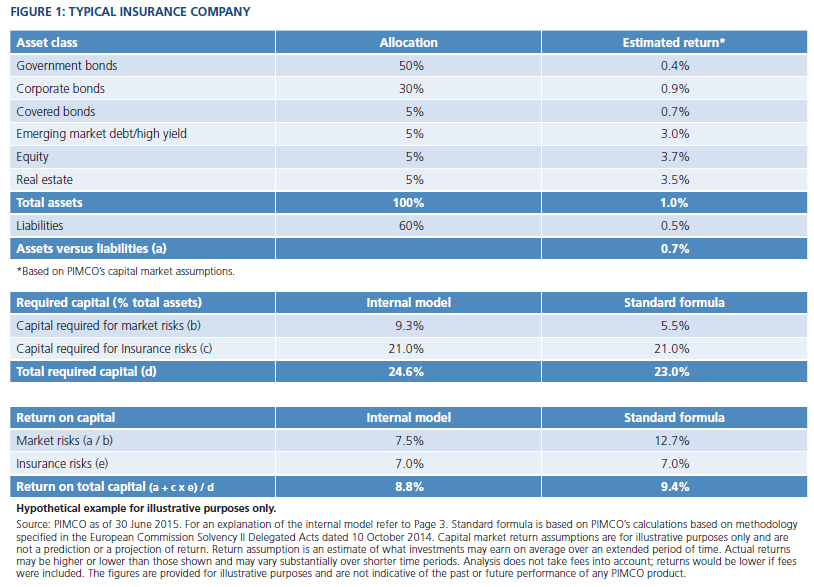
By combining capital requirements for both market and underwriting risks, we arrive at a total capital requirement of 24.6% of assets under PIMCO’s internal model, and 23% under the S2 standard model. This allows us to calculate the overall business ROC ((a + c x e) / d), which comes out at 8.8% under the internal model and at 9.4% under the S2 standard model.
So, what happens if we add 5% and 10% of alternatives to this portfolio?
We find that this improves the ROC, whether we take these allocations from perceived ”safer” assets (e.g., government bonds and credit) or risk assets (e.g., equities, high yield, emerging market debt).
Funding the alternatives allocation from safer assets could be attractive for an insurer that is keen to boost returns and has sufficient capital to take the additional risk. Re-allocating from risk assets could be attractive to more capital-constrained or more risk-averse insurers looking to create a more diversified, less beta-dependent return-seeking part of the portfolio.
Our sample alternatives portfolio consists of 70% absolute-return-focused alternatives and 30% private-equity-style investments, with an estimated return of 7% and volatility of 12% (see disclaimer for additional detail). This implies a Sharpe ratio of just over 0.5, which we believe is achievable. Both approaches increase estimated return meaningfully (see Figure 2). Switching from risk assets reduces risk for a small 5% allocation because the resulting portfolio is more diversified, mixing beta and alpha return sources. Even when switching 10%, the overall risk does not increase much compared with the starting position.
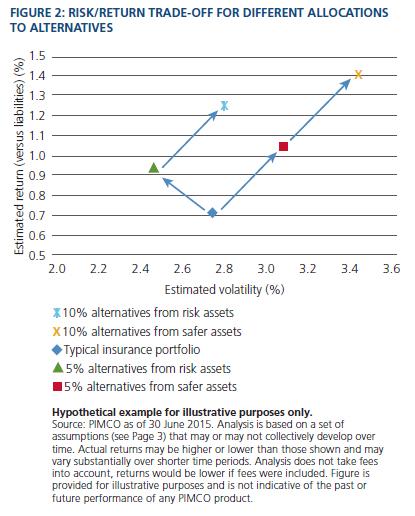
When funding the alternatives allocations from the safer assets, risk and required capital increase as expected, but for a larger increase in estimated return as lower-yielding safer assets are replaced with higher-returning alternatives.
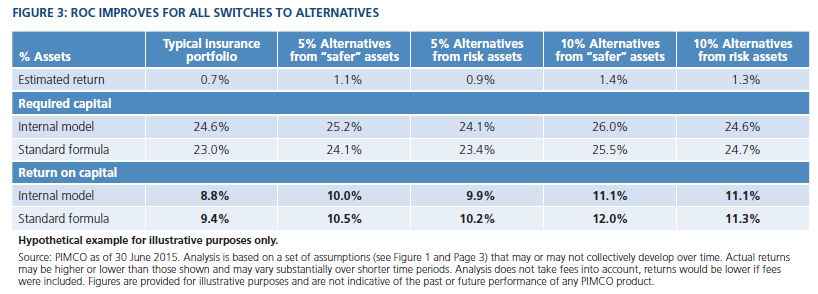
Finally, we look at the impact on the overall balance sheet: ROC improves for all switches to alternatives (see Figure 3). Switching from risk assets improves ROC slightly more than moving out of safer assets. The total capital requirements for all solutions are well within the 40% total available capital.
The benefit of adding alternatives
European insurers face a difficult environment as returns from their traditional core assets have shrunk. Alternatives offer one way to boosts these returns, even for relatively small allocations. Our analysis indicates that adding alternatives may not only make economic sense, but it also has the potential to improve ROC.
The authors would like to thank Soraya Kazziha, head of PIMCO’s EMEA Client Analytics team, for her work in designing, developing and running the models used to assemble the typical insurance case study.