|
Key Takeaways · Throughout the month of June leading up to the Brexit referendum vote, the markets appeared to have trouble deciding which way the vote would go. · Markets were firmly higher on the day of the vote, exhibiting confidence that Britons would choose to stay in the EU. · As vote counts trickled in, currency and futures markets grew increasingly volatile with the rising prospect that Brexit would prevail. · The next morning equity markets opened sharply lower, displaying the characteristics of a classic gap event. · In addition to being expensive, option-based gap risk protection is difficult to time and often doesn’t pay off. |
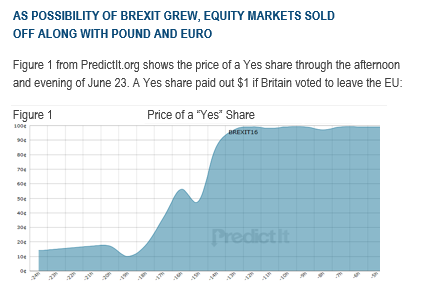
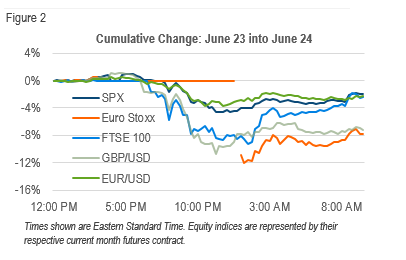
Markets exhibited strength on the afternoon of the 23rd, underscoring confidence in a “Bremain” outcome. As vote counts came in and the possibility of a Brexit moved closer to becoming reality, the cost of a Yes share climbed and equity and currency markets became increasingly unsettled:
LEADING UP TO THE VOTE
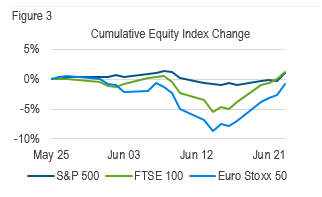
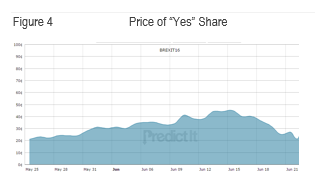
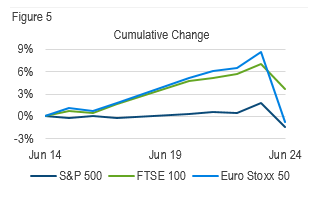
As indicated in figures 3 and 4, equity markets began to sell off during the second week of June as Brexit appeared to be increasingly likely.
On June 14, as sentiment changed and the likelihood of Brexit seemed to be waning, equity markets started to climb back to early June levels:
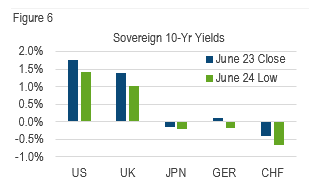
As money fled equity markets, sovereign bonds were the beneficiaries, pushing yields sharply lower. The 10-year government yields in the UK, Japan, Germany and Switzerland each made new all-time lows:
MANAGED RISK PORTFOLIOS
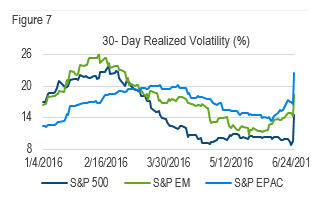
After peaking during the selloff in February, equity market volatility in 2016 trended down, remaining at subdued levels from April into June.
During the second week of June, at the same time that equity markets began to decline, volatility in international markets began to rise, but remained low in the U.S.:
The result was that different managed risk portfolios had different levels of equity exposure as the vote date drew nearer.
Heading into June 24, the S&P 500 Managed Risk Index, which targets volatility of 18% with no fixed allocation to bonds, still had the 100% equity allocation it had maintained through all of May. As such, its return on the 24th matched that of the S&P 500. In small cap stocks, however, higher volatility left the S&P 600 Managed Risk Index with an equity weight of 87%.
Outside of the U.S, realized volatility had already crept higher and that was reflected in the indices. Heading into June 24, the S&P Emerging Plus LargeMidCap Managed Risk Index had a net equity allocation of 78% while the S&P EPAC Ex. Korea LargeMidCap Managed Risk Index had a net equity allocation of 58%. These hedges resulted in less downside participation on the 24th.
PROTECTING AGAINST GAP RISK EVENTS
Brexit has all the makings of a gap risk event—low leading volatility up to the event, and a significant change in price level with no trading in between. Scenarios like this understandably leave many investors asking why managed risk strategies like the aforementioned don’t try to protect against gap risk events.
The answer is twofold. First, maintaining ongoing protection against gap risk is expensive. Second, such efforts are difficult to time and often don’t pay off. Both of these reasons were especially true regarding Brexit.
To illustrate this, we considered three hypothetical investors in the US, UK, and Eurozone looking to protect their end-of-May portfolio values against a Brexit-related selloff. Their loss tolerance is 10%. To protect their portfolios, they used one-month index put options that are 10% out of the money (OTM), based on the May 31 index closing price.
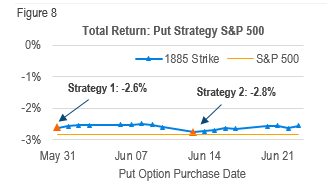
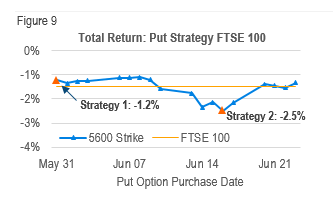
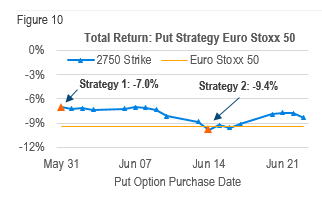
Each point in the following charts represents the total return investors would have earned (option return + equity return) through June 24 had the respective put option been purchased on that particular date. The orange line in the chart corresponds to the simple return of the index from the close of May 31st through the close of June 24th.
Each option is selected for each investor’s loss tolerance based on the closing level of the index as of May 31 and is used for the entire month. The following table indicates the May 31 index levels and respective strikes to approximate the level of protection sought by the investor:
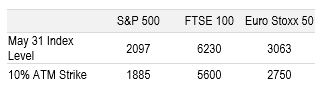
For example, had the investor purchased the 1885 S&P put option on May 31 (strategy 1) he would have earned a return (option return + equity return) of -2.6% through June 24, while purchasing the option on June 13 (strategy 2) would have generated a return of -2.8% through June 24:
A few observations:
- Protecting against a Brexit-related selloff did not pay off: though some helped reduce losses, some exacerbated them. In most cases the reduction of losses was mild.
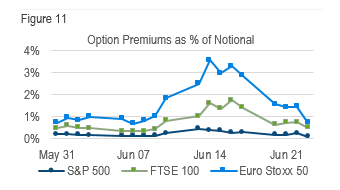
- In many instances these gap puts generated little or no positive excess return. This is due in large part to the large premium expense relative to the expected payoff.
- Premiums during the period for these options ranged from 0.1% of notional on the S&P 500 to as high as 3.6% on the Euro Stoxx 50:
- It can be easy to overlook the fact that options expire and that long option strategies don’t offer the luxury of waiting indefinitely for the price to recover. With each passing day options lose a portion of their time value, which means that absent changes in other variables, an option’s value is always moving closer to zero. If the option is held to maturity and is out of the money, the premium that was paid for the option is lost. Had the Brexit vote gone the other way, total returns would have been lower across the board as a result of the premium evaporating.
- The nature and timing of most risk events are unpredictable. The Brexit vote was not like most risk events in that the exact timing was known and there were only two possible outcomes. Protecting against known binary-outcome events is an entirely different endeavor from maintaining ongoing protection against unknown events.
This is not to say that gap protection never has a place in any portfolio. In instances where an investor doesn’t want to get out of a position but can’t tolerate a short-term decline in its value, option strategies can be an appropriate solution. As a long-term, ongoing approach to risk management, however, the challenges associated with cost and timing make it less viable.
By contrast, a managed risk approach combines a capital protection mechanism with volatility management. The capital protection mechanism is a manufactured put-like strategy that is cheaper to implement than options, due in large part to the volatility management. Rather than being designed to protect against gap events, a managed risk approach is designed to protect against the instances when the initial gap turns into a volatile and protracted downturn. It is precisely by reducing equity exposure in volatile markets that managed risk strategies mitigate their participation in extended drawdowns.
We believe it will take some time for the dust to settle on the Brexit vote; but even beyond that, risks to the global economy and markets abound and managing portfolio risk remains critical to managing and preserving wealth.
|
Creating transformational improvement in the retirement savings industry. |
Milliman Financial Risk Management LLC is a global leader in financial risk management to the retirement savings industry. Milliman Financial Risk Management (FRM) provides investment advisory, hedging, and consulting services on $169 billion assets (as of December 31, 2015).
Established in 1998, the practice includes over 140 professionals operating from three trading platforms around the world (Chicago, London, and Sydney). Milliman FRM is a subsidiary of Milliman, Inc.
Milliman, Inc. (Milliman) is one of the world’s largest independent actuarial and consulting firms. Founded in Seattle in 1947, Milliman has 55 offices in key locations worldwide that are home to over 2,600 professionals, including more than 1,300 qualified consultants and actuaries.