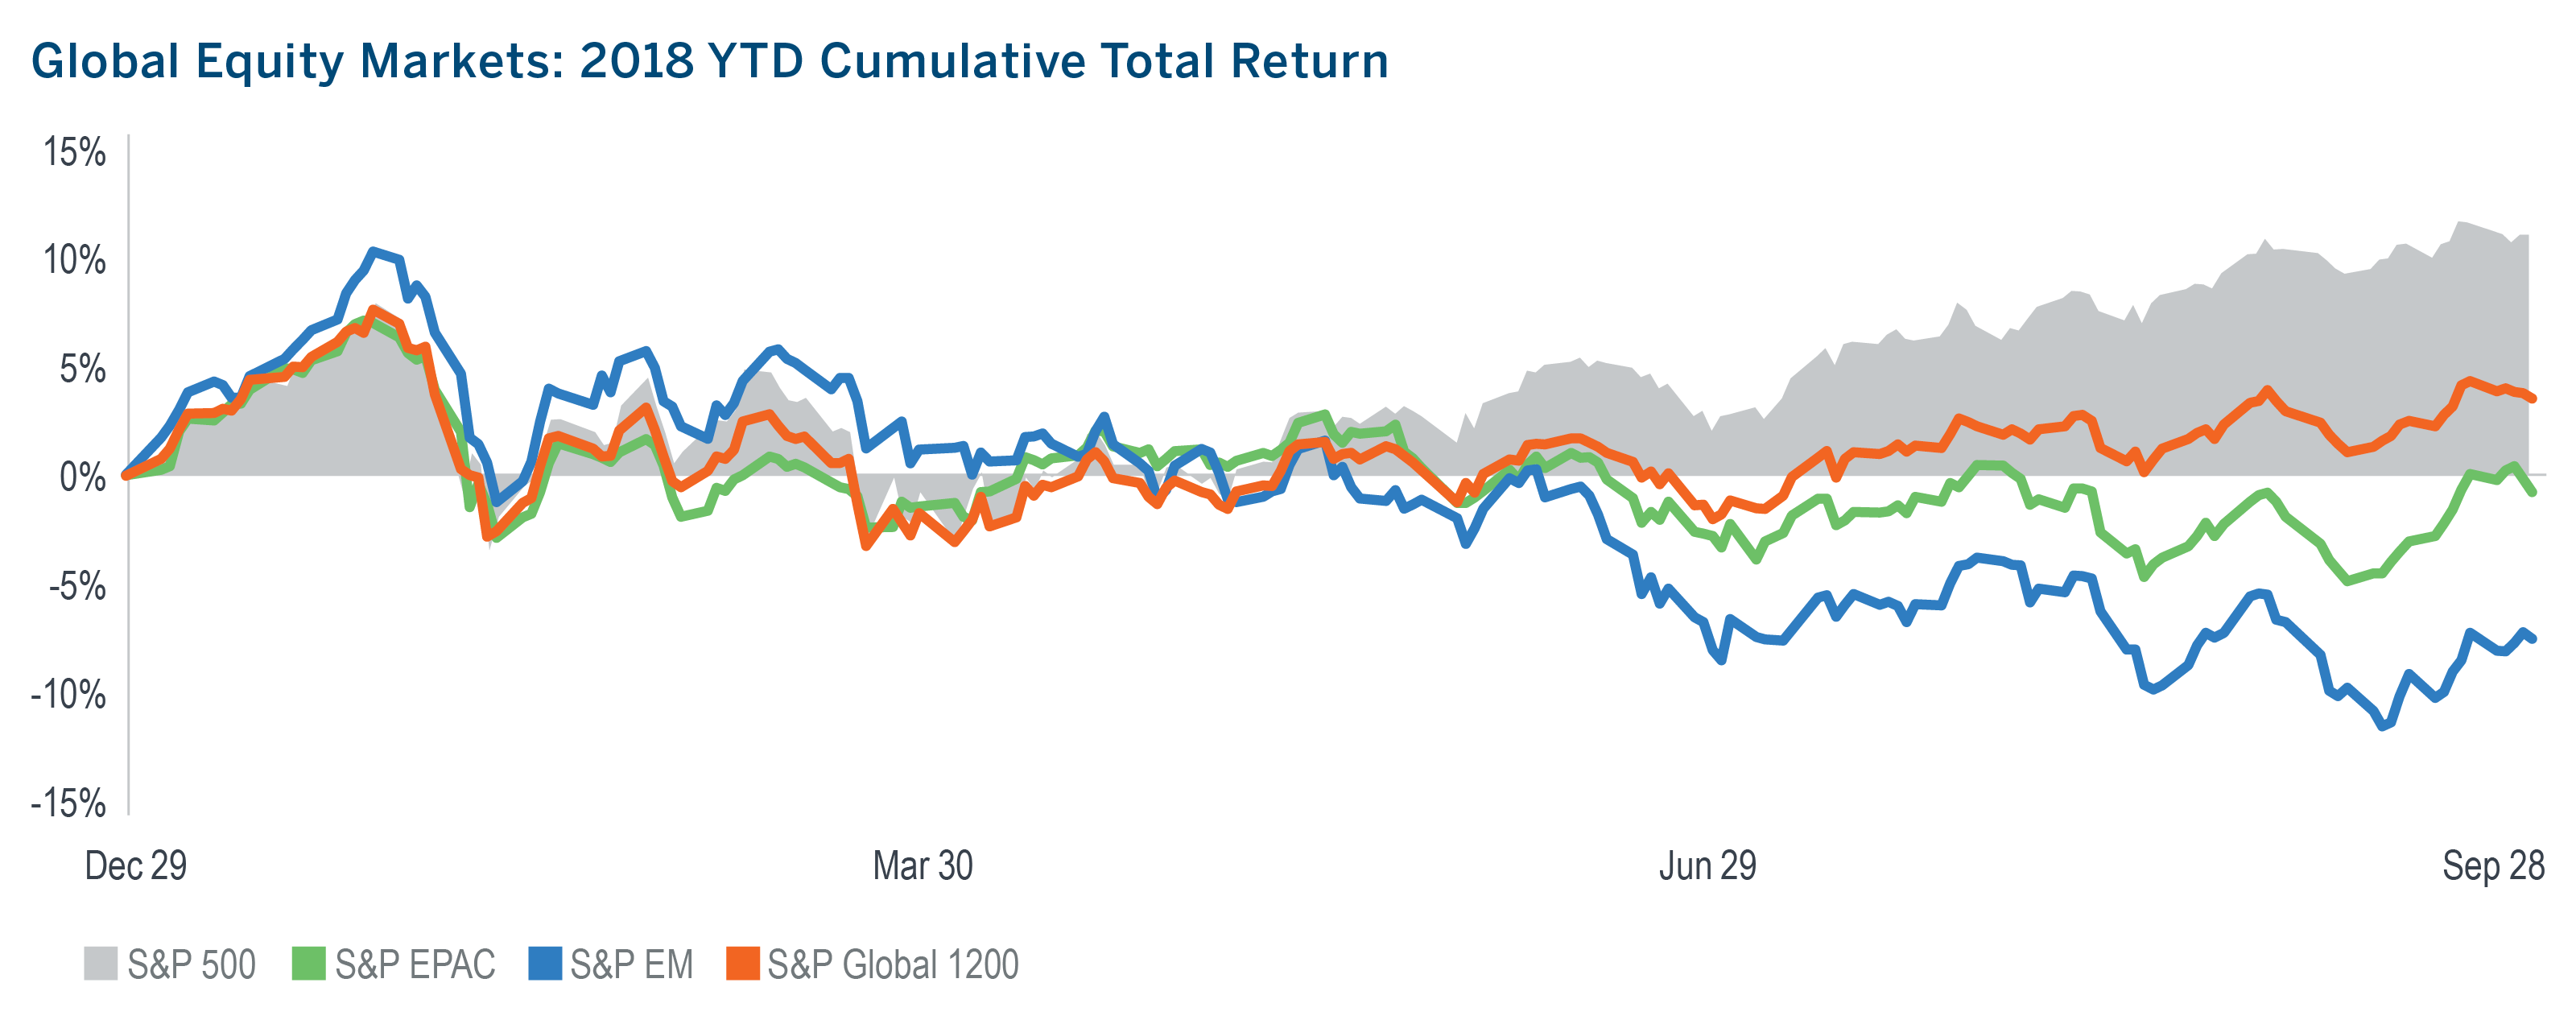
S&P 500 Posts Its Best Quarterly Return Since 2013
- With a 0.6% return in September, the S&P 500 locked in a 7.7% return for Q3 2018, its best since Q4 2013.
- Out of the last 25 calendar quarters, the S&P 500 has generated just three quarterly losses, only one of which exceeded 1%.
- As U.S. stocks continued their run, EM stocks extended their losing streak, declining for their second straight month and the seventh out of the last eight.
- After climbing six straight months for a total return of 20%, small cap stocks took a breather in September, declining more than 3%.
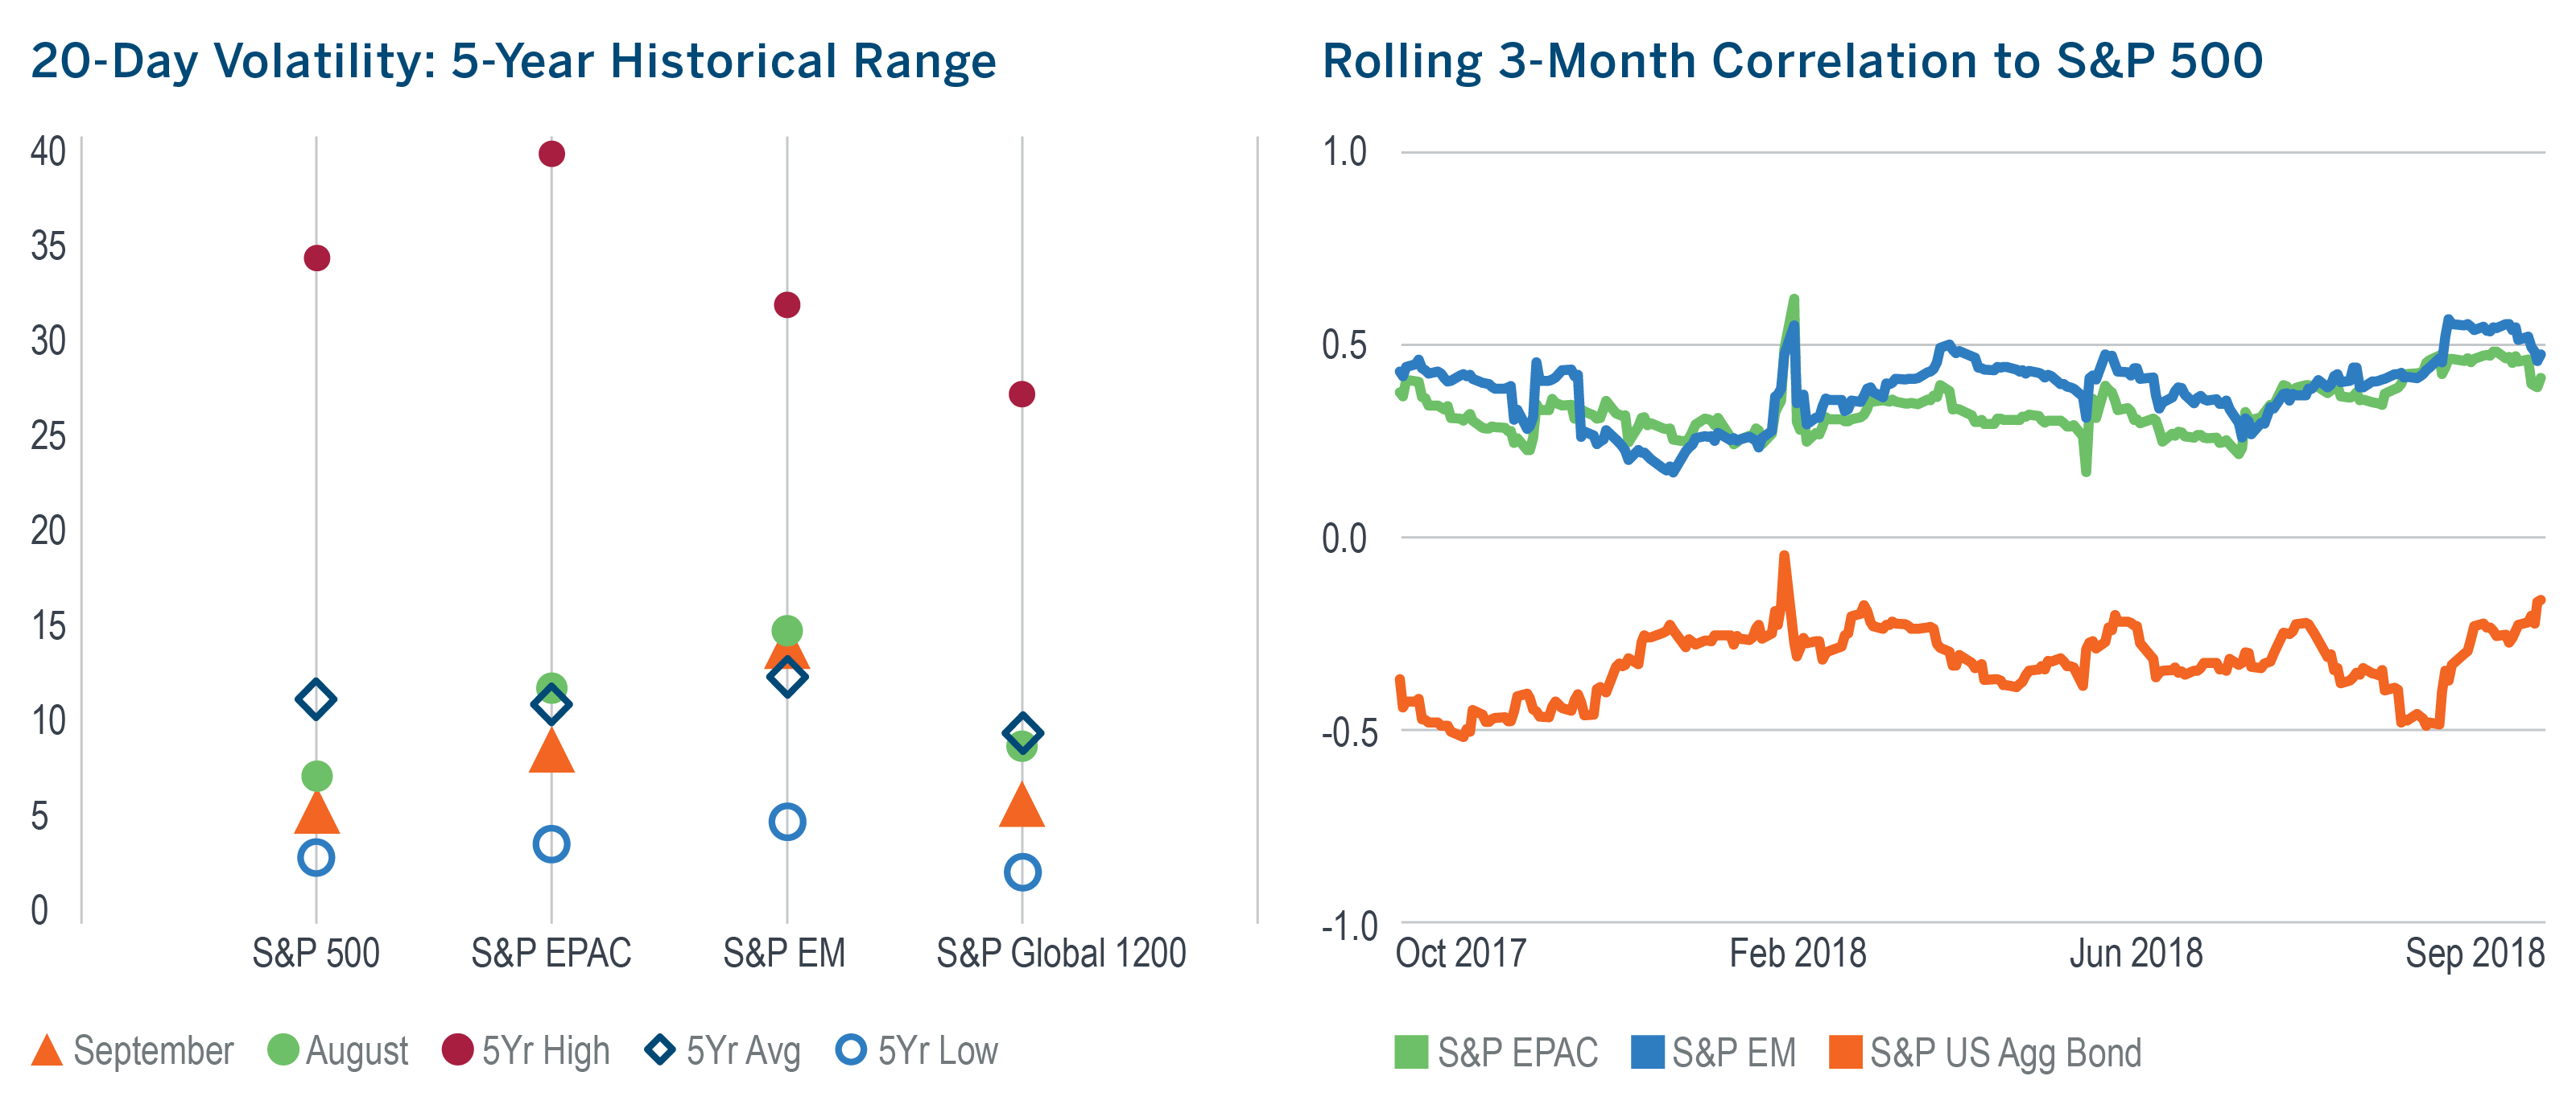
- After an exceptionally low August, U.S. equity volatility edged even lower in September. In contrast, EM equity volatility remained elevated, again hovering above its five-year monthly average.
- The correlation of the S&P 500 to global ex-US equities declined in September, while its correlation to the U.S. aggregate bond market, increased to its highest level since February.
Managed Risk Investing
- September was the calmest month so far in 2018 for the S&P 500. This left the S&P 500 Managed Risk Index, which has an 18% volatility threshold and no fixed allocation to bonds, at a 100% equity allocation for the entirety of the month.
- In September, the Index outperformed a 70/30 blend* by 41 bps, its fifth consecutive month of outperformance; for the quarter, the Index outperformed the blend on both an absolute and risk-adjusted basis.
- Over the last 10 years, much of which was a bull market for bonds, the Managed Risk Index has exhibited marginally higher average monthly volatility than a 70/30 blend*, while generating an average excess monthly return of 20 bps, equal to an annualized excess return of 2.60% per year.
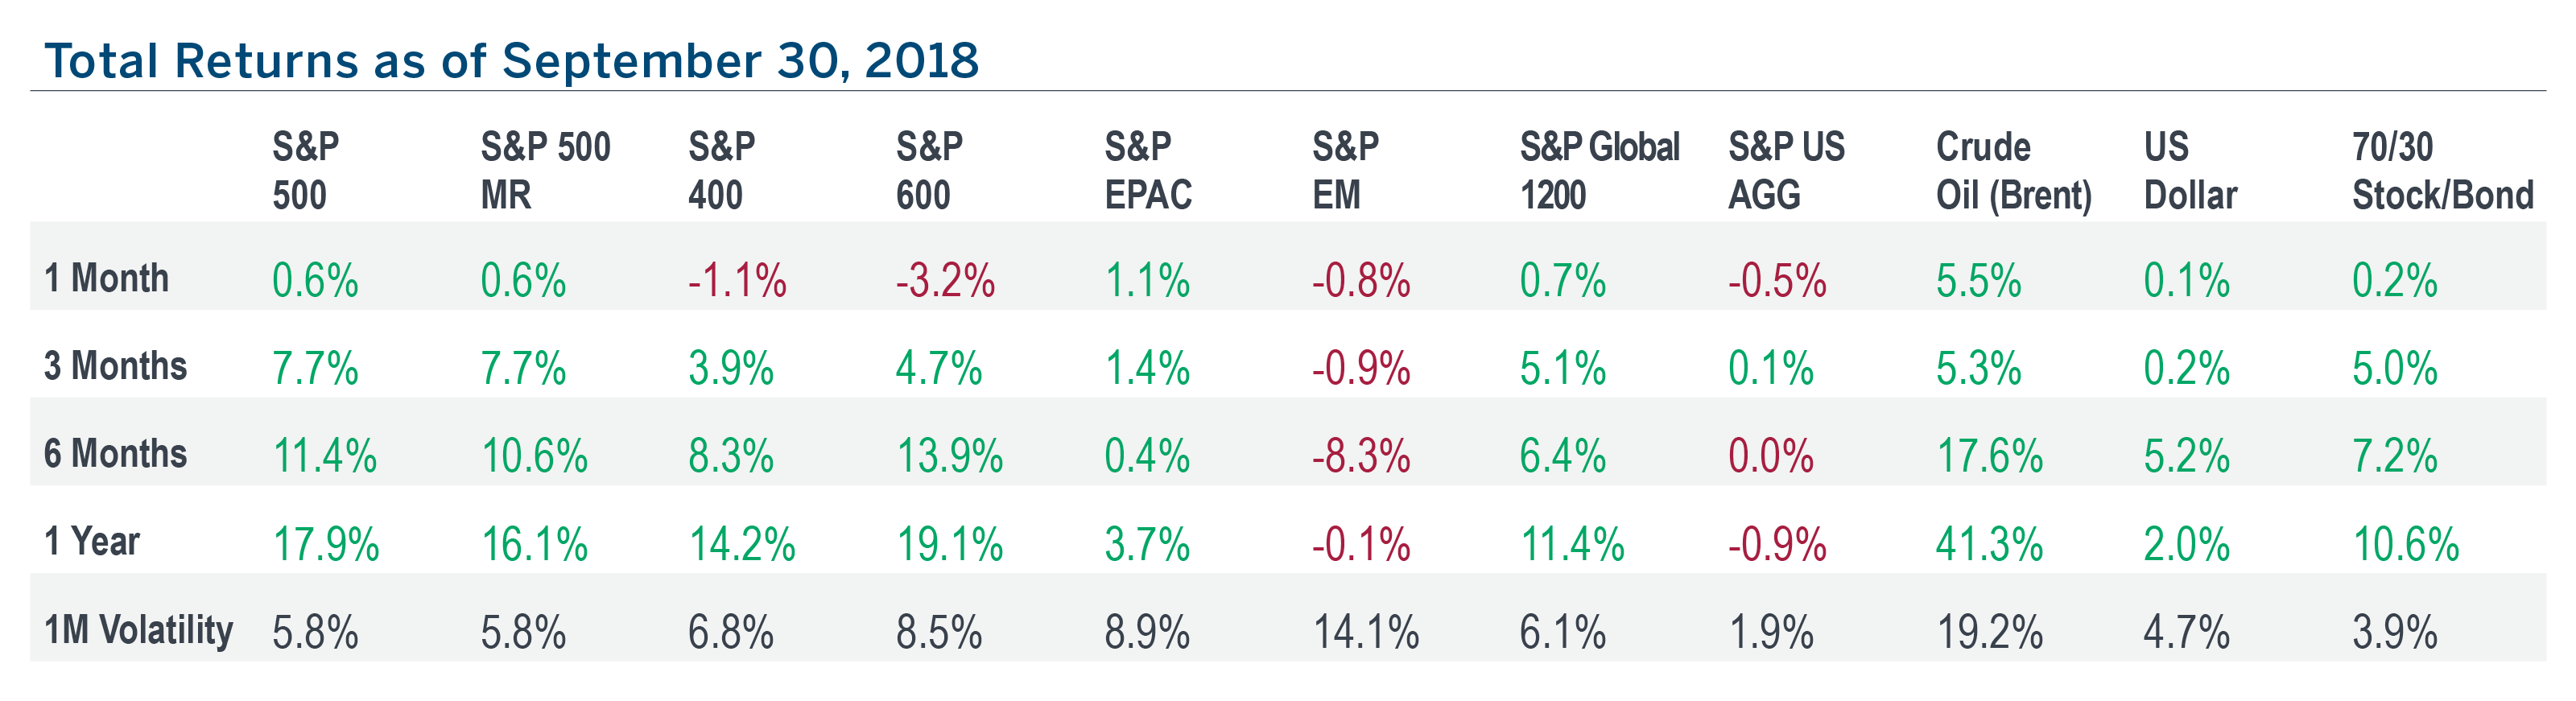
- The price of Brent crude oil climbed 5.5% in September, closing above $80/barrel for the first time since 2014.
- The Fed made its eighth rate hike in three years, raising the Fed funds rate target to 2.25%.
- The yield curve made an almost perfectly parallel shift upward, finishing the month near the peak of its range of the last four years.
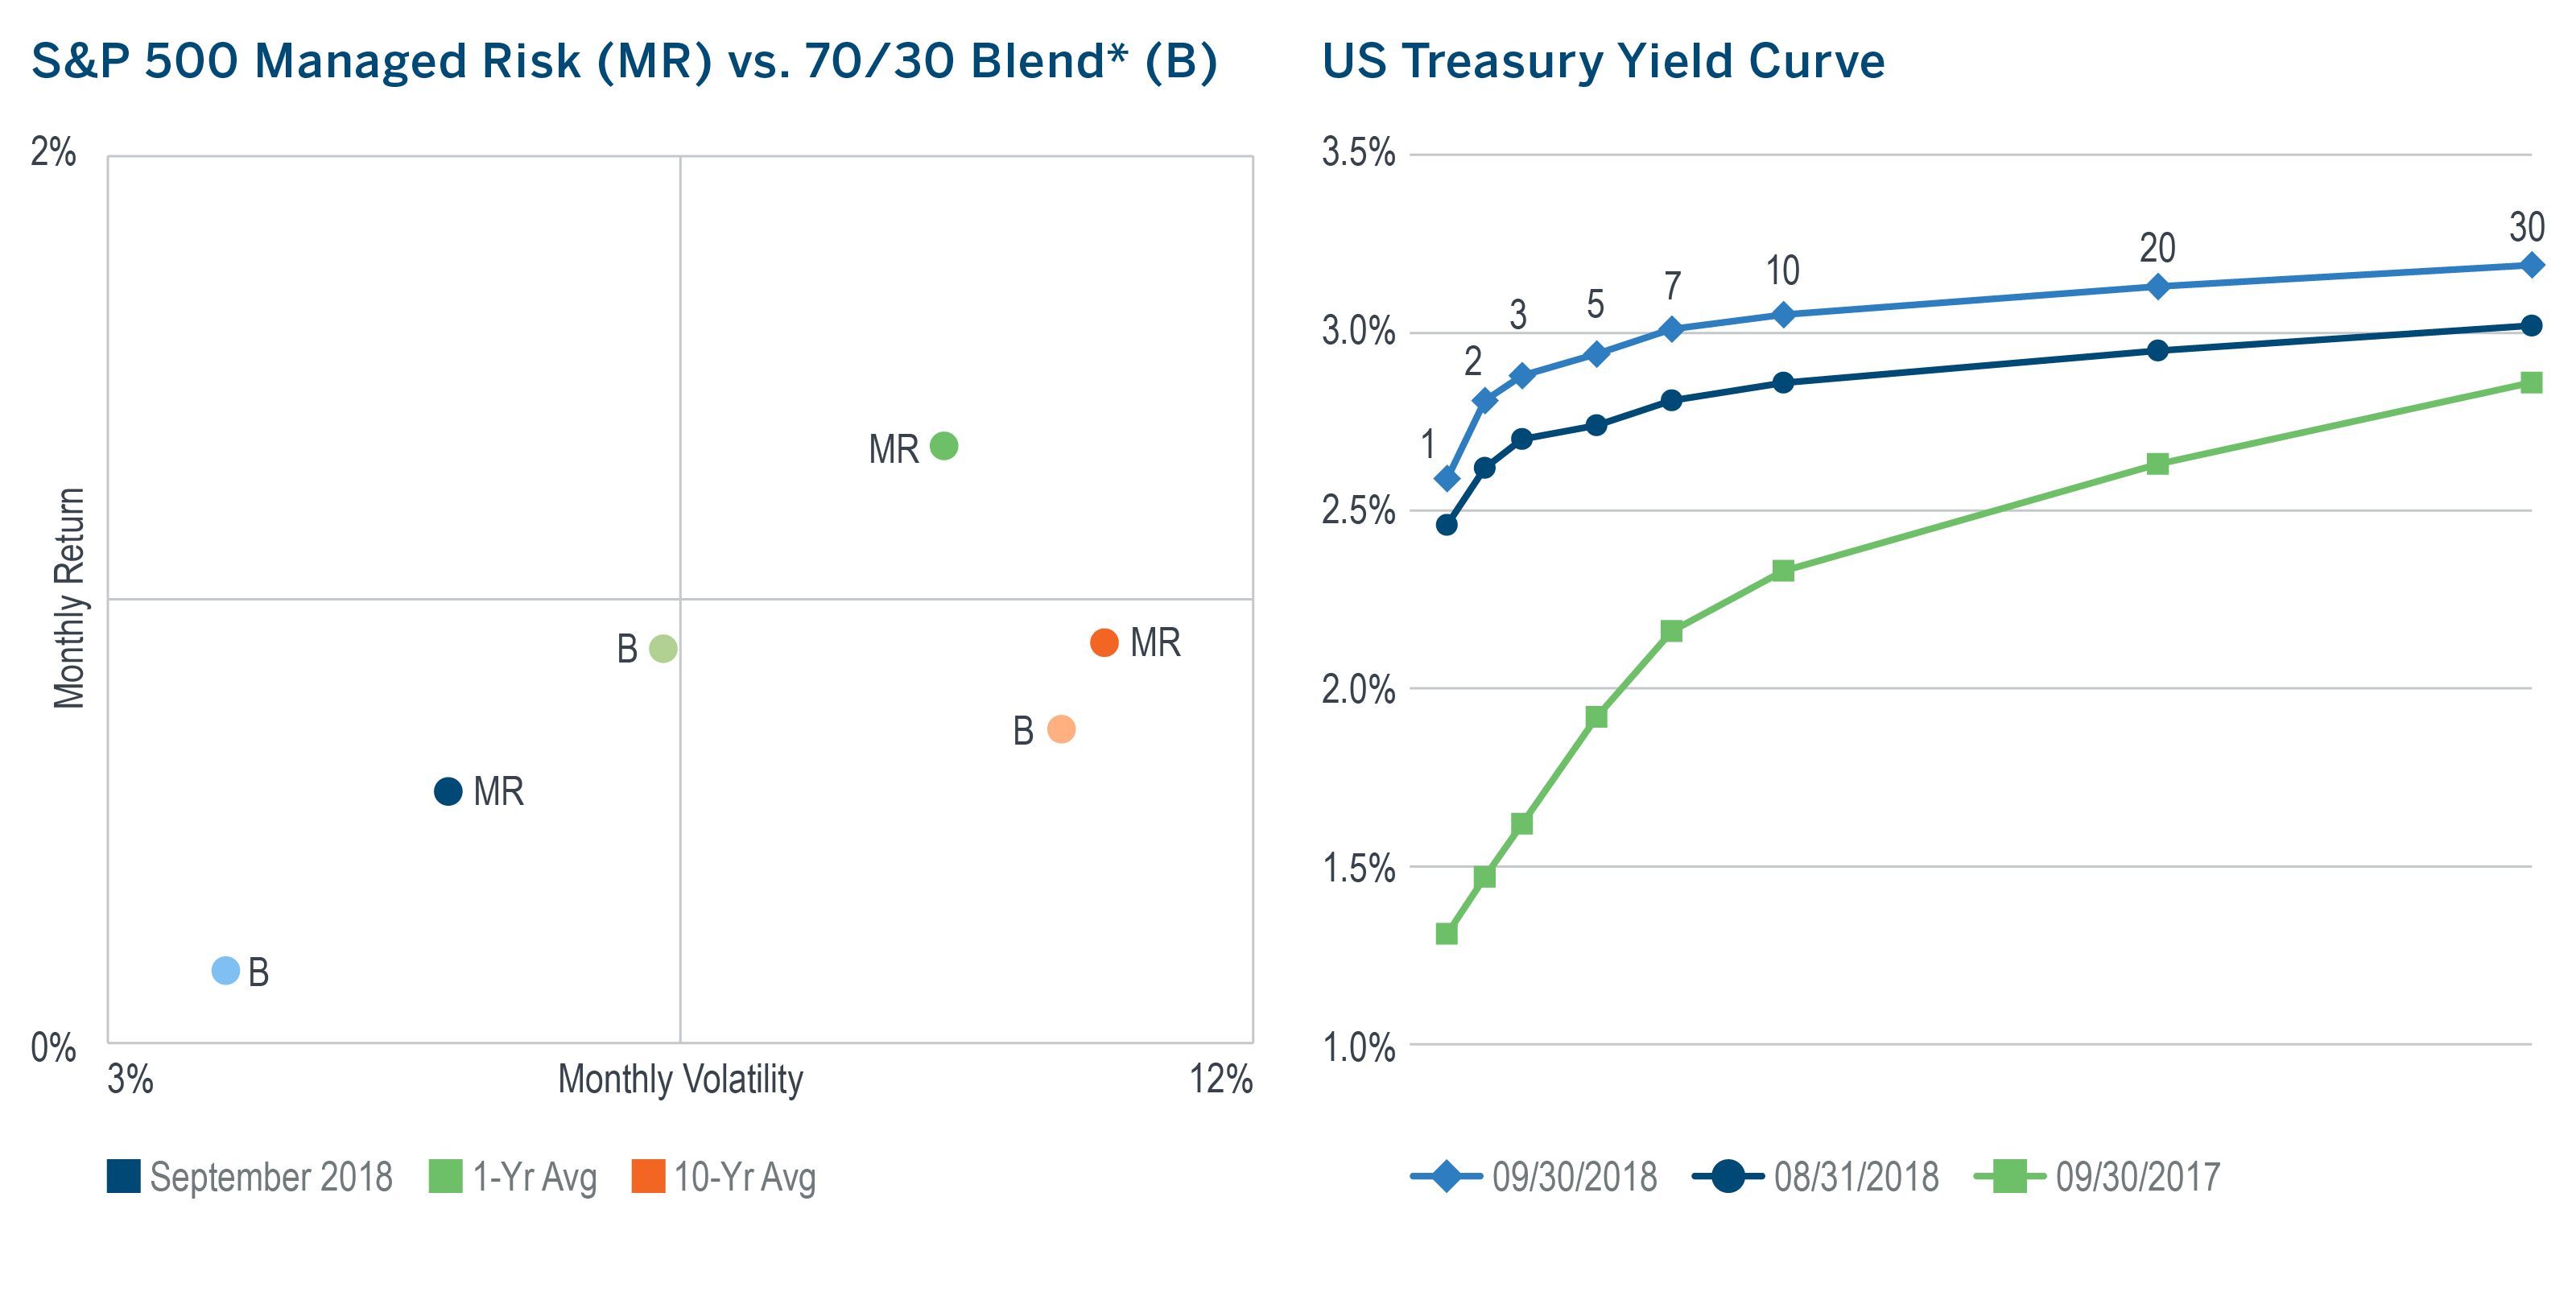
*As measured by the S&P 500 Index and the S&P US Aggregate Bond Index.
Capital Markets Increasingly Reflect Growing Divergence
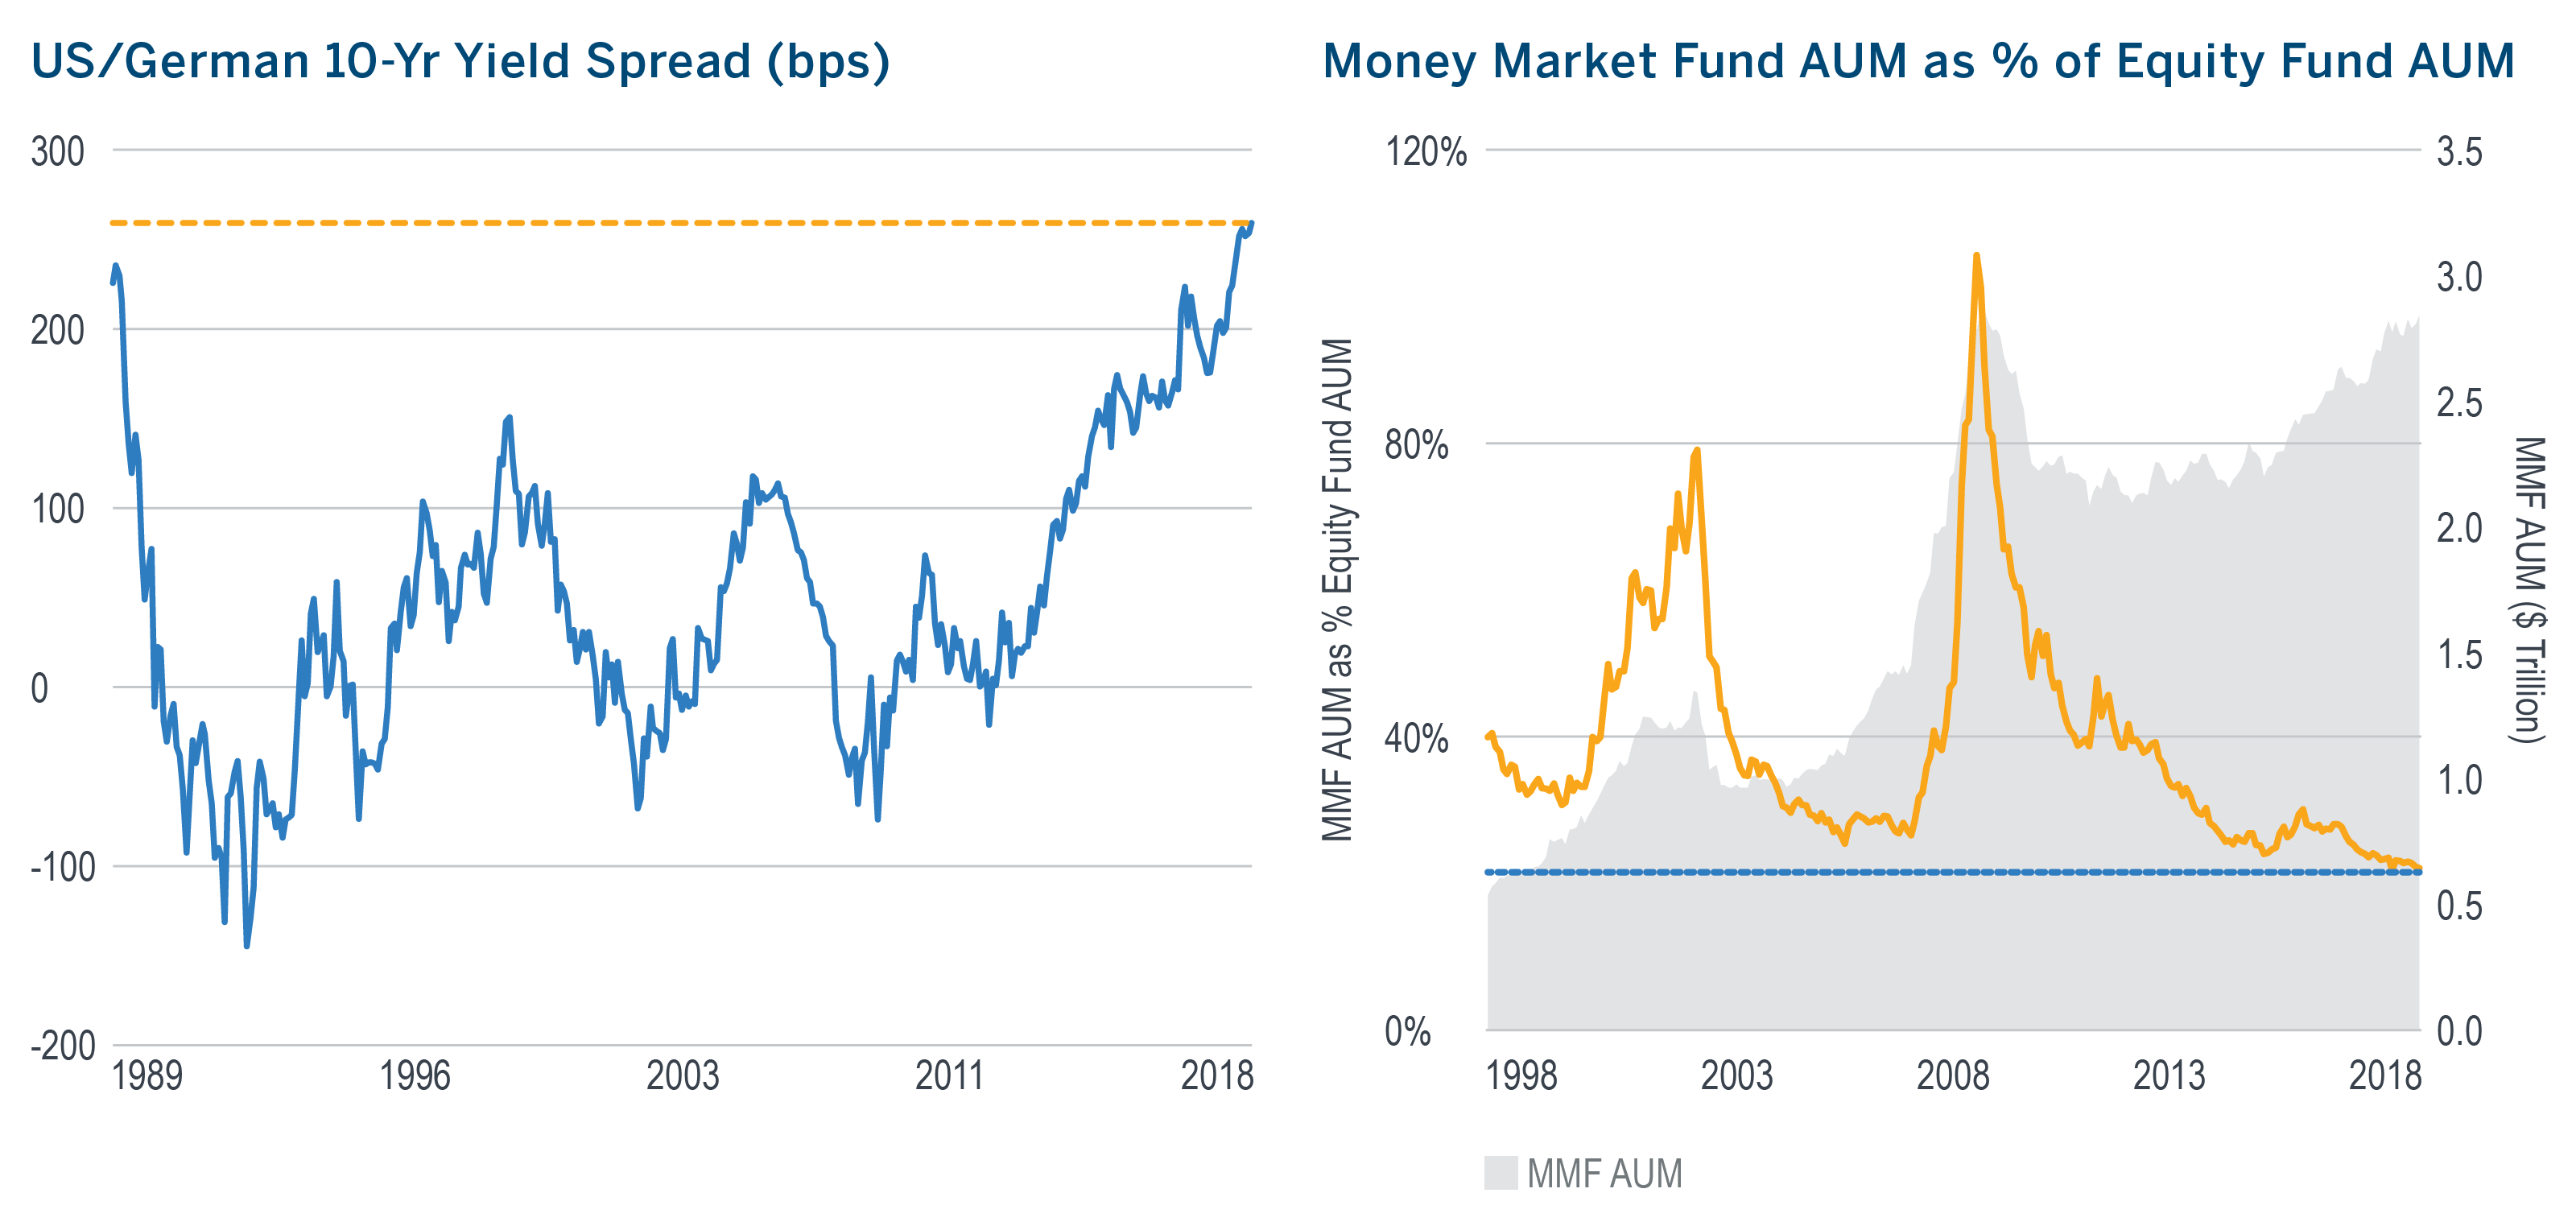
- Expectations of higher growth and inflation in the U.S. have lifted the yield on the 10-year U.S. Treasury bond to its highest level in nearly 30 years, relative to its German government counterpart.
- If money market funds are the destination of risk averse capital, then on a nominal basis, their historically high level of assets would suggest that investors were feeling cautious. Relative to equity fund assets, however, it suggests that over the last 20 years investors have never felt more confident.
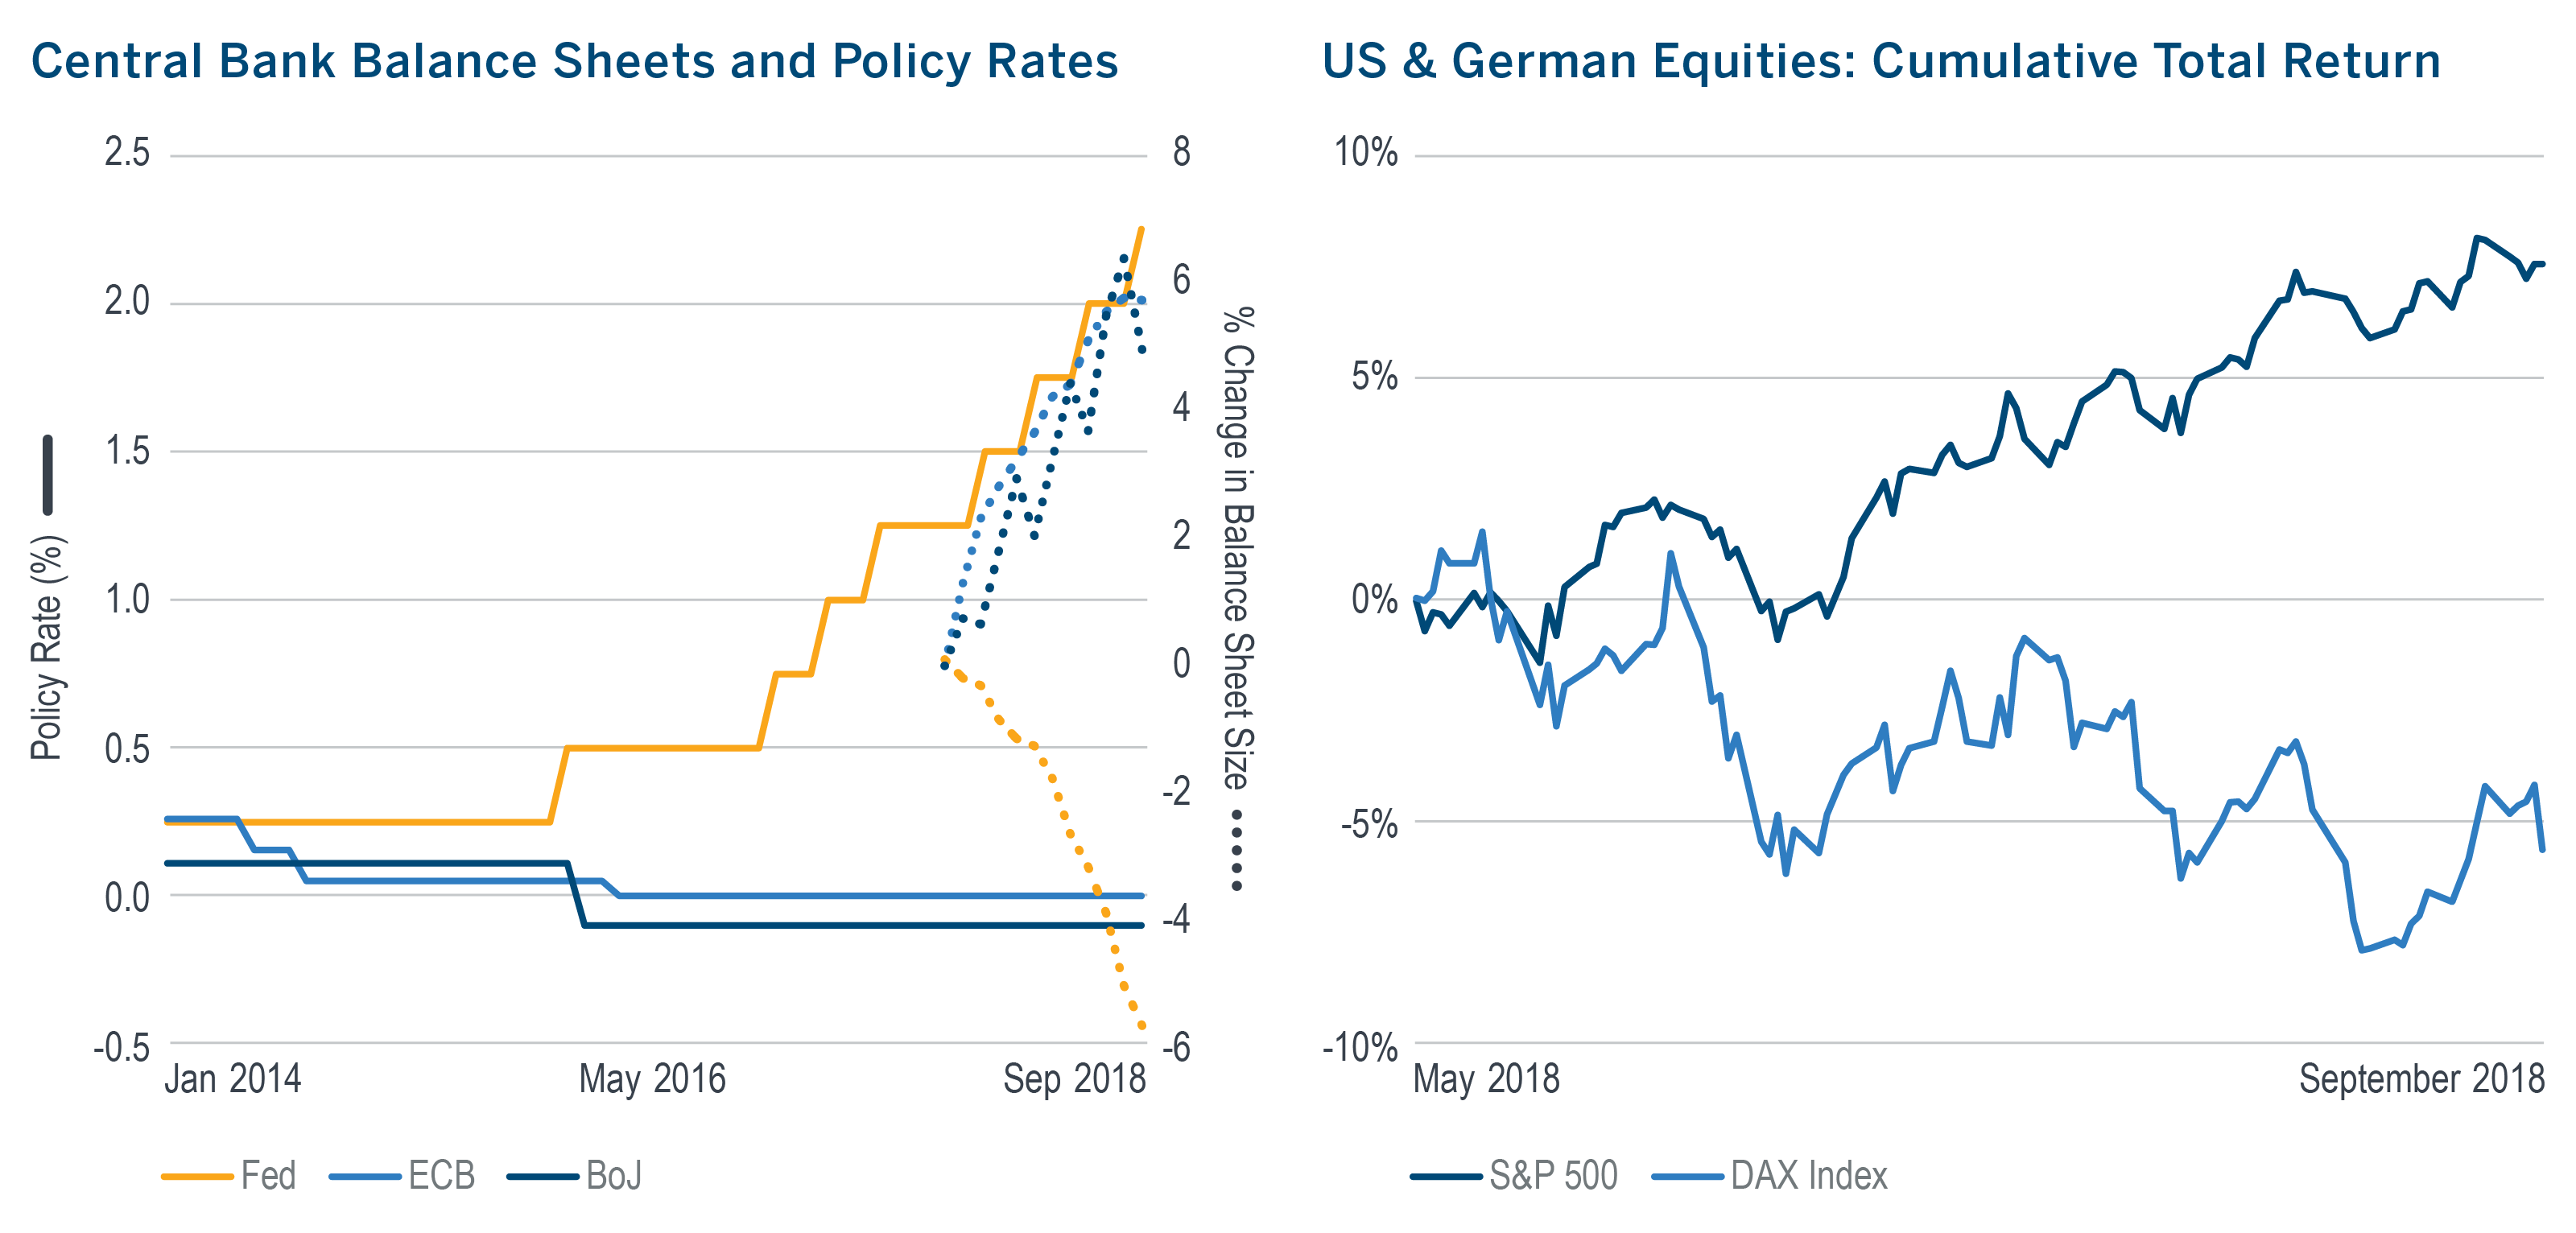
- The Federal Reserve is now nearly three years, eight rate hikes and $200 billion into its normalization of U.S. monetary policy. The European Central Bank and Bank of Japan, on the other hand, continue to hold their policy rates at 0% and are still conducting quantitative easing to keep longer-term yields low.
- Consistent with the widening yield spread between the US and German government bonds, U.S. and German equities are also diverging. The S&P 500 is up 8% since mid-May, while the DAX Index is down 6%.
- When the historical relationship between two entities continues to diverge, expectations of reversion to the norm tend to increase. One might argue that central bank-induced divergence, now eight+ years in the making, is due for a reversion.
Download pdf here
Recipients must make their own independent decisions regarding any strategies or securities or financial instruments mentioned herein.
The products or services described or referenced herein may not be suitable or appropriate for the recipient. Many of the products and services described or referenced herein involve significant risks, and the recipient should not make any decision or enter into any transaction unless the recipient has fully understood all such risks and has independently determined that such decisions or transactions are appropriate for the recipient.
Past performance is not indicative of future results. Index performance information is for illustrative purposes only, does not represent the performance of any actual investment or portfolio, and should not be viewed as a recommendation to buy/sell. It is not possible to invest directly in an index. Any hypothetical, backtested data illustrated herein is for illustrative purposes only, and is not representative of any investment or product.
Any discussion of risks contained herein with respect to any product or service should not be considered a disclosure of all risks or a complete discussion of the risks involved.
The recipient should not construe any of the material contained herein as investment, hedging, trading, legal, regulatory, tax, accounting or other advice. The recipient should not act on any information in this document without consulting its investment, hedging, trading, legal, regulatory, tax, accounting and other advisors.
The materials in this document represent the opinion of the authors and are not representative of the views of Milliman, Inc. Milliman does not certify the information, nor does it guarantee the accuracy and completeness of such information. Use of such information is voluntary and should not be relied upon unless an independent review of its accuracy and completeness has been performed. Materials may not be reproduced without the express consent of Milliman.
MIL_COM_1 9/18_9/19 © 2018 Milliman Financial Risk Management LLC
Unless otherwise noted, data is sourced from Bloomberg.
© Milliman Financial Risk Management LLC


