Doctors take a patient's blood pressure for a big-picture view of cardiovascular health. Investors who want similar insight into Wall Street's health have their own measurement, and it doesn't involve diastolic numbers. Measuring market breadth is a quick way to check the market's pulse to help determine if it's more likely to slow down or quicken.
Combined with other measurements, breadth can indicate potential sentiment trends and shifts not only in major indexes but also in various sectors. This can help active market participants pinpoint hot or cold spots.
"Breadth is like a gauge of the market's blood pressure," said Joe Mazzola, head trading and derivatives strategist at Schwab. "It gives you a sense of whether there's strength or weakness. It's a validating signal of sentiment that gives insight into how narrow or how broad participation is. The broader the participation, the stronger the signal."
A major rally built on narrow participation, or breadth, can quickly fade if a handful of stocks doing the heavy lifting start struggling. That happened in mid-2023, when heavily capitalized "Magnificent Seven" stocks that swing lots of weight on the major indexes began to fade after lifting indexes earlier that year. The rally depended heavily on those stocks, and when they sold off, the rest of the market washed out too. Anyone tracking the narrow breadth might have sensed the rally's blood flow could face a blockage.
What is breadth?
Various breadth measures can give investors a sense of how strong or weak a move is by calculating the number of stocks participating versus not participating. Some traders will track percentages of stocks above a moving average. Some will track advancing versus declining stocks or new highs versus new lows.
"The real key is identifying whether breadth is increasing or decreasing relative to the overall market move," Schwab's Mazzola said. "When breadth is increasing and the market is rallying, this indicates underlying strength and broadening participation. If the breadth is decreasing while the market is rallying, this could indicate some weakness in the internals, suggesting fewer stocks are participating. Identifying these shifting dynamics could give market participants an early warning signal that the rally could be losing steam."
For instance, if the market rallies for several days and 80% of S&P 500® index (SPX) stocks are trading above their respective 50-day moving averages, that's one signal the rally is broad-based, hinting at positive sentiment across the spectrum. Eighty percent—meaning 400 of 500 SPX stocks are moving upward—is considered solid bullish breadth. It isn't a perfect determinant, of course, and should be monitored with other technical factors.
How to track breadth
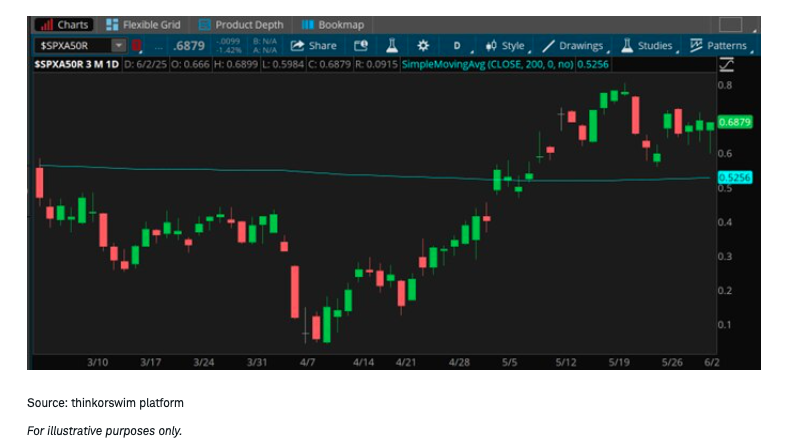
Breadth can be calculated on Schwab's thinkorswim® platform. On thinkorswim, go to the Charts tab and type in $SPXA200R for the percentage of S&P 500 stocks above their 200-day moving average. (The symbol $SPXA50R tells you how many stocks are above their 50-day moving average.) You can adjust the period by selecting Time Frame setup from the Style subtab and choosing the time frame interval.
The chart below tracks the percentage of SPX stocks above and below their respective 50-day moving averages over a three-month period from early March to early June 2025. This is only meant as an example, but it was an interesting three months, as the percentage bottomed as low as 4% on April 9, the day the index reached a tariff-sparked 15-month low. This reading then climbed as high as 80% by late May once tariff threats receded slightly. This was a rare instance where most stocks across the market moved the same direction.

The chart above shows the average breadth over the three months tracked (blue line) was 52%, but that belies how quickly sentiment swung over that period. Weak breadth at the bottom might have signaled a near-term low in the market, as participants had pushed nearly every stock in the S&P 500 well below their near-term averages.
Breadth signals
While there's no perfect way to detect possible trend changes in markets buffeted by daily flows of data, policy announcements, and earnings, breadth can sometimes help investors get at least a sense of developing trends or changes.
For instance, in the chart above, exceedingly weak breadth in early April when the SPX fell to a 15-month low alerted participants that nearly every stock in the index was below its near-term average. This didn't necessarily mean the sell-off was over, but breadth under 10%, as it was at the time, can hint that a dive in the market has become overdone.
"If you notice that breadth has become extremely shallow in a downturn, it can show exhaustion on the selling side," Mazzola said.
On the other hand, "When you see the market go up and breadth is dissipating, that can be an inflection point," Mazzola added. "Weak breadth could give you caution against a sustained rally when you see only a small group of stocks lean that way. In 2023, we saw that a rally like that can be sustained—until some catalyst hits."
A similar development happened in mid-2024 when the Magnificent Seven almost single-handedly took the entire market down double-digits. The catalyst this time was investor worries that the "yen-carry trade"—in which participants borrowed cheap Japanese yen to buy U.S. tech stocks—might break down due to rising rates in Japan. "A few stocks led the rally, and they were buttressed by the carry trade," Mazzola said. When they broke down, so did a market that had rallied amid weak breadth. If the rally had enjoyed wider breadth, a breakdown in the top stocks might not have meant such dramatic drops in the major indexes.
Strong market breadth, on the other hand, can suggest the rally potentially has widespread support and may be sustainable longer.
"When the market is setting new highs every day and breadth complements that, say, with 80% of the market participating, that makes me feel more comfortable in the strength of the rally," Mazzola said.
Which breadth period to watch
Those who regularly trade often focus on stocks trading above their 50-day moving average because this gives a nearer-term look at trends. But long-term investors who focus on longer holding periods should consider longer-term trends like the 200-day average.
With a little more than 20 trading days in a typical month, the 200-day gives investors a sense of action over a roughly 10-month period, long enough to smooth out some of the short-term fluctuations and get a broader view of where people are putting their money.
Narrowing the focus: Sector watch
While media and analysts often discuss breadth in terms of major indexes, the less-examined sector breadth numbers can also provide clues into market trends.
For instance, after the market dove in early April 2025 amid concerns about U.S. trade policy, the sectors that led Wall Street back by mid-May were several associated with the Magnificent Seven. By late May, 86% of info tech stocks were trading above their 50-day moving averages, which probably wasn't a big surprise to anyone watching the rally.
But peeling things back, investors could learn more about where bullish sentiment lay by checking breadth of several less-prominent sectors that also participated in the rally. By late May, 85% of industrial stocks and 81% of financial stocks were also above their 50-day moving averages.
"Leading us out of the April lows was info tech, but industrials followed pretty closely," Mazzola said. This indicated the rally wasn't simply a comeback executed by those seeking protection in highly capitalized Magnificent Seven stocks that had led the market out of previous depths. Instead, it pointed to broader positive sentiment across sectors that often do better when the economy improves, meaning the rally rested on hopes for improved economic growth and could have stronger legs.
Breadth can also help participants decide if they want to consider dipping their toes into a certain sector. For instance, after the broad market rallied 20% in one month from its April 2025 post-tariff lows, the utilities sector still featured just 26% of its shares above their 50-day averages. This indicated that for whatever reason, utilities weren't participating. A contrarian might see that as a buy signal, but "if you buy unloved companies, you're going against the trend," Mazzola warned.
Drawbacks to the market breadth indicator
Investors should understand that breadth can be misleading at times and not lean on it as their only signal for market decisions.
For instance, when the Nasdaq Composite® ($COMP) rallied sharply after the April 2025 lows, only 55% of its shares traded above their 50-day moving averages. The index itself got pulled up by heavily capitalized Magnificent Seven names, which exert an influence well beyond any other shares. Nasdaq has a large biotech component, and that subsector didn't draw the same enthusiasm as tech on the way back up. Checking the Nasdaq's breadth at that point might have caused investors to think there was less enthusiasm in Nasdaq than was the case, considering for the most part tech stocks are more highly capitalized than biotech.
And like any technical signal, breadth isn't something investors can look at in a vacuum. It helps to monitor other technical metrics like the Relative Strength Index (RSI), a momentum signal, to see if climbing or falling breadth is echoed in other indicators. Falling RSI accompanying rising breadth might alert investors that contrary signals exist, meaning it could be time to check more market indicators before making any decisions based on breadth alone. Generally, an RSI below 30 may indicate a stock or index is oversold and could soon rebound, while an RSI above 70 can signal a stock or index is overbought.
Another danger of relying too much on breadth is that it can blind an investor to other indicators or trends. There's no iron-clad rule that when 80% of stocks trade above their 50-day average, the market is overbought and needs to fall. It may appear that way, but wide breadth could easily reflect other factors. In a similar way, breadth can remain low for months if the Federal Reserve is rapidly raising rates or the economy is in recession. It's not a flawless signal that things are about to change.
Checking more than one breadth indicator can help investors get a better sense of the big picture. For instance, if 80% of S&P 500 stocks trade above their 50-day moving averages, that's all well and good, but maybe it's also worth checking whether declining shares have started to outpace advancers the last few sessions.
If so, it might indicate something's changing, just as a doctor might find your blood pressure looks fine but your cholesterol has crept up. One reading in your medical checkup doesn't always provide the all-clear. The same is true of the markets.
A message from Advisor Perspectives and VettaFi: To learn more about this and other topics, check out some of our webcasts.
The information provided here is for general informational purposes only and should not be considered an individualized recommendation or personalized investment advice. The investment strategies mentioned here may not be suitable for everyone. Each investor needs to review an investment strategy for his or her own particular situation before making any investment decision.
All expressions of opinion are subject to change without notice in reaction to shifting market conditions. Data contained herein from third-party providers is obtained from what are considered reliable sources. However, its accuracy, completeness, or reliability cannot be guaranteed.
Examples provided are for illustrative purposes only and not intended to be reflective of results you can expect to achieve.
Supporting documentation for any claims or statistical information is available upon request.
Past performance is no guarantee of future results, and the opinions presented cannot be viewed as an indicator of future performance.
Investing involves risk, including loss of principal.
The Charles Schwab Corporation provides a full range of brokerage, banking and financial advisory services through its operating subsidiaries. Its broker-dealer subsidiary, Charles Schwab & Co. Inc. (Member SIPC), and its affiliates offer investment services and products. Its banking subsidiary, Charles Schwab Bank, SSB (member FDIC and an Equal Housing Lender), provides deposit and lending services and products.
This site is designed for U.S. residents. Non-U.S. residents are subject to country-specific restrictions. Learn more about our services for non-U.S. residents, Charles Schwab Hong Kong clients, Charles Schwab U.K. clients.
© 2025 Charles Schwab & Co., Inc. All rights reserved. Member SIPC. Unauthorized access is prohibited. Usage will be monitored.
© Charles Schwab
Read more commentaries by Charles Schwab