Good Times Bad Times: 2025's Leadership Shifts
Membership required
Membership is now required to use this feature. To learn more:
View Membership BenefitsThe bull charges on amid an uneven news flow. Perhaps the move by U.S. stocks off the early-April lows is emblematic of the age-old adage about bull markets often climbing a "wall of worry." As shown below, year-to-date gains are subdued, but nonetheless positive. However, since the April 8th closing low for the S&P 500, all major U.S. indexes are up by hefty double-digit percentages. Per the index maximum drawdown column, the route to the April 8th closing low from the prior high on February 19th was not fun. The Nasdaq and Russell 2000 indexes hit bear market level declines (defined as a peak-to-trough drop of at least 20%), while the S&P 500 was saved from the same fate courtesy of the epic reversal day on April 9th (during that day's intraday low, the S&P 500 had dropped into bear market territory).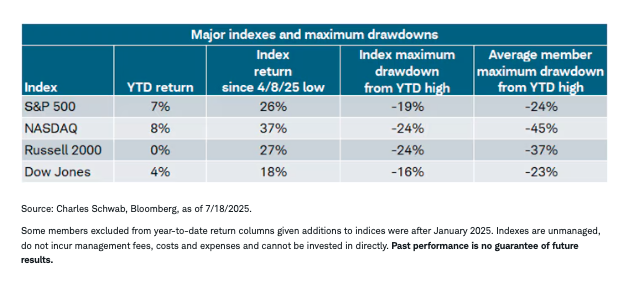
As shown in the far-right column above, at the average member level, a different story is told, especially for the Nasdaq. At the index level, the S&P 500 was down 19% at its low point, while at the average member level, the maximum drawdown has been -24%. In the case of the Nasdaq, it was down 24% at its low point, while at the average member level, the maximum drawdown has been a much more severe -45%.
Style tips
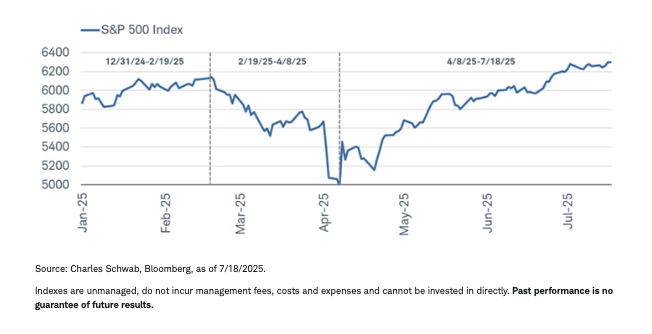
It's interesting to break this year down into its three distinct phases: year-to-date, between the prior high on February 19th and the closing low on April 8th, and since April 8th; highlighted in the S&P 500 chart below.
Market's tale of three phases

What a difference a phase makes. As shown in the table below, between February 19th and April 8th, growth indexes had bear market level declines of more than -20%, with large cap value faring better. Since then, growth indexes have soared, with value indexes lagging behind—especially large cap value.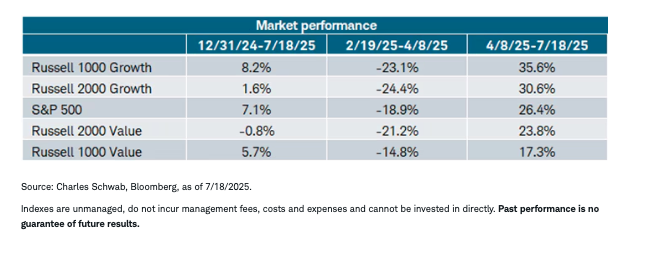
Sector swings
Another place to observe dramatic shifts in performance from phase to phase is at the sector level. As shown below, the "growth trio" of sectors—Technology, Communication Services, and Consumer Discretionary—all had bear market level declines between February 19th and April 8th. Technology has had the most impressive rebound, not far from a 50% gain off the low, but not enough to bring its year-to-date performance into the lead. That place is now held by the Industrials sector.
We continue to have a sector neutral sector recommendation in light of not only these dramatic shifts in performance, but also due to extreme policy-related instability, especially on the tariff front. Once at least some of that policy-related uncertainty eases, we will shift back to providing outperform and underperform sector recommendations.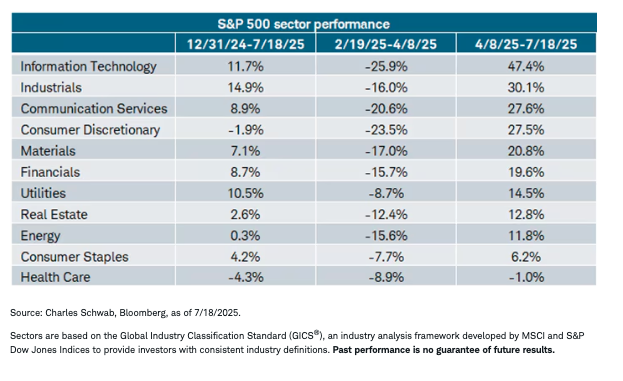
Disciplines
These dramatic style and sector shifts emphasize the benefits of disciplines around diversification—both among and within asset classes—and periodic rebalancing. We have been recommending, for investors with the flexibility, to consider portfolio- (or volatility-) based rebalancing vs. calendar-based rebalancing. What is perhaps most interesting about areas of strength and weakness at the sector level since the April 8th closing low is the cyclical bias of the sectors in the lead. The stock market has been sending a clear message about economic resilience. So far, so good; but the full story is more nuanced.
Not without budding risks
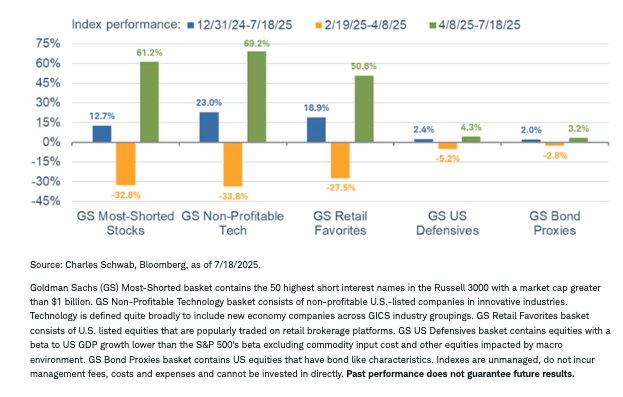
This year's maximum drawdown, rebound, and overall move higher have all had some markings of speculative fervor. As shown in the chart below, the biggest swings have been in the riskiest corners of the market—not least being heavily shorted stocks, non-profitable tech stocks, and companies most favored by retail traders. From the February 19th peak to the S&P 500's April 8th low, those segments of the market experienced severe drawdowns—all worse than the S&P 500. Conversely, defensives and bond proxies outperformed, barely registering any meaningful losses (fulfilling their intended purpose during corrections and bear markets).
However, the subsequent rebounds for the speculative baskets have been equally extreme, with non-profitable tech stocks leading the way. Their rally has been strong enough to push their year-to-date gains far above the S&P 500's. The magnitude of these moves is looking similar to the early days of the 2020-2021 bull market, during which speculation was running rampant and risky, arcane parts of the market were gaining significant ground relative to the S&P 500.
Risky is all the rage this year
That isn't entirely comforting given the fact that said bull market was short-lived. However, using that cycle as a guide is not entirely helpful for a host of reasons—not least being the different economic backdrop in which we find ourselves. We'd have to see further, significant gains from here and a meaningful deterioration in breadth for a 2022-like repeat to occur; not to mention the fact that 2022's bear market was reflective of the COVID-19-related surge in inflation and the Federal Reserve's aggressive tightening campaign.
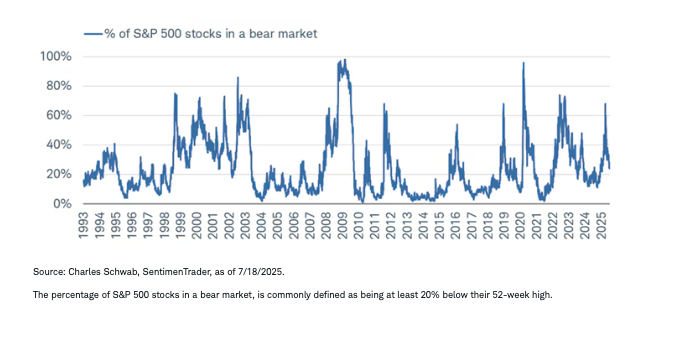
As of now, breadth is holding up and, if anything, improving. As shown in the chart below, the percentage of S&P 500 stocks in a bear market has been declining sharply. By early April, the count spiked to a level consistent with prior corrections and bear markets; it's still above 20% but has been trending in the right direction. This isn't to say that the market's ascent doesn't face upcoming challenges; but for now, the trend for most names in the S&P 500 is indicative of a healthier backdrop.
Bears going into hiding
In sum
There is no shortage of things to worry about; but that's the wall markets often climb. Broad leadership—especially among cyclical segments of the market—suggests a resilient economy, but policy-related instability remains a risk. Narrower leadership shows retail traders are dominating market action but be mindful of the lower-quality nature to what's been outperforming. We continue to recommend staying up in quality, alongside maintaining traditional disciplines around diversification and periodic rebalancing.
A message from Advisor Perspectives and VettaFi: To learn more about this and other topics, check out some of our webcasts.
The information provided here is for general informational purposes only and should not be considered an individualized recommendation or personalized investment advice. The investment strategies mentioned here may not be suitable for everyone. Each investor needs to review an investment strategy for his or her own particular situation before making any investment decision.
All expressions of opinion are subject to change without notice in reaction to shifting market conditions. Data contained herein from third-party providers is obtained from what are considered reliable sources. However, its accuracy, completeness or reliability cannot be guaranteed. Examples provided are for illustrative purposes only and not intended to be reflective of results you can expect to achieve.
Past performance is no guarantee of future results, and the opinions presented cannot be viewed as an indicator of future performance.
Investing involves risk, including loss of principal.
The policy analysis provided by the Charles Schwab & Co., Inc., does not constitute and should not be interpreted as an endorsement of any political party.
Performance may be affected by risks associated with non-diversification, including investments in specific countries or sectors. Additional risks may also include, but are not limited to, investments in foreign securities, especially emerging markets, real estate investment trusts (REITs), fixed income, municipal securities including state specific municipal securities, small capitalization securities and commodities. Each individual investor should consider these risks carefully before investing in a particular security or strategy.
All corporate names and market data shown above are for illustrative purposes only and are not a recommendation, offer to sell, or a solicitation of an offer to buy any security.
Diversification and asset allocation strategies do not ensure a profit and do not protect against losses in declining markets.
Rebalancing does not protect against losses or guarantee that an investor's goal will be met. Rebalancing may cause investors to incur transaction costs and, when a non-retirement account is rebalanced, taxable events may be created that may affect your tax liability.
Schwab does not recommend the use of technical analysis as a sole means of investment research.
Source: Bloomberg Index Services Limited. BLOOMBERG® is a trademark and service mark of Bloomberg Finance L.P. and its affiliates (collectively "Bloomberg"). Bloomberg or Bloomberg's licensors own all proprietary rights in the Bloomberg Indices. Neither Bloomberg nor Bloomberg's licensors approves or endorses this material or guarantees the accuracy or completeness of any information herein, or makes any warranty, express or implied, as to the results to be obtained therefrom and, to the maximum extent allowed by law, neither shall have any liability or responsibility for injury or damages arising in connection therewith.
Indexes are unmanaged, do not incur management fees, costs, and expenses, and cannot be invested in directly. For additional information, please see schwab.com/indexdefinitions.
Beta is a measurement of the price volatility of a stock or other asset relative to the market as a whole. Higher volatility means higher risk.
Investment and Insurance Products Are: Not FDIC Insured • Not Insured by Any Federal Government Agency • Not a Deposit or Other Obligation of, or Guaranteed by, the Bank or any of its Affiliates • Subject to Investment Risks, Including Possible Loss of Principal Amount Invested
The Charles Schwab Corporation provides a full range of brokerage, banking and financial advisory services through its operating subsidiaries. Its broker-dealer subsidiary, Charles Schwab & Co. Inc. (Member SIPC), and its affiliates offer investment services and products. Its banking subsidiary, Charles Schwab Bank, SSB (member FDIC and an Equal Housing Lender), provides deposit and lending services and products.
This site is designed for U.S. residents. Non-U.S. residents are subject to country-specific restrictions. Learn more about our services for non-U.S. residents, Charles Schwab Hong Kong clients, Charles Schwab U.K. clients.
© 2025 Charles Schwab & Co., Inc. All rights reserved. Member SIPC. Unauthorized access is prohibited. Usage will be monitored.
Membership required
Membership is now required to use this feature. To learn more:
View Membership BenefitsSponsored Content
Upcoming Virtual Events View All


