September has historically been the most difficult month for US stocks.
However, September’s troubles have historically been followed by stronger markets through the new year.
Our current fundamental and technical read on the market this autumn remains constructive.
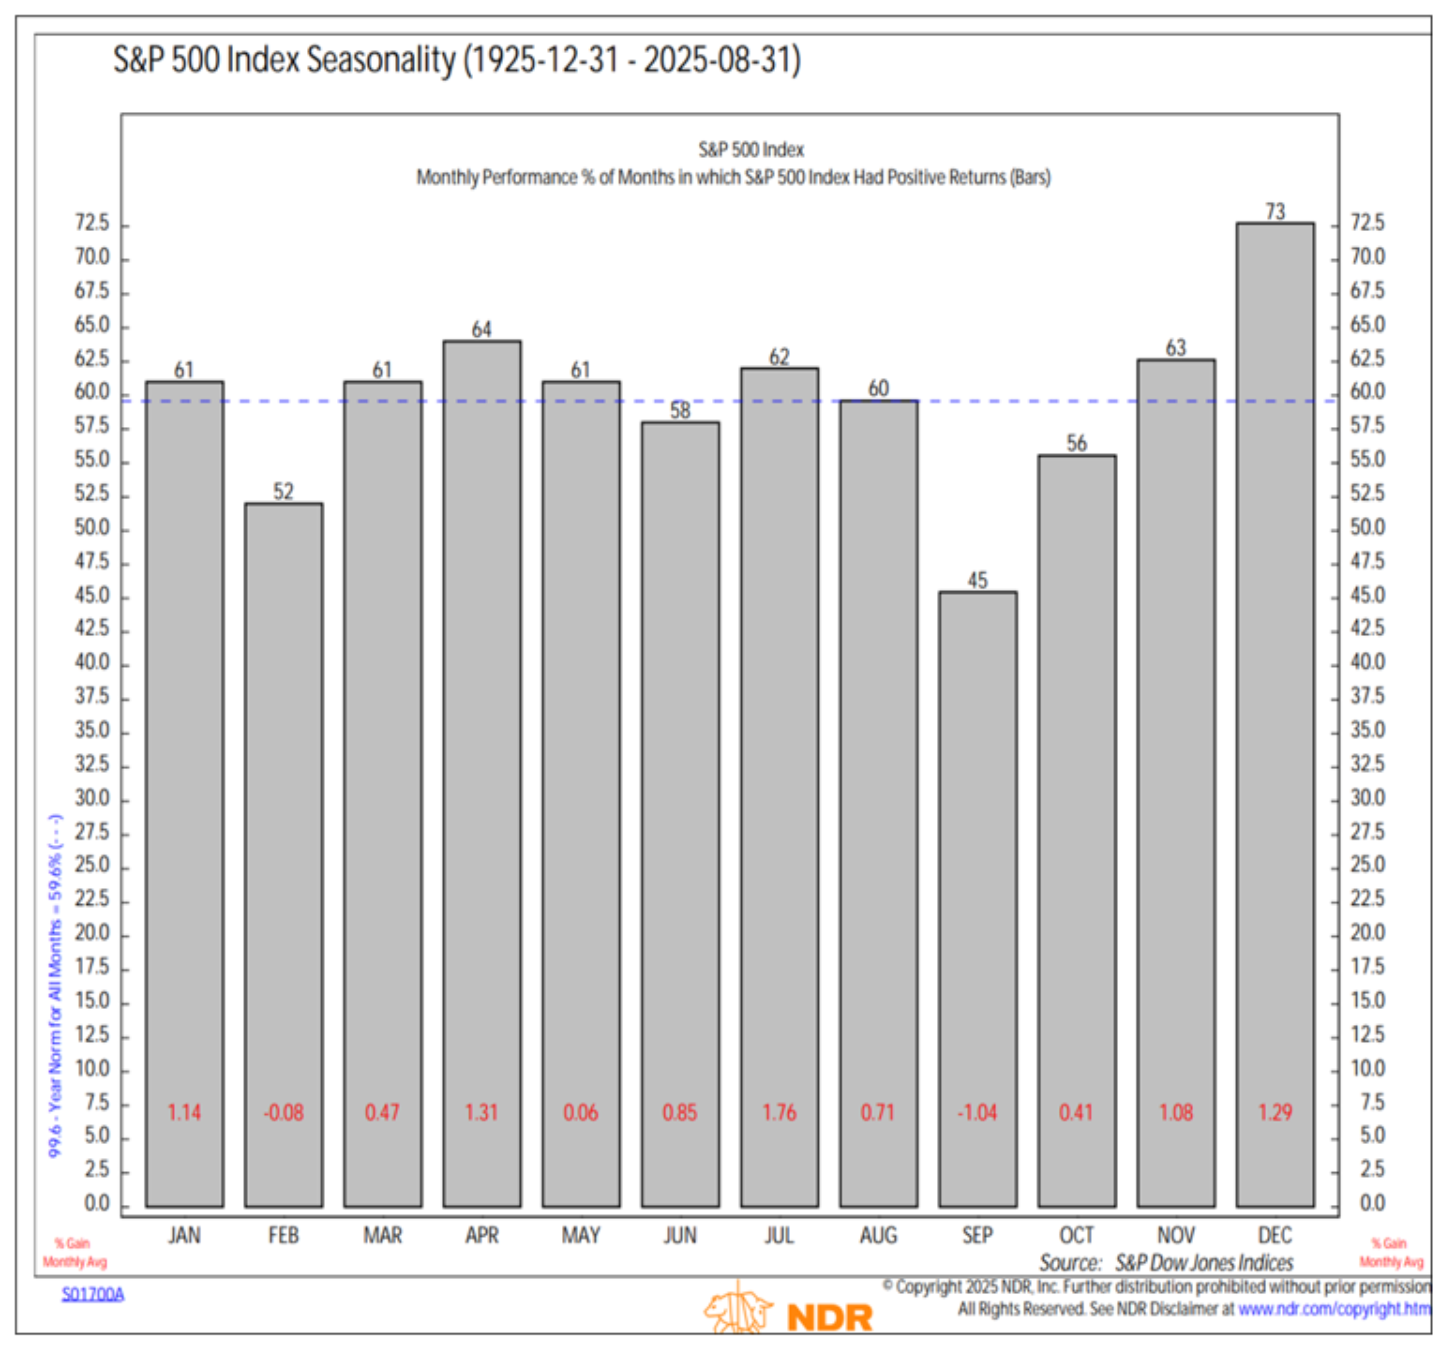
We’ve received many client questions about seasonality in stocks, and specifically about the ‘September Effect’. This is the theory that investors should sell their stocks after Labor Day to avoid autumn volatility. September does appear to be a statistical anomaly, as it is by far the worst month for stock returns over the past century (see Chart 1 below, courtesy of NDR Research). However, we do not believe investors should sell indiscriminately just because of this heuristic.
Several theories attempt to explain September’s historical underperformance. One idea is that institutional investors return from vacation and begin “window dressing,” or selling underperforming stocks before year-end reporting. The September/October period also tends to be an information vacuum after second quarter earnings season. This void is often filled with ‘FUD’ (fear, uncertainty, and doubt). Investors have plenty of FUD this year, with concerns around the economic impact of tariffs and Fed policy.
CHART 1: September Historically Worst Month…But Oct-Jan Strong
Copyright 2025 Ned Davis Research, Inc. Further distribution prohibited without prior permission. All Rights Reserved. See NDR Disclaimer at ndr.com/copyright.html. For data vendor disclaimers refer to ndr.com/vendorinfo/. Past performance is no guarantee of future results. Chart shown for illustrative purposes.
So, if September is truly an anomaly, why not simply exploit it by selling? Because trying to ‘time’ the stock market is often an exercise in futility, in our view. In September, stocks were still up almost half the time since 1925, rendering the ‘September Effect’ practically a coin flip. Selling in the fall could leave investors vulnerable to getting ‘whipsawed’ by significant market rebounds, particularly since October often marks significant market bottoms and returns from November through January tend to be stronger than average. Furthermore, timing strategies could lead to higher portfolio turnover and potential for trade errors, as well as a more complicated, stressful process for investors.
Time in the Market… Not Timing the Market
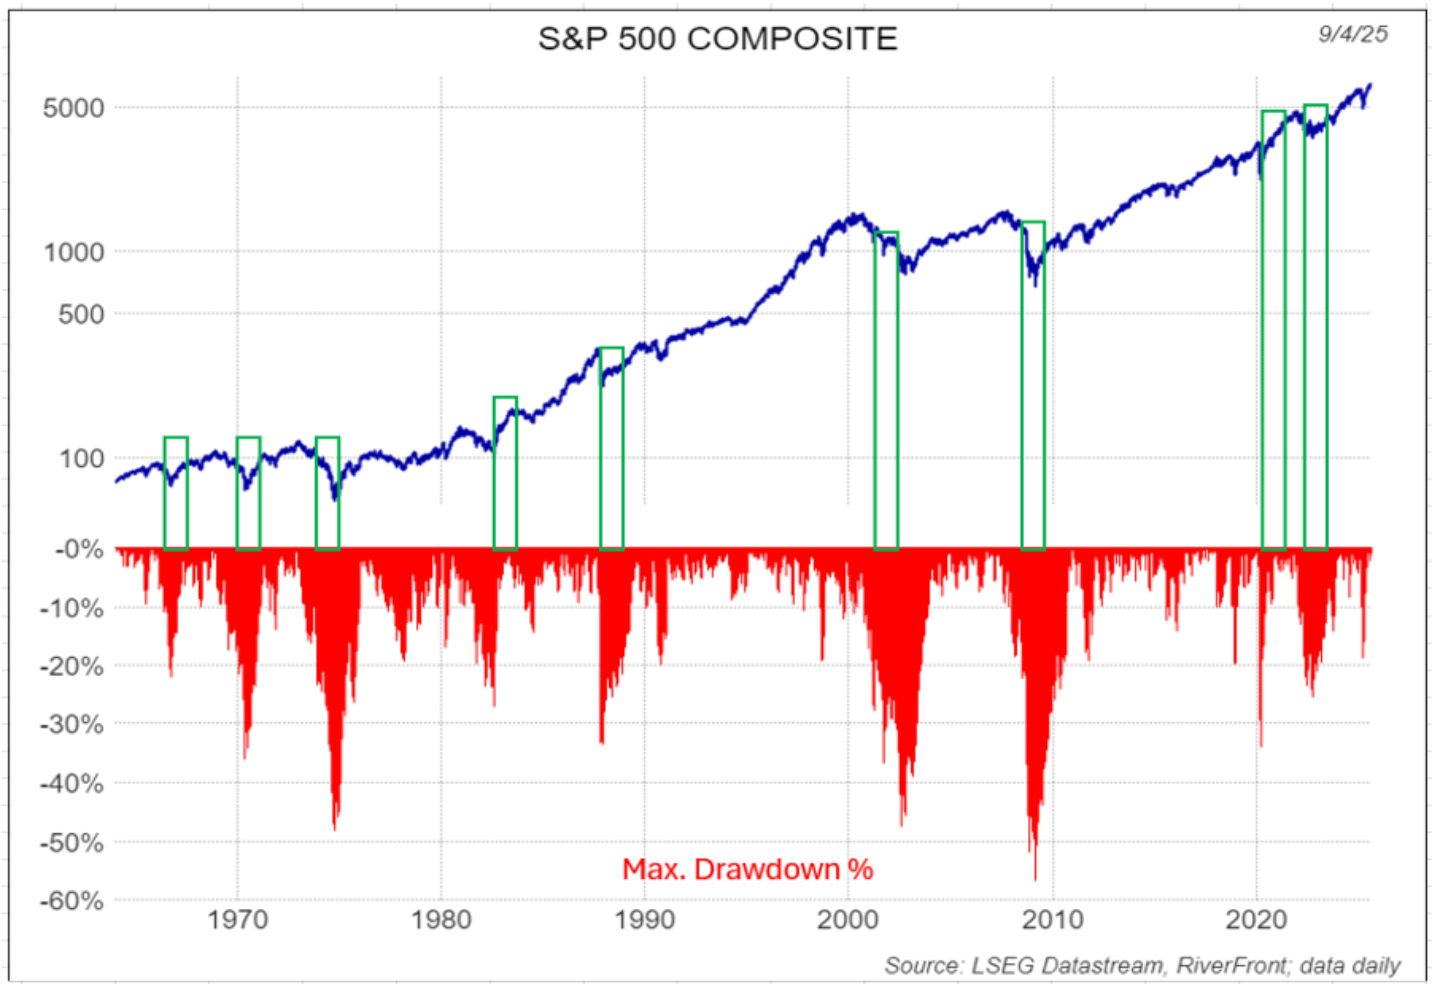
We subscribe to the old saying, “investment success isn’t in timing the market… but rather time IN the market.” Staying invested, even when (or especially when) things seem scary, tends to be the best long-term strategy in our view. Historically, after peak-to-trough drawdowns of over -20% (i.e., bear markets), stocks have usually been significantly higher twelve months later, by an average of double digits (see highlighted green bars on Chart 2, below). This suggests to us that an investor’s biggest mistake is NOT failing to avoid a downdraft… but rather, failing to participate in the subsequent upside recovery. For these reasons, we believe using simple heuristics like the ‘September Effect’ are fraught with peril and should be approached with trepidation.
Conclusion: We View Market Fundamentals and Technicals as Constructive, Outweighing the ‘September Effect’
Regardless of the volatile nature of autumn, not all Septembers are created equal. As we have laid out in recent Weekly Views, we view the US economy as remaining on track, Fed independence should be maintained, and we expect some rate cuts between now and the end of the year. All of this creates a backdrop generally conducive to further stock gains through year end, in our view. We also believe that US ‘Economic Exceptionalism’ is not dead, as corporate America has adjusted well to the headwinds that have appeared this year, posting strong earnings growth year-over-year in the second quarter.
CHART 2: Stocks Historically Rebound After -20%+ Drawdowns…Making Timing Tough
Source: LSEG Datastream, RiverFront. Data daily as of September 4, 2025. Chart shown for illustrative purposes. Past performance is no guarantee of future results.
The technical backdrop of the US stock market is supportive of further appreciation in our opinion. As we wrote about in our last ‘3 Rules’ Weekly View, the trend on the S&P 500, which we define as the 200-day moving average (DMA), has perked up as the technology sector has led the index to set a series of new all-time highs. Currently, the trend is rising at a 14% annualized rate; if history is any guide, we believe this condition should bode well for stock returns over the next 3 to 6 months, even with investor sentiment near optimistic extremes.
This optimism is reflected across our balanced portfolios, as the portfolios are currently overweight US stock exposure. Given the volatile nature of September, we are watching both fundamentals and technical levels closely, and will act if our risk management processes deem it necessary. However, we will approach such decisions with the appropriate level of humility about our (or anyone’s) ability to perfectly time these tactical moves…and as always, we will also formulate a reinvestment plan concurrent to any risk reduction plan implemented.
All investments in securities, including the strategies discussed above, include a risk of loss of principal (invested amount) and any profits that have not been realized. Markets fluctuate substantially over time, and have experienced increased volatility in recent years due to global and domestic economic events. Performance of any investment is not guaranteed. In a rising interest rate environment, the value of fixed-income securities generally declines. Diversification does not guarantee a profit or protect against a loss. Investments in international and emerging markets securities include exposure to risks such as currency fluctuations, foreign taxes and regulations, and the potential for illiquid markets and political instability. Please see the end of this publication for more disclosures.
Important Disclosure Information:
The comments above refer generally to financial markets and not RiverFront portfolios or any related performance. Opinions expressed are current as of the date shown and are subject to change. Past performance is not indicative of future results and diversification does not ensure a profit or protect against loss. All investments carry some level of risk, including loss of principal. An investment cannot be made directly in an index.
Information or data shown or used in this material was received from sources believed to be reliable, but accuracy is not guaranteed.
This report does not provide recipients with information or advice that is sufficient on which to base an investment decision. This report does not take into account the specific investment objectives, financial situation or need of any particular client and may not be suitable for all types of investors. Recipients should consider the contents of this report as a single factor in making an investment decision. Additional fundamental and other analyses would be required to make an investment decision about any individual security identified in this report.
Chartered Financial Analyst is a professional designation given by the CFA Institute (formerly AIMR) that measures the competence and integrity of financial analysts. Candidates are required to pass three levels of exams covering areas such as accounting, economics, ethics, money management and security analysis. Four years of investment/financial career experience are required before one can become a CFA charterholder. Enrollees in the program must hold a bachelor’s degree.
All charts shown for illustrative purposes only. Technical analysis is based on the study of historical price movements and past trend patterns. There are no assurances that movements or trends can or will be duplicated in the future.
Ned Davis Research (NDR) is a global provider of independent investment research, solutions and tools. Founded in 1980, NDR helps clients around the world make objective investment decisions.
Stocks represent partial ownership of a corporation. If the corporation does well, its value increases, and investors share in the appreciation. However, if it goes bankrupt, or performs poorly, investors can lose their entire initial investment (i.e., the stock price can go to zero). Bonds represent a loan made by an investor to a corporation or government. As such, the investor gets a guaranteed interest rate for a specific period of time and expects to get their original investment back at the end of that time period, along with the interest earned. Investment risk is repayment of the principal (amount invested). In the event of a bankruptcy or other corporate disruption, bonds are senior to stocks. Investors should be aware of these differences prior to investing.
In general, the bond market is volatile, and fixed income securities carry interest rate risk. (As interest rates rise, bond prices usually fall, and vice versa). This effect is usually more pronounced for longer-term securities). Fixed income securities also carry inflation risk, liquidity risk, call risk and credit and default risks for both issuers and counterparties. Lower-quality fixed income securities involve greater risk of default or price changes due to potential changes in the credit quality of the issuer. Foreign investments involve greater risks than U.S. investments, and can decline significantly in response to adverse issuer, political, regulatory, market, and economic risks. Any fixed-income security sold or redeemed prior to maturity may be subject to loss.
Technology and internet-related stocks, especially of smaller, less-seasoned companies, tend to be more volatile than the overall market.
Index Definitions:
Standard & Poor’s (S&P) 500 Index measures the performance of 500 large cap stocks, which together represent about 80% of the total US equities market.
Definitions:
The September Effect refers to the historically weak stock market returns observed during the month of September. In fact, September has been the worst performing month, on average, going back nearly a century.
Whipsaw describes the movement of a security when, at a particular time, the security’s price is moving in one direction but then quickly pivots to move in the opposite direction.
The 200-day moving average is a popular technical indicator which investors use to analyze price trends. It is simply a security’s average closing price over the last 200 days.
When referring to being “overweight” or “underweight” relative to a market or asset class, RiverFront is referring to our current portfolios’ weightings compared to the composite benchmarks for each portfolio. Asset class weighting discussion refers to our Advantage portfolios. For more information on our other portfolios, please visit riverfrontig.com or contact your Financial Advisor.
RiverFront Investment Group, LLC (“RiverFront”), is a registered investment adviser with the Securities and Exchange Commission. Registration as an investment adviser does not imply any level of skill or expertise. Any discussion of specific securities is provided for informational purposes only and should not be deemed as investment advice or a recommendation to buy or sell any individual security mentioned. RiverFront is affiliated with Robert W. Baird & Co. Incorporated (“Baird”), member FINRA/SIPC, from its minority ownership interest in RiverFront. RiverFront is owned primarily by its employees through RiverFront Investment Holding Group, LLC, the holding company for RiverFront. Baird Financial Corporation (BFC) is a minority owner of RiverFront Investment Holding Group, LLC and therefore an indirect owner of RiverFront. BFC is the parent company of Robert W. Baird & Co. Incorporated, a registered broker/dealer and investment adviser.
A message from Advisor Perspectives and VettaFi: Stay ahead of market changes with our daily updates on key market and economic indicators. Visit the AP Charts and Analysis site for our expert insights.