Charting Market Views on Interest Rates
Membership required
Membership is now required to use this feature. To learn more:
View Membership BenefitsMonetary policy walks the inflation tightrope
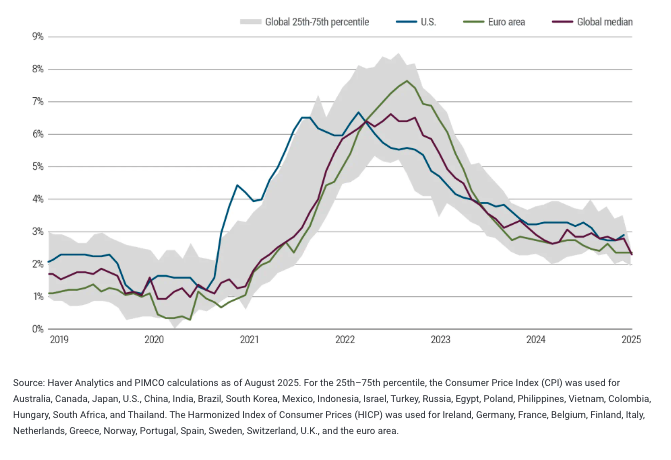
The balance of risks to the Federal Reserve’s dual mandate (price stability and maximum employment) prompted the central bank to lower its policy rate in September in an effort to bolster the economy and employment. However, U.S. inflation remains above the Fed’s target and is elevated relative to global peers.
We expect additional rate cuts, but not down to the near-zero levels that could rekindle high inflation. Well-anchored inflation expectations likely inform Fed decisions at least as much as current prices and recent trends do. Thus far, tariff-related price pressures do not appear to have significantly affected inflation expectations.
Global core CPI inflation
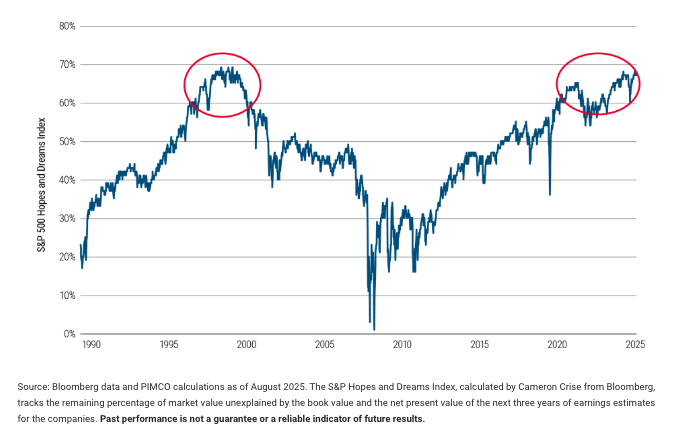
Bullish sentiment has returned to equity markets after a tariff-related dip: Stock prices don’t signal recession, but how much of this is froth?
Indeed, the U.S. equity market has remained both buoyant and bullish, but how much of this is froth?
Nearly 70% of the value of the S&P 500 Index is not represented by those companies’ book value or their earnings forecasts for next three years. This seems to reflect a great deal of trust in the overall strength of large U.S. companies.
This measure dipped in early 2025 following tariff-related turbulence but has since risen back near the exuberant level reached in November 2024 after the U.S. election – and prior to that, in the late 1990s tech bubble.
Percentage of S&P value not represented by book value and next 3 years’ earnings expectations
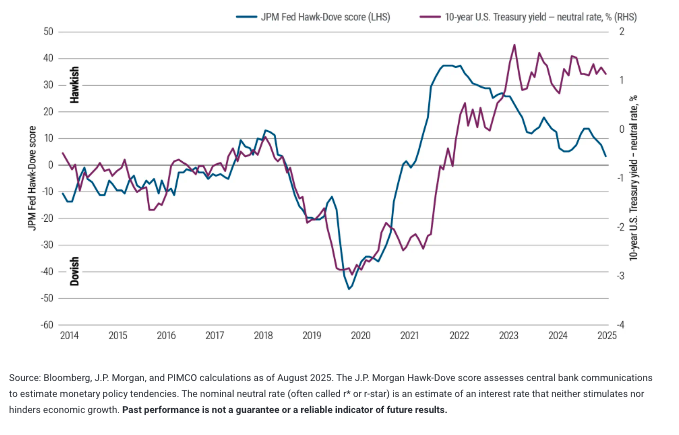
Market pricing reflects expectations for long-term uncertainty
But while stock markets appear optimistic and inflation expectations seem stable for now, the J.P. Morgan Hawk-Dove score suggests some wariness among bond investors. The difference between 10-year U.S. Treasury yields and the nominal neutral rate has risen above the levels signaled in Fed communications. This gap suggests the market is pricing in more risk for the long term.
This could put upward pressure on long-term interest rates. It also signals elevated uncertainty about future inflation and growth.
Fedspeak vs. the gap between 10-year U.S. Treasuries and the neutral rate
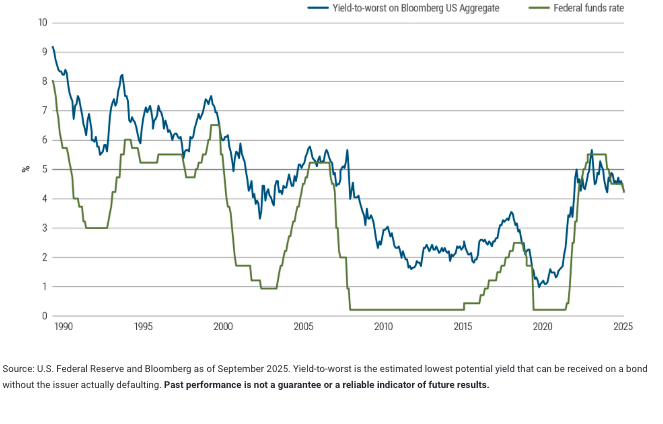
A long-term trend has reasserted itself: Benchmark US bond index yield exceeds the Fed policy rate
In late 2024, the Bloomberg US Aggregate Bond Index yield rose above the Fed’s policy rate for the first time in more than a year and has stayed there – emphasizing the compelling starting point for bonds now.
It was extraordinary to have a benchmark bond yield running below – sometimes well below – the policy rate. Prior to the pandemic, this had happened only four times in this century.
Fixed income offers an attractive opportunity with high starting yields. Historically, bonds have performed well across a range of different rate-cutting scenarios, and downward moves in bond yields have tended to follow cuts in the Fed policy rate.
Yield-to-worst on the Bloomberg US Aggregate Bond Index versus the fed funds rate

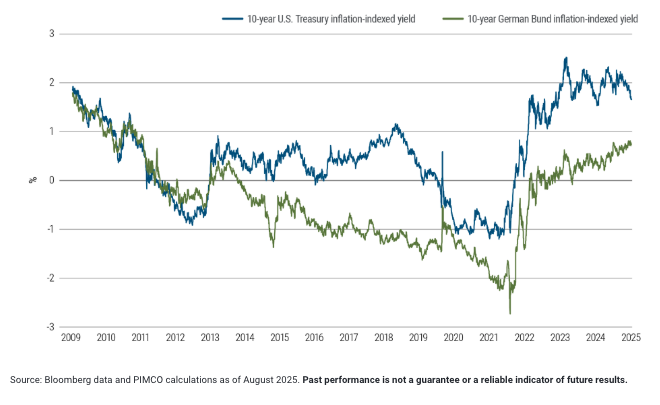
Market signals in German and U.S. inflation-linked bonds
Looking beyond the U.S., another long-term trend has returned during the post-pandemic recovery period: The yield on German 10-year inflation-indexed Bunds (or “linkers”) has remained in positive territory for nearly two years, after more than a decade below zero.
Linker yields still significantly lag the inflation-indexed yield on U.S. Treasury Inflation-Protected Securities (TIPS). TIPS yields have been hovering around 2% since 2023, but previously had been lower – even negative – in the low-inflation environment that followed the global financial crisis.
Higher inflation-indexed yields are another signal that fixed income may be an attractive, risk-aware investment in today’s uncertain macroeconomic environment.
Inflation-indexed yields on 10-year U.S. Treasuries and German Bunds
A message from Advisor Perspectives and VettaFi: Discover something new! Click here to register for our upcoming webcasts.
Past performance is not a guarantee or a reliable indicator of future results.
Investing in the bond market is subject to risks, including market, interest rate, issuer, credit, inflation risk, and liquidity risk. The value of most bonds and bond strategies are impacted by changes in interest rates. Bonds and bond strategies with longer durations tend to be more sensitive and volatile than those with shorter durations; bond prices generally fall as interest rates rise, and low interest rate environments increase this risk. Reductions in bond counterparty capacity may contribute to decreased market liquidity and increased price volatility. Bond investments may be worth more or less than the original cost when redeemed. Commodities contain heightened risk, including market, political, regulatory and natural conditions, and may not be appropriate for all investors.
Statements concerning financial market trends or portfolio strategies are based on current market conditions, which will fluctuate. There is no guarantee that these investment strategies will work under all market conditions or are appropriate for all investors and each investor should evaluate their ability to invest for the long term, especially during periods of downturn in the market. Outlook and strategies are subject to change without notice.
Performance results for certain charts and graphs may be limited by date ranges specified on those charts and graphs; different time periods may produce different results.
It is not possible to invest directly in an unmanaged index.
CPI, or Consumer Price Index, measures the average change over time in the prices paid by urban consumers for a market basket of consumer goods and services. The S&P Hopes and Dreams Index, calculated by Cameron Crise from Bloomberg, tracks the remaining percentage of market value unexplained by the book value and the net present value of the next three years of earnings estimates for the companies. The J.P. Morgan Hawk-Dove score assesses central bank communications to estimate monetary policy tendencies. The nominal neutral rate (often called r* or r-star) is an estimate of an interest rate that neither stimulates nor hinders economic growth. The Yield-to-Worst on the Bloomberg U.S. Aggregate Index represents the lowest potential yield an investor could receive on a bond from the index, without the bond defaulting. The 10-year U.S. Treasury inflation-indexed yield is a daily rate representing the real yield on Treasury Inflation-Protected Securities (TIPS) with a 10-year maturity. The 10-year German Bund inflation-indexed yield represents the real yield of Inflation-linked Federal bonds (ILB) with a 10-year maturity.
PIMCO as a general matter provides services to qualified institutions, financial intermediaries and institutional investors. Individual investors should contact their own financial professional to determine the most appropriate investment options for their financial situation. This material contains the opinions of the manager, and such opinions are subject to change without notice. This material has been distributed for informational purposes only and should not be considered as investment advice or a recommendation of any particular security, strategy or investment product. Information contained herein has been obtained from sources believed to be reliable, but not guaranteed. No part of this material may be reproduced in any form, or referred to in any other publication, without express written permission. PIMCO is a trademark of Allianz Asset Management of America LLC in the United States and throughout the world.
© PIMCO
Membership required
Membership is now required to use this feature. To learn more:
View Membership BenefitsSponsored Content
Upcoming Virtual Events View All