An Unsustainable Equilibrium
Membership required
Membership is now required to use this feature. To learn more:
View Membership Benefits
The S&P 500 stands at the most extreme level of valuations in history. As I detailed in August, our most reliable valuation measures – based on their relationship with actual subsequent S&P 500 total returns across a century of market history – suggest that the expectations of investors for long-term market returns are wildly misaligned with the returns implied by discounted cash flows.
The chart below shows our most reliable gauge of market valuations in data since 1928: the ratio of nonfinancial market capitalization to gross value-added (MarketCap/GVA). Gross value-added is the sum of corporate revenues generated incrementally at each stage of production, so MarketCap/GVA might be reasonably be viewed as an economy-wide, apples-to-apples price/revenue multiple for U.S. nonfinancial corporations.
To be clear – this is not a price chart. It’s a valuation chart. It aligns precisely with the happiest and most satisfying moment of a speculative bubble: the point where wildly misaligned expectations for market returns are being realized anyway – via self-fulfilling speculation. If you understand how a bubble works, this chart is both strikingly beautiful from a mathematical standpoint, yet utterly terrifying from an investment perspective.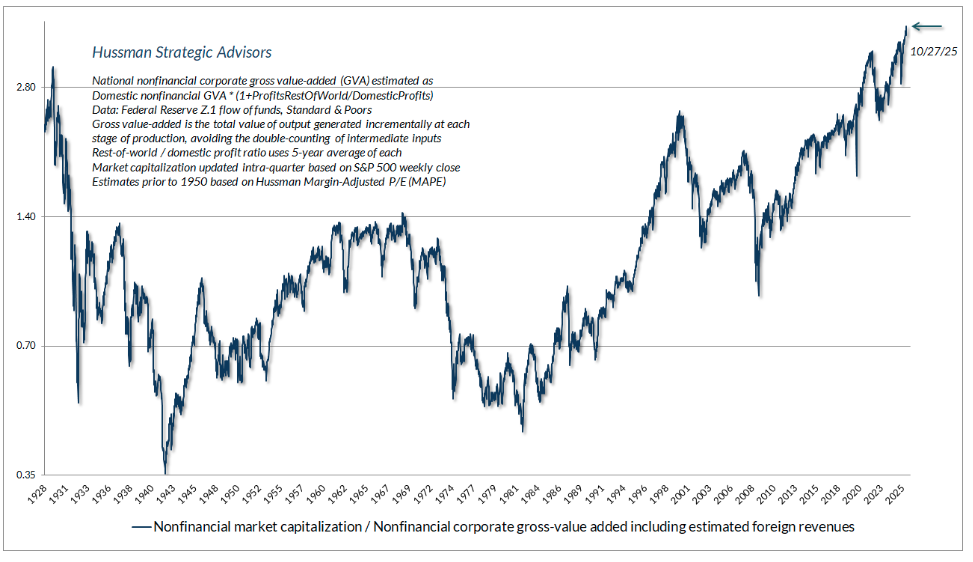
The scatterplot below shows this same measure versus actual subsequent 12-year average annual S&P 500 nominal total returns. Recall how “errors” work – since a bubble peak features valuations that are vastly beyond historical norms, the market returns during the 12-year period leading up to that bubble peak are also vastly beyond the returns one would have expected based on the starting valuations at that time.
As I’ve detailed in prior comments, these “errors” are informative. Large positive “errors” over the trailing 12-year period are associated with dismal market returns over the subsequent 12-year period. This reflects the fact that the end of the trailing period and the beginning of the future period is a bubble extreme.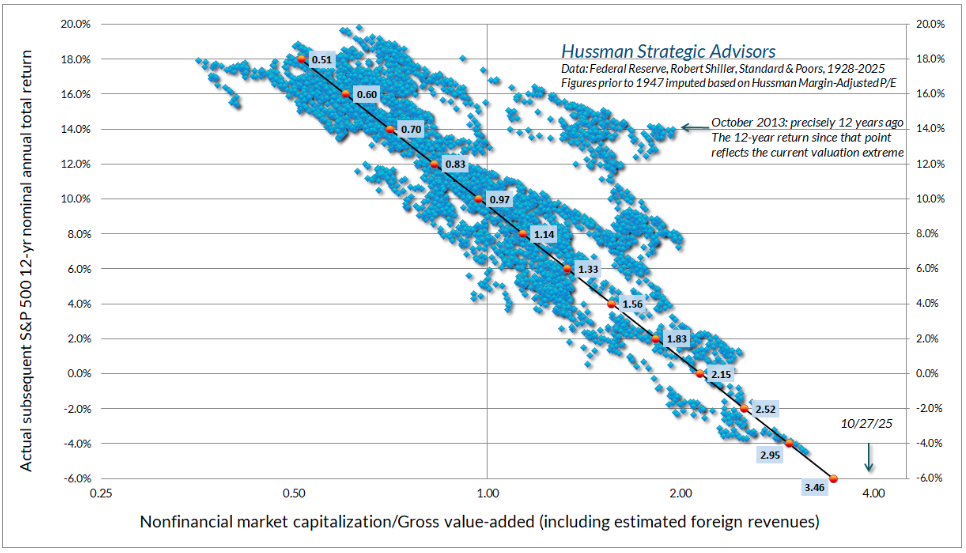
Just over a year ago, we introduced a hedging implementation that has already had a significant impact on our investment discipline, by allowing us to abandon any need for valuations to normalize. Frankly, I do expect the current speculative bubble to collapse, partly because history has always produced this outcome, and partly because I believe that investors have misconstrued the origin of the profits that they are celebrating with premium valuations. Still, nothing in our discipline requires the market to collapse, or to approach historical valuation norms ever again.
As I noted last year (see in particular the section titled “The Martian” in The Turtle and the Pendulum), I expect the adaptations of recent years – particularly that hedging implementation – will enable us to navigate and welcome any trajectory that valuations may take, provided only that the market fluctuates.
On that note, it’s worth observing that the S&P 500 has provided virtually none of that fluctuation during the past few months, even staying above its 50-day average for just over 120 trading sessions. That’s quite unusual, particularly given that our measures of market internals remain divergent, but it does help to reconcile the bit of discomfort that we’ve had in recent weeks.
To offer a sense of how unusual it is for the market to experience a diagonal move with so little fluctuation, the chart below shows points since 1957 when the S&P 500 has gone this length of time without breaching even its 50-day average, coupled with relatively bullish sentiment. In all prior cases, the market has experienced a quick 4-6% air-pocket within a couple of weeks. This time may be different. No forecasts are required. Markets fluctuate in both directions over time. That simple outcome is really all we rely on.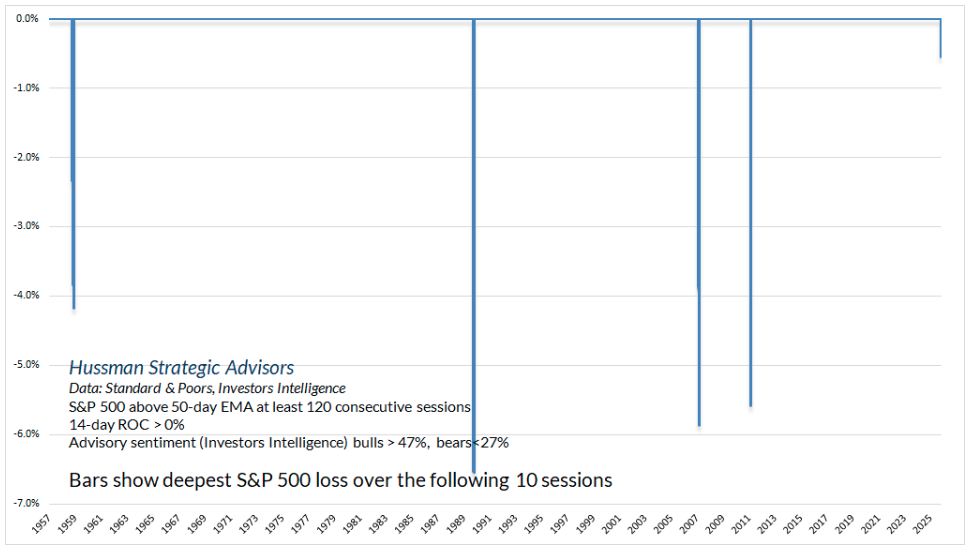
Suffice it to say that we remain enthusiastic about the implementations we’ve adopted in recent years. Yes, amid the most extreme valuations in the history of the U.S. financial markets, it’s difficult for a defensive position to gain traction if the market doesn’t even fluctuate against its 10-week average. But this too will pass. We certainly wouldn’t want to be on the other side of the position we’ve got – even over the next few weeks.
Profit-based valuation measures
As I’ll detail later in this comment, the corporate profitability that investors presently attribute to productivity and innovation is actually the accounting result of record government and household deficits. As we’ll see, innovation certainly affects the distribution of those profits, but maintaining this level of profitability, with nearly 90% of the benefit accruing to the wealthiest 10% of households, actually relies massive and sustained deficits in other sectors, which would eventually spell debt crisis and default.
Historically, corporate profits have fluctuated over time. When corporate profits are depressed, as they are during and just after recessions, price/earnings multiples typically soar – but these high P/E multiples have no bearish implications and are uninformative about future returns. Likewise, during economic booms, profit margins tend to be elevated. Normally, that results in seemingly normal-looking P/E ratios, but these P/E multiples are actually dangerous because they’re built on unsustainable earnings.
The worst case is when investors are paying extreme P/E multiples on record earnings, that in turn reflect record profit margins. This type of “double counting” has historically had tragic outcomes.
But let’s forget all that. Suppose one assumes that current profit margins are indeed permanent. In this case, the high profit margins result in high earnings – and assuming permanence – future cash flows will be proportional to those high earnings. So if you never expect profit margins to retreat, a price/earnings multiple is the correct valuation gauge.
I can’t tell you that history has preferred this measure, because it hasn’t. But if you believe profit margins are permanent, and you’re willing to take Wall Street’s optimistic estimates for year ahead “forward” earnings at face-value, then it’s fine to use the “forward operating P/E” of the S&P 500 as your measure.
Since the forward P/E didn’t actually exist prior to the 1980’s, historical data before that time is unavailable. Fortunately, there’s a tight (scaled) relationship with the Shiller cyclically-adjusted P/E, and since the current Shiller P/E reflects the elevated margins of the past decade, it’s ideal for comparative purposes. Even on this basis – assuming current profit margins are permanent – market valuations are beyond 1929 levels, and rival the most extreme peaks in U.S. history.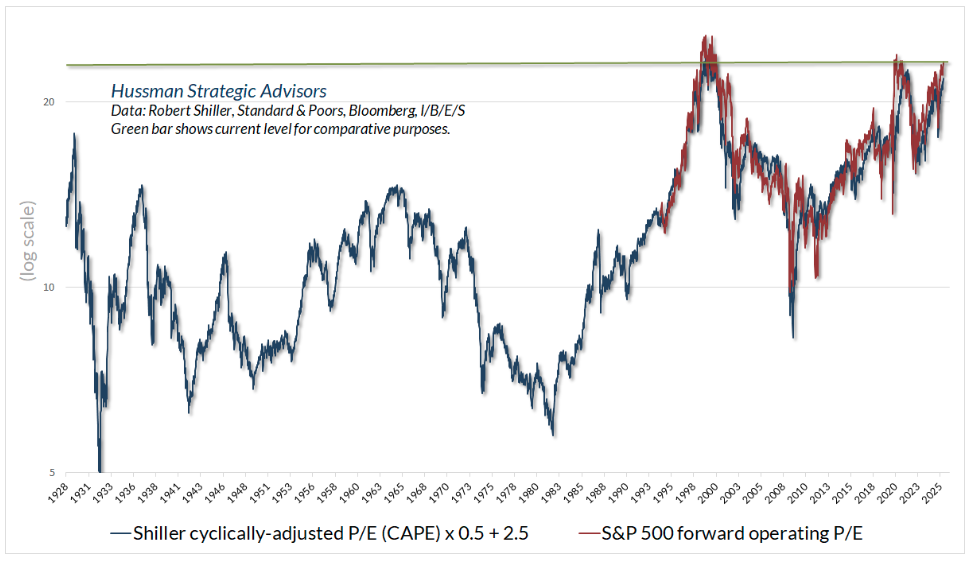
So then what do you do to justify valuations? You create a new measure. Indeed, you know it’s a bubble by the math Wall Street uses in these situations. Remember “price-to-eyeballs” during the dot-com bubble? It happens every time. They start dividing prices by things that don’t link up with cash flows. It’s a sign you’re not in Kansas anymore.
The following chart appeared in Bloomberg Opinion a few weeks ago.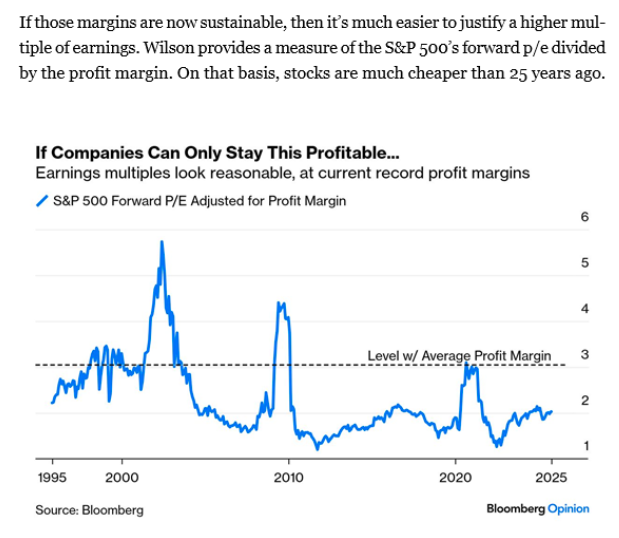
Now, let’s think about this measure from the standpoint of deliverable cash flows. Every reliable valuation ratio is just shorthand for a proper discounted cash flow analysis. The key property a good denominator is that it should be proportional to future deliverable cash flows.
Price/Revenue? Yes, particularly if margins fluctuate. Indeed, all of our most reliable valuation measures are some version of a price/revenue ratio or a margin-adjusted P/E.
Now, suppose we expect that elevated profit margins will be permanent. Then earnings are a better denominator, because if future margins will be permanently higher than in the past, comparing price/revenue ratios across history is no longer apples-to-apples. A margin that’s, say, 2 times higher than in the past will produce cash flows that are exactly 2 times higher as well. Easy fix: divide the price/revenue ratio by the profit margin. This is fine, provided that profit margins are expected to be permanent.
(Price/Revenue)/Margin = Price/(Revenue x Margin) = P/E
But look at what the Bloomberg piece did. What the heck is P/E divided by margin? Do the math:
(P/E)/Margin = [Price/(Revenue x Margin)]/Margin = Price/(Revenue x Margin^2)
The denominator doesn’t mean anything in terms of cash flows. Yes, it’s proportional to current earnings, but it doesn’t result in any apples-to-apples comparison of cash flows across history. It says that if margins are 2 times higher than in the past, future cash flows will be 4 times higher than in the past. What?!? One might as well divide the P/E by the number of aardvarks at the zoo.
You’ll notice, by the way, that nobody seems to care about how (P/E)/margin ratio behaves, other than the fact that it’s lower today than at the spikes. But look at those spikes. They occur precisely (I checked) in 2002, 2009, and at the market lows of early 2020. Why? Those are exactly the points when profit margins collapsed. The spike in this measure would have told you that stocks were wildly overvalued at each of those market lows. This, of course, is why P/E ratios tend to be unreliable. The measure above squares that unreliability.
On the growing economic insecurity of American families
Because so much of the current market exuberance is driven by record profits (we’ll discuss AI below as well), it’s important to understand exactly why corporate profits are lopsided at the moment. We’ve covered some of this in prior commentaries. Here, in particular, we examine the relationship between corporate profits and household deficits.
I know this may be difficult to accept, but if you simply take the accounting equation for GDP and rearrange it, you’ll find that if one sector is running a surplus – where their income exceeds their consumption and net investment – all other sectors must be running an identical deficit where their consumption and net investment exceeds their income. The deficit sectors issue liabilities, typically in the form of debt obligations, which the surplus sectors accumulate.
So for example, if the government runs a deficit, it commands a certain dollar value of goods and services, over and above the tax revenues it has received. It issues debt in order to run that deficit. Sometimes the Fed buys the debt, and creates a different liability known as cash, but one way or another, the deficit is financed by issuing a combination of government debt or government (Fed-issued) cash to pay for the stuff.
Meanwhile, someone in the economy produced stuff that they didn’t consume. Where did the stuff go? To the government (which distributes about two-thirds of it for the benefit of American families). What did the producers get in return? The new liabilities (debt or cash) that the government issued to buy the stuff.
There might be a billion individual transactions that create this result, but in the end, this result must hold in total: The deficit of one sector emerges as the surplus of other sectors, and the liabilities issued by one sector become the assets of the other sectors. It’s not just a theory. It’s an accounting identity.
The chart below shows how this works. The blue line at the top shows the “surplus” of corporations: corporate income minus expenses and net investment. We know this as corporate “free cash flow.” The red line shows combined “surplus” of other sectors: government, households, and foreign trading partners – in excess of their consumption and net investment. It’s negative, so in aggregate, they’re running a deficit. That deficit is the mirror image of the corporate surplus. This isn’t an accident. It’s just accounting (I’ve excluded a few tiny items for clarity).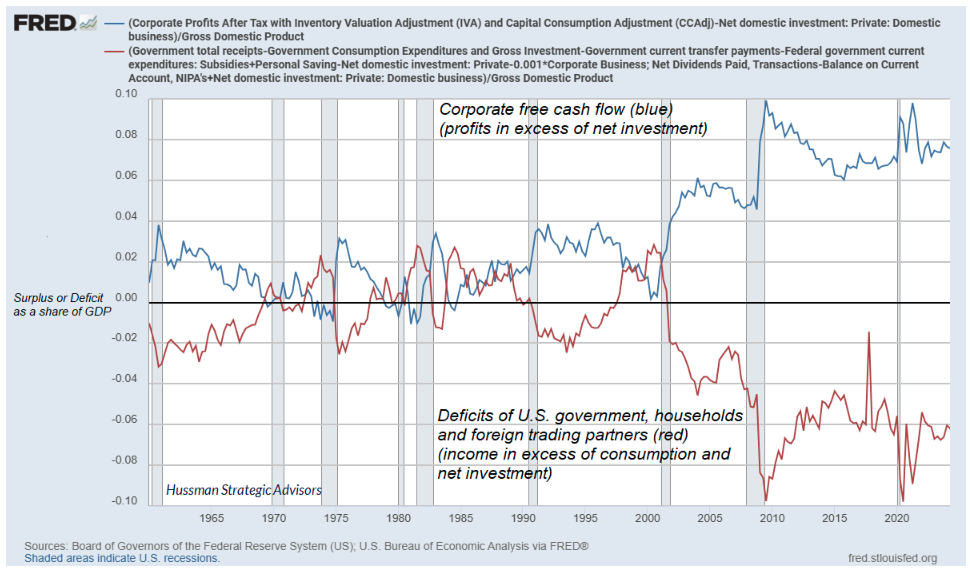
So yes, corporate profits and free cash flow are at record highs. They’re at record highs because government, households and foreign trading partners are running a massive net deficit. Interestingly, the domestic imbalance in the United States – government and households only – is even worse. That’s because foreign trading partners are running a surplus on the order of 1-2% of GDP (the flipside of our “current account deficit”). In equilibrium, their “saving” partially finances the massive “dissaving” of the U.S. government and household sectors. Again, it’s not just a theory, it’s an accounting identity.
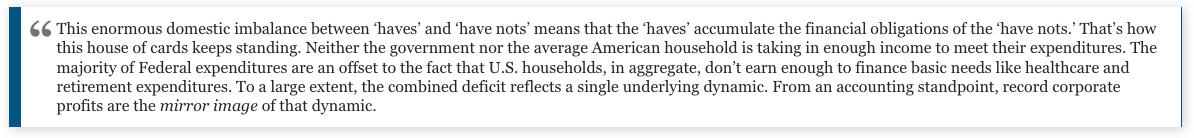
This enormous domestic imbalance between “haves” and “have nots” means that the “haves” accumulate the financial obligations of the “have nots.” That’s how this house of cards keeps standing. Neither the government nor the average American household is taking in enough income to meet their expenditures. The majority of Federal expenditures are an offset to the fact that U.S. households, in aggregate, don’t earn enough to finance basic needs like healthcare and retirement expenditures. To a large extent, the combined deficit reflects a single underlying dynamic. From an accounting standpoint, record corporate profits are the mirror image of that dynamic.
A year ago, Federal employment stood at the lowest share of civilian employment in U.S. history (about 1.8%), and total non-defense discretionary spending made up only about 10% of the Federal budget. Clearly, dismantling departments and agencies, ejecting Inspectors General, and pushing hundreds of thousands of civil servants into retirement had effects far beyond saving a bit of money, because that’s not where the money goes. Two thirds of government expenditures are used to bridge the income gap of American families, so they can cover retirement, health care, and basic needs that even many working families can’t meet.
Meanwhile, nearly 50% of equities and mutual fund shares are owned by the wealthiest 1% of U.S. households, with 87% held by the top 10%. In equilibrium, the deficits of government and households are the surpluses of this small group. Only 1% of shares are owned by the 50% of households with the lowest incomes.
Think carefully about what this means. The majority of corporate profits – and more importantly – market capitalization, accrues to the top 10% of American households, with half of all stock market capitalization owned by the wealthiest 1%. The concentration gets increasingly lopsided from there – at the top 0.1%. By pure accounting and mathematics, the economic insecurity of 90% of American families – and to some degree, even 99% – is a precise mirror image of the lopsided wealth distribution that favors the top 1%.
My friend Danielle DiMartino Booth and the great team at Quill Intelligence shared this chart yesterday, and it speaks volumes about the growing sense of insecurity among most American families, and the increased debt burden being taken on by those with fewer assets to liquidate.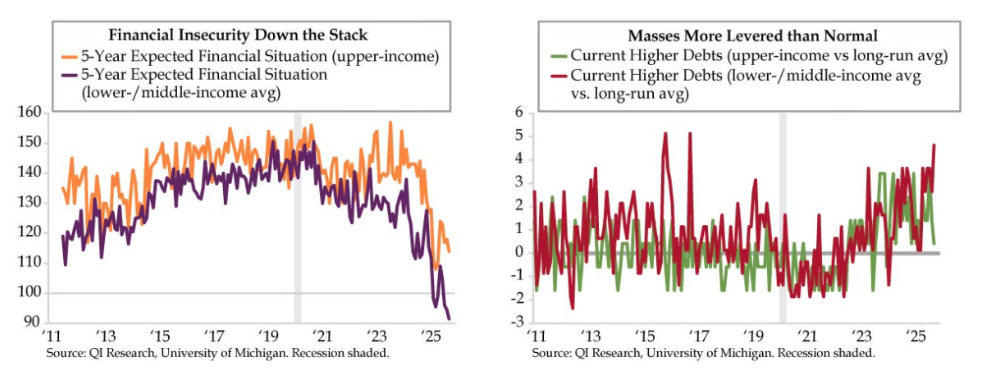
How can this broad and increasing economic insecurity be happening at the same time that stock market valuations are at the highest level in history? Simple. The deficits of one are the surplus of another – and as the kids say, “The stock market is a barometer of rich people’s feelings.”
I’ll offer this proposition: Everyone deserves the fruits of their labor, but in a world increasingly dominated by network effects and hyperscale technologies that allow one company and even one individual to displace thousands of businesses and even millions of workers, much of the wealth isn’t a reflection of labor or even invention – it’s a gain based on the negative externalities and private monetization of an unrecognized public good – the network effect – with no associated compensation to the public.
I’ll offer another proposition: There’s a point where our rights to property, to security, and to our human right to live without discrimination against faith, race, gender – can be pushed so far in favor of our own interests that we are no longer defending our own human rights, but are instead suppressing the rights of others, or even actively causing others to suffer in pursuit of our own beliefs or interests. Everybody does it, and wow, do we perk up when the other “side” does it. The outrage media – every “side” – knows exactly what video or soundbite to show us to get us enraged at each other, and to drown any insight that all of us share the same thread of common humanity.
This division and imbalance will progressively destroy the security of 99% of American families unless we start finding a middle – unless we are capable of seeing when enough is enough. Every human being is a human being. They could have been us, and we could have been them – but for the circumstances of our birth and opportunity. We’re slouching toward oligarchy or worse because we’re so completely distracted by the daily outrage that we can’t put our finger on our common problems.
As for the economic insecurity of working families, this situation has been an evolution. Much of U.S. economic history prior to the mid-1980’s reflected a reasonable degree of “stakeholder capitalism.” When deciding what to maximize, it was natural to consider the income and well-being of employees as part of the objective. Part of this was voluntary, as it was for Henry Ford. Part of this was also enforced by labor unions, which were a dominant part of the economic landscape during the highest-growth segment of U.S. economic history.
Gradually, accelerating in the 1980’s and going into hyperdrive in more recent decades, the U.S. shifted to the Gordon Gekko form of “shareholder capitalism” – where anything short of maximizing profits and share price is almost viewed as a betrayal of shareholders and a breach of fiduciary duty.
The current economic environment features possibly the most untethered, and undoubtedly most imbalanced version of this philosophy in U.S. economic history. Yet the outcome has not been faster growth, nor even faster productivity growth. Rather, the combined slowing in demographic labor force growth and U.S. productivity growth has resulted in the slowest 25-year compound annual growth in real U.S. GDP in the nation’s history.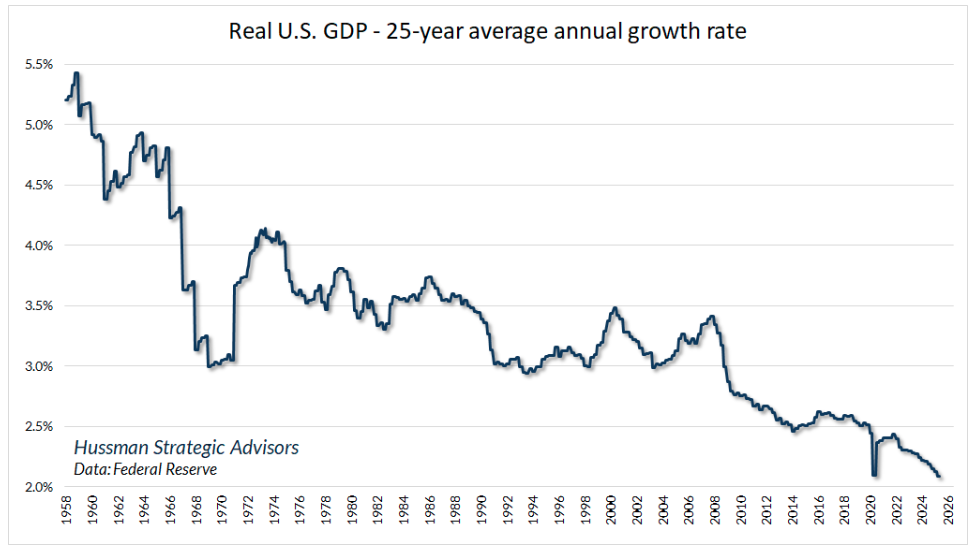
An unsustainable equilibrium
From an equilibrium standpoint, record corporate profits and free cash flow, particularly as a share of GDP, are the mirror image of record deficits in the government and household sectors. Again, this isn’t a theory. It’s an accounting identity. Sustaining record corporate surpluses requires sustaining record government and household deficits.
The problem is that this is a longer-term recipe for debt crisis and hyperinflation. That may be some part of why gold is on a ramp, though I don’t expect outcomes like this in the foreseeable future. My hope is that long before that day ever comes, we can resolve the problem with a combination of stronger real wage growth, coupled with more meaningful government revenue generation that narrows the gap between the income of the wealthiest and the (possibly supplemented) income of the average family.
Presently, the rhetoric of the moment is that any family that can’t cover its expenses and health care costs with their own wage and salary income is a “free rider.” There’s still opportunity to resolve this imbalance in the coming years. If we can’t find the consensus to do that, the remaining option is a debt crisis, because the surpluses of one sector are the deficits of another.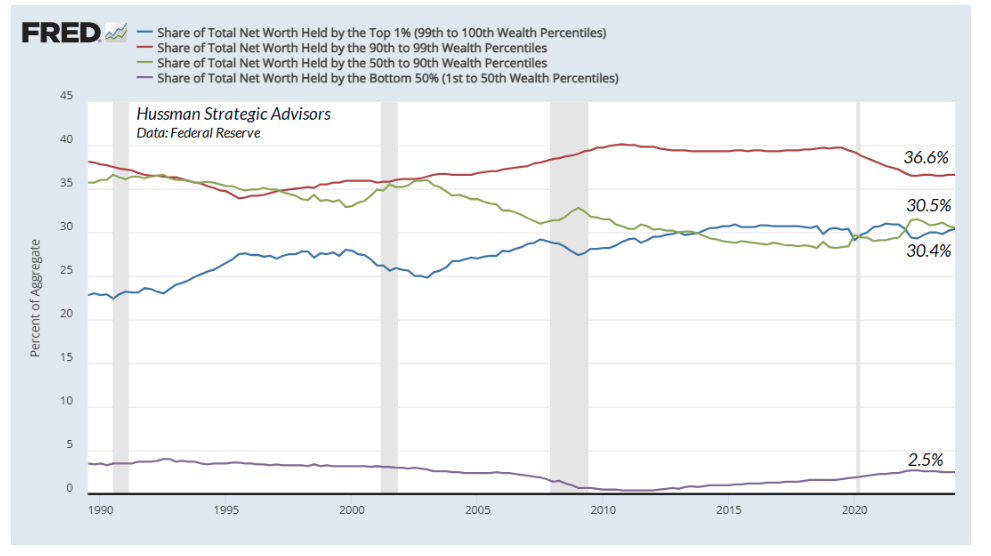
Hyperscalers, AI, and the distribution of profits
Having established that the total amount of corporate profit and free cash flow is, as an accounting identity, the mirror image of government and household deficits, we should be careful not to suggest that innovation is meaningless to corporate profits.
Specifically, the level of profits is a sectoral imbalance, but the distribution of the corporate profits absolutely reflects scarcity, innovation and – particularly in recent years – “hyperscale” network effects, where single companies operate as dominant providers in their sectors. This lopsided distribution has been amplified by “circular flows,” where this same group of large companies has plowed hundreds of billions into investments surrounding artificial intelligence. Now, we can’t get too excited because net investment by U.S. corporations is still in a downtrend as a share of GDP, but it’s still a meaningful amount of investment.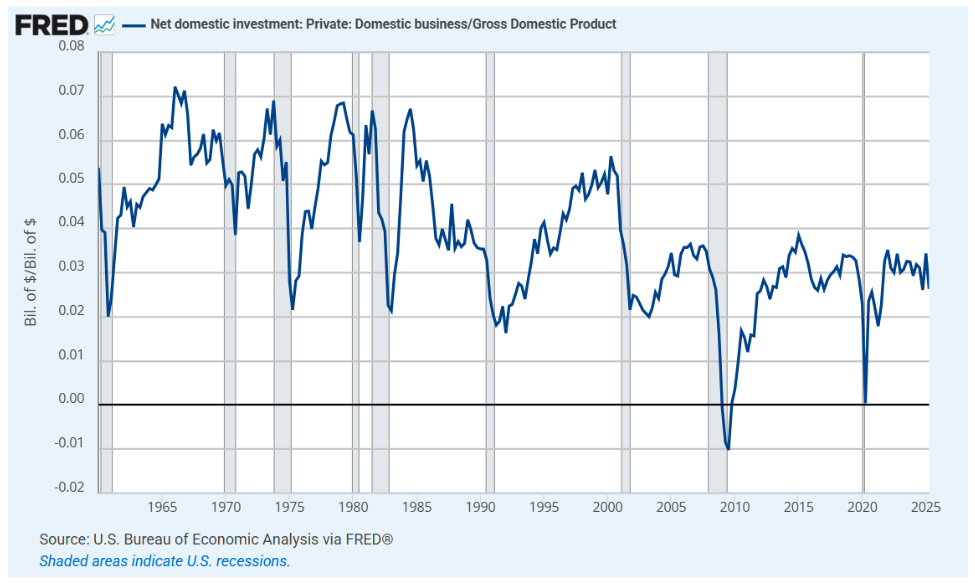
It’s not at all clear that this investment spending will tie cleanly into future profits. Indeed, the whole machinery of economic growth in a free-enterprise system is driven by the fact that massive investment flattens out profit margins. When Joseph Schumpeter described “creative destruction,” and Adam Smith described the “invisible hand,” they envisioned an economic system where potential opportunities for profit would create an incentive for innovation by those who were best capable of filling unmet needs.
But they also saw profits as inherently self-destructive, because profit opportunities would encourage a “swarm-like” activity of other entrepreneurs. That competition would expand production, and simultaneously produce economic growth while eroding excessive profits.
I certainly believe that artificial intelligence will change the economic landscape. Part of that effect will be to displace jobs in certain sectors, but I am hopeful that this can be a net benefit to the economy. Population and labor force growth continues to be a constraint on long-term U.S. economic growth, and by replacing some jobs with AI, labor will be freed up for other activities.
Whether that ends up being positive or negative depends a great deal on whether those other activities provide a living income for families. Hyperscale gets you a lot of benefits, but it also gets you job displacement and increasing wealth concentration, so I’ll say this again:
I also expect we’ll see new innovations and discoveries as a result of AI, along with a host of new products and businesses. These innovations will enjoy their own profit opportunities, at least initially. But it’s important to remember that profit opportunities provoke new investment and business expansion, and that ultimately, the strongest consumer benefit and economic growth goes hand-in-hand with the erosion of profits.
The corollary is that persistently elevated profits reflect scarcity that, if sustained, actually hinder growth. We’ve seen just that over the past 25 years. Meanwhile, excess profits – either by job displacement or depressed compensation – tend to go hand-in-hand with economic insecurity among working families. Directly or indirectly, the deficits of those families are the mirror image of the elevated profits. It’s an accounting identity. Once you have that insight, you begin to see what to do, and what not to do – to better ensure that everyone enjoys the fruits of their labor (entrepreneurs included), everyone shares some of the benefit of the public goods involved, and every family lives with some basic level of security.
The speculative imagination
As I’ve noted before, investors rediscover the idea of a ‘new era’ at every speculative peak. But the reality is that economic growth is nothing but the constant introduction of new eras. The danger occurs when the new era is so satisfying to the imagination that investors abandon any concern about valuation.
Even when an industry is eventually successful, early speculation can have devastating consequences in the interim. Several large technology companies from the tech bubble have gone on to prosper, but not without the Nasdaq 100 losing 83% between March 2000 and October 2002, with these same companies participating in the collapse. The S&P 500 itself lost half its value during that period, from a lower level of valuation than we observe at present.
Similarly, computer companies became a speculative theme in the late-1960’s, investors abandoned that concern, leading to profound losses even before the 1973-74 collapse took the overall S&P 500 down by 50%, from a lower level of valuation than we observe at present. As Benjamin Graham wrote at the time:
The chart below offers a striking perspective on the current speculative run. The purple line is the median price/revenue ratio across the largest 20% of S&P 500 components. The green line is the median price/revenue of the median S&P 500 component by market capitalization. The red line shows the median price/revenue ratio across the smallest 20% of S&P 500 components.
While the purple line shows episodes of speculation concentrated in the very largest stocks – for example, 1999-2000, and again approaching the January 2022 peak – what we currently have is an even more generalized bubble. There are certainly individual stocks that we are content to own, particularly on a hedged basis, but I marvel at the rampant level of “imagination” built into actual market prices, and the confidence of investors that elevated profit margins and favorable business conditions will be permanent.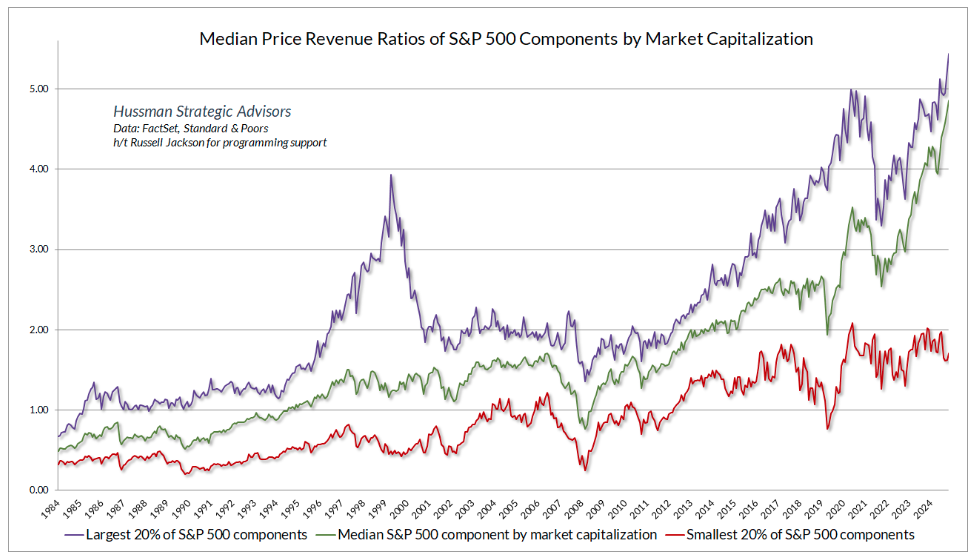
Every bubble features a tendency to replace analysis with imagination. Yet despite various periods when our stock selection discipline can lag the glamour stocks of the moment, the long-term record of this part of our discipline has never needed to rely on chasing the imagination. Admittedly, our hedging during the recent bubble hid our stock-selection under a bushel, but even during the past decade, attending to valuations and market action has done an admirable job, as it has across four decades of bull markets, bear markets, bubbles, and crashes, without having to rely on chasing speculative themes. Without the majority of the price relying on imagination.
Similarly, in his narrative on the Crash of 1929, Andrew Ross Sorkin shared this anecdote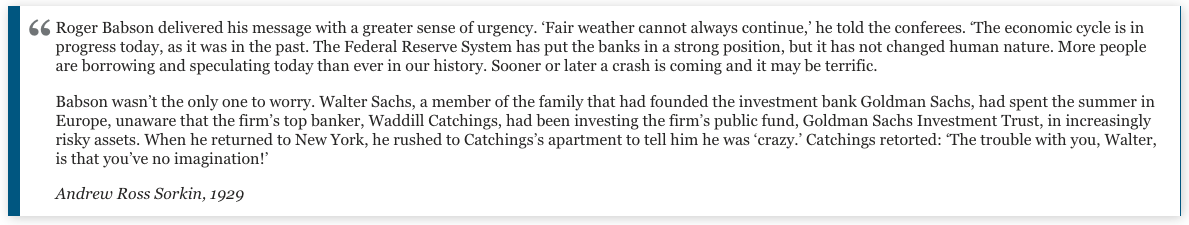
Perhaps the “imagination” that might have served investors better was the notion that the S&P 500 would shortly collapse by 89% – from a lower level of valuation than we observe at present.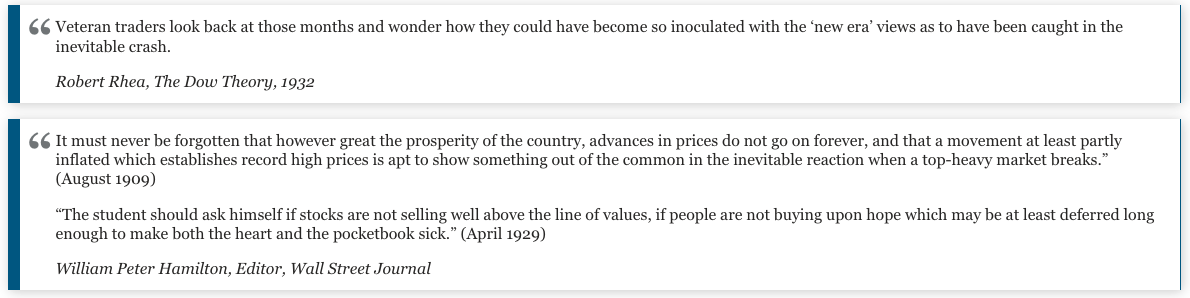
As usual, it’s worth an emphatic reminder that nothing in our investment discipline relies on a market collapse, or even a long-term return to historical valuation norms. We will be content for the market simply to fluctuate. There’s no question that a 120-day diagonal ramp at the most extreme valuations in history, without even fluctuating around the 50-day average, isn’t ideal over the short-run. Still, our attention remains on the historic valuation risk in the financial markets here, the persistent and growing divergences across market internals, and the sectoral imbalances that underpin record corporate profits – which seem to be widely overlooked. I suspect it all ends quite badly for the financial markets, but as usual, no forecasts or scenarios are required.
A message from Advisor Perspectives and VettaFi: Discover something new! Click here to register for our upcoming webcasts.
The foregoing comments represent the general investment analysis and economic views of the Advisor, and are provided solely for the purpose of information, instruction and discourse.
Prospectuses for the Hussman Strategic Market Cycle Fund, the Hussman Strategic Total Return Fund, and the Hussman Strategic Allocation Fund, as well as Fund reports and other information, are available by clicking Prospectus & Reports under “The Funds” menu button on any page of this website.
The S&P 500 Index is a commonly recognized, capitalization-weighted index of 500 widely-held equity securities, designed to measure broad U.S. equity performance. The Bloomberg U.S. Aggregate Bond Index is made up of the Bloomberg U.S. Government/Corporate Bond Index, Mortgage-Backed Securities Index, and Asset-Backed Securities Index, including securities that are of investment grade quality or better, have at least one year to maturity, and have an outstanding par value of at least $100 million. The Bloomberg US EQ:FI 60:40 Index is designed to measure cross-asset market performance in the U.S. The index rebalances monthly to 60% equities and 40% fixed income. The equity and fixed income allocation is represented by Bloomberg U.S. Large Cap Index and Bloomberg U.S. Aggregate Index. You cannot invest directly in an index.
Estimates of prospective return and risk for equities, bonds, and other financial markets are forward-looking statements based the analysis and reasonable beliefs of Hussman Strategic Advisors. They are not a guarantee of future performance, and are not indicative of the prospective returns of any of the Hussman Funds. Actual returns may differ substantially from the estimates provided. Estimates of prospective long-term returns for the S&P 500 reflect our standard valuation methodology, focusing on the relationship between current market prices and earnings, dividends and other fundamentals, adjusted for variability over the economic cycle. Further details relating to MarketCap/GVA (the ratio of nonfinancial market capitalization to gross-value added, including estimated foreign revenues) and our Margin-Adjusted P/E (MAPE) can be found in the Market Comment Archive under the Knowledge Center tab of this website. MarketCap/GVA: Hussman 05/18/15. MAPE: Hussman 05/05/14, Hussman 09/04/17.
Performance data quoted represents past performance. Past performance does not guarantee future results. Investment return and principal value of an investment will fluctuate so that an investor's shares, when redeemed, may be worth more or less than their original cost. Current performance may be lower or higher than performance data quoted. More current performance data through the most recent month-end are available at the Fund's website www.hussmanfunds.com or by calling 1-800-487-7626.
Investors should consider the investment objectives, risks, and charges and expenses of the Funds carefully before investing. For this and other information, please obtain a Prospectus and read it carefully.
The Hussman Funds have the ability to vary their exposure to market fluctuations depending on overall market conditions, and they may not track movements in the overall stock and bond markets, particularly over the short-term. While the intent of this strategy is long-term capital appreciation, total return, and protection of capital, the investment return and principal value of each Fund may fluctuate or deviate from overall market returns to a greater degree than other funds that do not employ these strategies. For example, if a Fund has taken a defensive posture and the market advances, the return to investors will be lower than if the portfolio had not been defensive. Alternatively, if a Fund has taken an aggressive posture, a market decline will magnify the Fund’s investment losses. The Distributor of the Hussman Funds is Ultimus Fund Distributors, LLC., 225 Pictoria Drive, Suite 450, Cincinnati, OH, 45246.
The Hussman Strategic Market Cycle Fund has the ability to hedge market risk by selling short major market indices in an amount up to, but not exceeding, the value of its stock holdings. However, the Fund may experience a loss even when the entire value of its stock portfolio is hedged if the returns of the stocks held by the Fund do not exceed the returns of the securities and financial instruments used to hedge, or if the exercise prices of the Fund's call and put options differ, so that the combined loss on these options during a market advance exceeds the gain on the underlying index. The Fund also has the ability to leverage the amount of stock it controls to as much as 1 1/2 times the value of net assets, by investing a limited percentage of assets in call options.
The Hussman Strategic Allocation Fund invests primarily in common stocks, bonds, and cash equivalents (such as U.S. Treasury bills and shares of money market mutual funds, aligning its allocations to these asset classes based on prevailing valuations and estimated expected returns in these markets. The investment strategy adds emphasis on risk-management to adjust the Fund’s exposure in market conditions that suggest risk-aversion or speculation among market participants. The Fund may use options and futures on stock indices and Treasury bonds to adjust its relative investment exposures to the stock and bond markets, or to reduce the exposure of the Fund’s portfolio to the impact of general market fluctuations when market conditions are unfavorable in the view of the investment adviser.
The Hussman Strategic Total Return Fund has the ability to hedge the interest rate risk of its portfolio in an amount up to, but not exceeding, the value of its fixed income holdings. The Fund also has the ability to increase the interest rate exposure of its portfolio through limited purchases of Treasury zero-coupon securities and STRIPS. The Fund may also invest up to 30% of assets in alternatives to the U.S. fixed income market, including foreign government bonds, utility stocks, convertible bonds, real-estate investment trusts, and precious metals shares.
The Prospectus of each Fund contains further information on investment objectives, strategies, risks and expenses. Please read the Prospectus carefully before investing.
The Market Climate is not a formula but a method of analysis. The term "Market Climate" and the graphics used to represent it are service marks of Hussman Strategic Advisors (formerly known as Hussman Econometrics Advisors). The Fund Manager has sole discretion in the measurement and interpretation of market conditions. Information relating to the investment strategy of each Fund is described in its Prospectus and Statement of Additional Information. A schedule of investment positions for each Fund is presented in the annual and semi-annual reports. Except for articles specifically citing investment positions held by the Funds, general market commentary does not necessarily reflect the investment position of the Funds.
Membership required
Membership is now required to use this feature. To learn more:
View Membership Benefits