Summary
- We believe international stocks are not as ‘cheap’ as they first appear.
- The outperformance of the US has been due to superior earnings growth, in our view.
- There are 3 potential themes that could shift returns in favor of international… but currently we still prefer US stocks.
Our Framework: ‘Price Matters’… but So Does Macro and Earnings Data
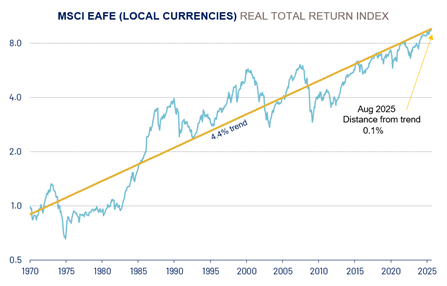
A question RiverFront often gets is when we will go ‘overweight’ on international equities, after almost fifteen years of disappointing returns. Emerging Markets (EM) and Developed International (EAFE) indices are both beating US markets year-to-date, which has only happened 3 years in the last decade. It is a fair question, given continued all-time highs and the concerns some have over elevated valuations in the S&P 500. Using our Price Matters® framework, which attempts to draw a long-term total return trend through equity prices, we can see that as of Aug 2025, developed international equities (as represented by the MSCI Europe, Australasia and Far East Index – aka EAFE) are right at their long-term trend of 4.4% (see Chart 1, below), which is 2.1% lower per annum than their US Counterpart. With US Stocks +47% above their much faster trendline, the relative valuation argument for international appears compelling, although there are a lot of caveats we would make; trend analysis is as much ‘art’ as ‘science’, especially as international does not have nearly as much data to analyze as the US. Thus, today’s Weekly View is a deeper exploration of what conditions we think will be necessary in order for International to outperform US Markets.
CHART 1: INTERNATIONAL STOCKS RIGHT AT LONG-TERM TREND

Source: RiverFront Investment Group, Factset. Data from Jan 1970 through Nov 2023. Past performance is no guarantee of future results. It is not possible to invest directly in an index. RiverFront’s Price Matters® discipline compares inflation-adjusted current prices relative to their long-term trend to help identify extremes in valuation. Blue line represents the MSCI EAFE (local) Real Return Index. Yellow line represents the Annualized Real Trend Line of MSCI EAFE (local) Real Total Return Index according to Price Matters®. Shown for illustrative purposes only, not indicative of RiverFront portfolio performance. Information or data shown or used in this material was received from sources believed to be reliable, but accuracy is not guaranteed. The chart above uses a logarithmic scale. Line movements will be dampened/subdued based on the exponential y-axis.
Valuations do matter… but we also believe that the more favorable economic environment, combined with stronger profitability and earnings growth, can justify higher valuations in the US versus international. Thus, we believe the US’ valuation gap versus peers is justified when we take a step back and look at the complete picture. Simply put, a much stronger profit trend can justify a premium valuation when viewed through the following lenses:
-
The Macroeconomic Environment: In our view, most economic data is like “blood pressure;” any reading that is too high or too low requires action by a fiscal or monetary authority. We believe there is a sustainable level of economic growth and inflation at which well-run companies can thrive. For example, inflation growth rates of 2-3%, along with positive trending leading economic indicators, is a good combination for equity returns, in our opinion.
-
Evidence that Earnings Are Capturing Economic Growth: Using a combination of historic and consensus earnings analysis, we attempt to identify stable and growing earnings patterns that are consistent with current economic activity.
-
A Reasonable Starting Valuation: We see valuation as a long-term sentiment gauge of a market’s earnings power and profitability. Without a view of this earnings power – and the economic forces that drive these earnings – we can easily overpay for growth, or buy assets that appear ‘cheap’ but fail to generate consistent earnings. Thus, we view valuation as a ‘condition’… and not necessarily a ‘catalyst’ to generate outsized returns.
US and International Markets Thrive in Different Business Climates… and the Last Decade Favored the US
One major difference between the composition of US large-caps and EAFE is that the US has a much higher weighting towards ‘growth’ companies, whereas EAFE is dominated by ‘value’ companies. Specifically, stocks of growth companies tend to thrive in lower-interest-rate environments, where GDP growth tends to be lower. In these environments, their organic growth provides attractive levels of profitability, and they can utilize low interest rates to repurchase shares (and thus reduce their share count), using cheap debt. Put simply: growth companies are adept at squeezing attractive earnings growth out of a slow and steady economy such as the one that we’ve seen for the last half-decade. Luckily for the S&P 500, the US large-cap space is stocked with growth companies in areas like technology, consumer discretionary and communication services.
On the other hand, value companies tend to perform well in times of elevated economic growth. The higher growth helps cover their higher fixed costs, which then allows for higher margins on sales; we call this “operating leverage.” Put simply: when economic growth is high, operating leverage tends to allow value-oriented companies’ earnings to outgrow more stable, less economically sensitive sectors. International Markets like EAFE tend to be much more value-oriented, with larger weightings to sectors such as industrials, energy and financials.
Source: LSEG Datastream, RiverFront; data weekly, as of 10/24/25. Chart shown for illustrative purposes only. Past performance is no indication of future results.
While there are also more defensive companies in international markets than in US markets, such as consumer staples or utilities, the major difference is in value and growth, in our view. This generally holds true with international markets as well, with the notable exception of China, which has similar technology companies to the US that emerged in the middle of the last decade.
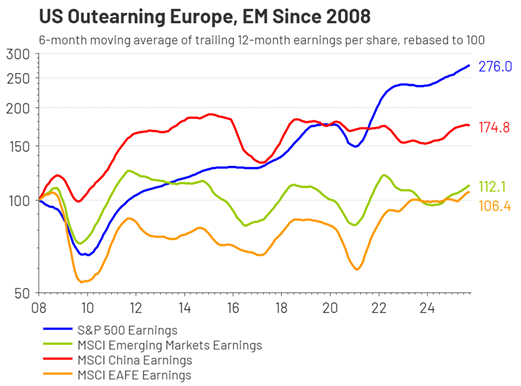
We can see the cumulative impact of low interest rates and lower economic growth on earnings in global markets from 2008-2025 (see Figure 2, previous page), an era that strongly favored US markets over international. This era was marked by disinflation and even occasional deflation in various economies, which led to much slower nominal economic growth. This economic dynamic hurt earnings for the value sectors and benefitted the growth ones, in our view.
Overlaying that was a secular technology revolution, which has continued to this day through the proliferation of Artificial Intelligence (‘AI’). This dynamic is why the S&P 500 has dramatically outearned EAFE since 2008, in our opinion. While the interest rate and inflation environments have shifted in a way that should favor value-oriented companies, the AI theme is proving to also be a durable source of earnings for technology and growth companies. The question of which type of companies (“Growth-Oriented” or “Value-Oriented”) will perform better going forward will come down to a combination of three themes, which we will explore a little below.
Three Possible Themes That Could Cause International to Outperform the US Going Forward
Theme #1: The Artificial Intelligence Race Becomes a Broader Boom… or a Bubble-and-Bust
The vast majority of the investment in AI is occurring in the United States and China. While there are other countries with specialized semiconductors and software niches, it is likely that a boom in this area will continue to galvanize macroeconomics and earnings in these countries. Our current belief is that we are still in the early innings of the AI trade, and our current preferences for large cap technology themes in our portfolios reflect that. We are also bullish on US companies that provide the infrastructure for AI – these are companies that provide the power and equipment needed to run the software.
What is less clear to us is whether investment in Chinese equities is attractive long term, as we remain wary of the Chinese government’s grip over wealth creation and entrepreneurship. We recognize that the nature of the AI race is one of US/China adversarial competition, so there the government of China could squelch AI returns from reaching US shareholders either by restricting the profitability of the companies, or restricting US access. Either way, that dynamic represents a major negative for US investors in Chinese assets, in our view.
If the AI trade rolls over, Europe, Japan and other regions will likely be relative winners over the US. However, we would argue that withholding investment in AI globally would also likely cause a global economic slowdown, a condition that likely would be negative for stocks generally in all geographies. That backdrop would likely shift our portfolio strategy into considering more defensive positions – like bonds – in our portfolios, rather than increasing international stocks.
Theme #2: The Trade War, Foreign Currency, and the Path of Interest Rates in the US
It is still too early to be certain of the impact of the significant US trade policy shifts that occurred in 2025 – it is not yet clear if they are putting recessionary or inflationary pressure on markets. What is becoming clearer is that economic growth is softening enough for a handful of US rate cuts to be justified. This will help with another growing problem on the horizon for the US, which is financing its burgeoning deficits without reigniting inflation. That tightrope is going to be very challenging to navigate, and the current likely path (i.e., lower rates, continued deficit concerns, and an uptick in inflation) would all put downward pressure on the US dollar versus other currencies. Since buying international equities is also implicitly a bet on the foreign currencies the companies are domiciled in, there is a case to be made for international returns to improve based on this impact. When we look at the outperformance of international markets relative to the US in 2025, foreign currency strength is one of the primary contributors. Thus, we would need to see greater follow-through on US rate cuts for this policy to continue.
One other thing to consider if this scenario plays out is that lowering interest rates is also very favorable to US small-cap equities, as we covered in detail a few weeks back. That fulcrum could help us decide to rotate to US Small Caps instead of International. In order to judge the relative attractiveness of these ‘value’-oriented asset classes, we will likely be comparing earnings on our earnings framework. We believe that corroboration of earnings trends would be a powerful confirmation that our theories around operating leverage businesses and the impact of rates are showing up (or not) in the earnings of those smaller companies; that is ultimately what we want to see for sustainable investments, whether in the US or abroad.
Theme #3: The ‘European Re-Armament’ Trade
One of the side effects of Trump Administration policies has been a demand for NATO members to increase their spending in defense and infrastructure. The combination of this mandate and the re-routing of global supply lines to navigate the tariffs and trade restrictions imposed could create a positive cycle of stimulus in Europe, and the infrastructure needs could also help cyclical companies globally begin to spin up their operating earnings.
Since we are not yet sure this is a durable theme, we are waiting for earnings confirmation, as well as policy guidance from European nations to become a little clearer. We also see regulations and non-market-friendly labor laws as headwinds that investors in Europe likely face, so we do not believe that one event or policy in one country will be enough to have a sustained impact – this theme will require a sequence of favorable policy developments.
CONCLUSION: International is Not Compelling Enough to go “All-In” Yet
The three themes we laid out will take a few years to play out, if at all. Our portfolio positioning reflects our belief in the economic strength and momentum of the US Tech / AI trade, and we would want to see more policy clarity and earnings confirmation before we make any large shifts into international. Our current positioning is to be roughly in line international with global benchmarks, with a preference towards European Banks, Japan and value-oriented themes… and avoiding Chinese equities. We believe this is sufficient exposure to capture the upside of these markets while we wait for more concrete earnings evidence to emerge.
It is also important to note that there are companies and countries that might behave differently than the broad market. We will continue to use our security selection disciplines to identify potential early leaders or areas that may have attractive opportunities. We feel this flexibility is one of the advantages that having deep expertise in bottom-up stock research can bring to portfolio management, and it is possible we might make smaller trades into narrow international themes, even if we do not see the macro story of American ‘Economic Exceptionalism’ deteriorating.
Originally published by Riverfront Investment Group
For more news, information, and strategy, visit the ETF Strategist Content Hub.
A message from Advisor Perspectives and VettaFi: Thinking about starting your own RIA, making a move to a different firm, or specializing in a new area? Read our latest articles on financial advisor transitions.
Risk Discussion:
All investments in securities, including the strategies discussed above, include a risk of loss of principal (invested amount) and any profits that have not been realized. Markets fluctuate substantially over time and have experienced increased volatility in recent years due to global and domestic economic events. Performance of any investment is not guaranteed. In a rising interest rate environment, the value of fixed-income securities generally declines. Diversification does not guarantee a profit or protect against a loss. Investments in international and emerging markets securities include exposure to risks such as currency fluctuations, foreign taxes and regulations, and the potential for illiquid markets and political instability. Please see the end of this publication for more disclosures.
Important Disclosure Information:
The comments above refer generally to financial markets and not RiverFront portfolios or any related performance. Opinions expressed are current as of the date shown and are subject to change. Past performance is not indicative of future results and diversification does not ensure a profit or protect against loss. All investments carry some level of risk, including loss of principal. An investment cannot be made directly in an index.
Information or data shown or used in this material was received from sources believed to be reliable, but accuracy is not guaranteed.
This report does not provide recipients with information or advice that is sufficient on which to base an investment decision. This report does not take into account the specific investment objectives, financial situation or need of any particular client and may not be suitable for all types of investors. Recipients should consider the contents of this report as a single factor in making an investment decision. Additional fundamental and other analyses would be required to make an investment decision about any individual security identified in this report.
The comments above are subject to change and are not intended as investment recommendations. There is no representation that an investor will or is likely to achieve positive returns, avoid losses or experience returns as discussed for various market classes.
Chartered Financial Analyst is a professional designation given by the CFA Institute (formerly AIMR) that measures the competence and integrity of financial analysts. Candidates are required to pass three levels of exams covering areas such as accounting, economics, ethics, money management and security analysis. Four years of investment/financial career experience are required before one can become a CFA charterholder. Enrollees in the program must hold a bachelor’s degree.
All charts shown for illustrative purposes only. Technical analysis is based on the study of historical price movements and past trend patterns. There are no assurances that movements or trends can or will be duplicated in the future.
Stocks represent partial ownership of a corporation. If the corporation does well, its value increases, and investors share in the appreciation. However, if it goes bankrupt, or performs poorly, investors can lose their entire initial investment (i.e., the stock price can go to zero). Bonds represent a loan made by an investor to a corporation or government. As such, the investor gets a guaranteed interest rate for a specific period of time and expects to get their original investment back at the end of that time period, along with the interest earned. Investment risk is repayment of the principal (amount invested). In the event of a bankruptcy or other corporate disruption, bonds are senior to stocks. Investors should be aware of these differences prior to investing.
In general, the bond market is volatile, and fixed income securities carry interest rate risk. (As interest rates rise, bond prices usually fall, and vice versa). This effect is usually more pronounced for longer-term securities). Fixed income securities also carry inflation risk, liquidity risk, call risk and credit and default risks for both issuers and counterparties. Lower-quality fixed income securities involve greater risk of default or price changes due to potential changes in the credit quality of the issuer. Foreign investments involve greater risks than U.S. investments, and can decline significantly in response to adverse issuer, political, regulatory, market, and economic risks. Any fixed-income security sold or redeemed prior to maturity may be subject to loss.
Investing in foreign companies poses additional risks since political and economic events unique to a country or region may affect those markets and their issuers. In addition to such general international risks, the portfolio may also be exposed to currency fluctuation risks and emerging markets risks as described further below.
Changes in the value of foreign currencies compared to the U.S. dollar may affect (positively or negatively) the value of the portfolio’s investments. Such currency movements may occur separately from, and/or in response to, events that do not otherwise affect the value of the security in the issuer’s home country. Also, the value of the portfolio may be influenced by currency exchange control regulations. The currencies of emerging market countries may experience significant declines against the U.S. dollar, and devaluation may occur subsequent to investments in these currencies by the portfolio.
Foreign investments, especially investments in emerging markets, can be riskier and more volatile than investments in the U.S. and are considered speculative and subject to heightened risks in addition to the general risks of investing in non-U.S. securities. Also, inflation and rapid fluctuations in inflation rates have had, and may continue to have, negative effects on the economies and securities markets of certain emerging market countries.
Technology and internet-related stocks, especially of smaller, less-seasoned companies, tend to be more volatile than the overall market.
Artificial intelligence, or AI, refers to the simulation of human intelligence by software-coded heuristics. Nowadays this code is prevalent in everything from cloudbased, enterprise applications to consumer apps and even embedded firmware
Index Definitions:
Standard & Poor’s (S&P) 500 Index measures the performance of 500 large cap stocks, which together represent about 80% of the total US equities market.
U.S Market Cap index information calculated based on data from CRSP 1925 US Indices Database ©2024 Center for Research in Security Prices (CRSP®), Booth School of Business, The University of Chicago. Used as a source for cap-based portfolio research appearing in publications, and by practitioners for benchmarking, the CRSP Cap-Based Portfolio Indices Product data tracks micro, small, mid- and large-cap stocks on monthly and quarterly frequencies. This product is used to track and analyze performance differentials between size-relative portfolios. CRSP ranks all NYSE companies by market capitalization and divides them into ten equally populated portfolios. Alternext and NASDAQ stocks are then placed into the deciles determined by the NYSE breakpoints, based on market capitalization. The series of 10 indices are identified as CRSP 1 through CRSP 10, where CRSP 10 has the largest population and smallest market-capitalization. CRSP portfolios 1-2 represent large cap stocks, portfolios 3-5 represent mid-caps and portfolios 6-10 represent small caps.
MSCI Emerging Markets Index captures large and mid cap representation across approximately 26 Emerging Markets (EM) countries.
MSCI EAFE Index NR is designed to represent the performance of large and mid-cap securities across 21 developed markets, including countries in Europe, Australasia, and the Far East, excluding the US and Canada. Net total return indices reinvest dividends after the deduction of withholding taxes, using (for international indices) a tax rate applicable to non-resident institutional investors who do not benefit from double taxation treaties.
MSCI China Index captures large and mid cap representation across China A shares, H shares, B shares, Red chips, P chips and foreign listings (e.g. ADRs).
The Real Return is the annual percentage return realized on an investment adjusted for inflation. Trend, according to Price Matters® is the slope of an exponential growth function that closely tracks a real (inflation-adjusted) long term Index for that Asset Class. Distance from Trend is the distance of the trend line relative to the current index level expressed as a percentage.
Definitions:
Gross domestic product (GDP) is a monetary measure of the market value of all final goods and services produced in a period (quarterly or yearly) of time.
Inflation is a gradual loss of purchasing power, reflected in a broad rise in prices for goods and services over time.
Deflation, a reduction in the prices of goods and services, increases the purchasing power of money. Often linked to a decline in money supply or credit, it affects consumers, borrowers, and the broader economy.
Disinflation is a temporary slowing of the pace of price inflation. The term is used to describe occasions when the inflation rate has reduced marginally over the short term.
A recession is a significant, widespread, and prolonged downturn in economic activity. A common rule of thumb is that two consecutive quarters of negative gross domestic product (GDP) growth indicate a recession. However, more complex formulas are also used to determine recessions.
Operating leverage is a financial metric that measures the impact of sales on a company’s operating income. It reflects the relationship between fixed and variable costs, indicating how a change in sales volume affects earnings before interest and taxes (EBIT). A higher operating leverage means that a small change in sales can lead to a larger change in operating income, making it crucial for analyzing a company’s profitability and break-even point.
RiverFront’s Price Matters® discipline compares inflation-adjusted current prices relative to their long-term trend to help identify extremes in valuation.
Trend, according to Price Matters® is the slope of an exponential growth function that closely tracks a real (inflation-adjusted) long term Index for that Asset Class. Distance from Trend is the distance of the trend line relative to the current index level expressed as a percentage.
Small-, mid- and micro-cap companies may be hindered as a result of limited resources or less diverse products or services and have therefore historically been more volatile than the stocks of larger, more established companies.
When referring to being “overweight” or “underweight” relative to a market or asset class, RiverFront is referring to our current portfolios’ weightings compared to the composite benchmarks for each portfolio.
RiverFront Investment Group, LLC (“RiverFront”), is a registered investment adviser with the Securities and Exchange Commission. Registration as an investment adviser does not imply any level of skill or expertise. Any discussion of specific securities is provided for informational purposes only and should not be deemed as investment advice or a recommendation to buy or sell any individual security mentioned. RiverFront is affiliated with Robert W. Baird & Co. Incorporated (“Baird”), member FINRA/SIPC, from its minority ownership interest in RiverFront. RiverFront is owned primarily by its employees through RiverFront Investment Holding Group, LLC, the holding company for RiverFront. Baird Financial Corporation (BFC) is a minority owner of RiverFront Investment Holding Group, LLC and therefore an indirect owner of RiverFront. BFC is the parent company of Robert W. Baird & Co. Incorporated, a registered broker/dealer and investment adviser.
To review other risks and more information about RiverFront, please visit the website at riverfrontig.com and the Form ADV, Part 2A. Copyright ©2024 RiverFront Investment Group. All Rights Reserved. ID 4938451
Read more commentaries by Riverfront Investment Group