Key takeaways:
- S&P 500 Index sectors focused on growth, stability, and defense have grown from about 60% of the index in 2014 to roughly 74% today. Meanwhile, cyclical sectors have shrunk from roughly 40% to 26%.
- U.S. large-cap market multiples are higher than in recent history, but it is worth noting that the mix of industries within major indexes has shifted toward faster-growing, more profitable sectors that typically command higher multiples.
- Fundamentals are helping to support current valuations: The gap in profitability between growth and value indexes has widened over time, helping explain why the valuation gap has grown as well.
The market has become much less cyclical over time, and valuations have increased alongside growth and quality.

The S&P 500® Index looks very different today than it did a decade ago. Sectors focused on growth, stability, and defense1 have grown from about 60% of the index in 2014 to roughly 74% today. Meanwhile, cyclical sectors2 have shrunk from roughly 40% to 26%.
Energy offers a stark example of shifts in market composition: its weight in the S&P 500 has fallen from approximately 11% in 2014 to about 3% today. The bottom line is that the S&P 500 has become growthier, and market valuations have risen accordingly.
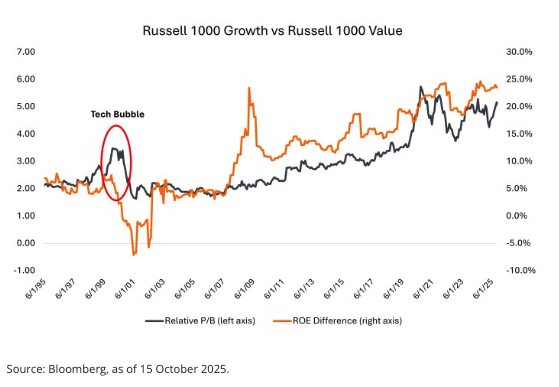
The chart above compares large-cap growth and value indexes on two key measures: valuation (price-to-book ratio, shown on the left axis) and quality (return on equity, shown on the right axis). The comparison highlights a key difference in today’s market versus the tech bubble of 2000.
Growth stocks trade at a wide valuation (price-to-book) premium to value stocks today, but there is a crucial difference from 2000: Fundamentals are helping to support current valuations.
The gap in profitability (return on equity) between growth and value indexes has widened over time, helping explain why the valuation gap has grown as well. Since 2002, increases in price-to-book ratios have been matched by comparable increases in return on equity. During the 2000 tech bubble, by contrast, growth valuations surged without any fundamental support.
Source and definitions
1 Growth, stability and defense sectors represented by technology, communication services, health care, consumer staples, consumer discretionary, utilities, and real estate.
2 Cyclical sectors represented by financials, industrials, materials, and energy.
Return on Equity (ROE) is the measure of a company’s annual return (net income) divided by the value of its total shareholders’ equity, expressed as a percentage. The number represents the total return on equity capital i.e., the profits made for each dollar from shareholders’ equity.
Price-to-Book (P/B) Ratio measures share price compared to book value per share for a stock or stocks in a portfolio.
S&P 500® Index reflects U.S. large-cap equity performance and represents broad U.S. equity market performance.
Russell 1000® Growth Index reflects the performance of U.S. large-cap equities with higher price-to-book ratios and higher forecasted growth values.
Russell 1000® Value Index reflects the performance of U.S. large-cap equities with lower price-to-book ratios and lower expected growth values.
The opinions and views expressed are as of the date published and are subject to change. They are for information purposes only and should not be used or construed as an offer to sell, a solicitation of an offer to buy, or a recommendation to buy, sell or hold any security, investment strategy or market sector. No forecasts can be guaranteed. Opinions and examples are meant as an illustration of broader themes, are not an indication of trading intent and may not reflect the views of others in the organization. It is not intended to indicate or imply that any illustration/example mentioned is now or was ever held in any portfolio. Janus Henderson Group plc through its subsidiaries may manage investment products with a financial interest in securities mentioned herein and any comments should not be construed as a reflection on the past or future profitability. There is no guarantee that the information supplied is accurate, complete, or timely, nor are there any warranties with regards to the results obtained from its use. Past performance is no guarantee of future results. Investing involves risk, including the possible loss of principal and fluctuation of value.
Asset Backed Lending involves loans secured by assets, where the loan value is based on the value of the collateral offered. Asset backed lending carries risks such as collateral depreciation, borrower default, and potential liquidity constraints during market downturns.
Janus Henderson® and any other trademarks used herein are trademarks of Janus Henderson Group plc or one of its subsidiaries. © Janus Henderson Group plc.
A message from Advisor Perspectives and VettaFi: Discover something new! Click here to register for our upcoming webcasts.
© Janus Henderson Investors
Read more commentaries by Janus Henderson Investors