In this new series, Chuck Carnevale, co-founder of FAST Graphs and widely known as “Mr. Valuation”, begins the process of constructing a F.I.R.E. Dividend Growth Portfolio from the ground up. F.I.R.E., which stands for Financial Independence, Retire Early, is built on the idea of creating enough growing income to eventually support early retirement. For dividend growth investors, that means identifying businesses that combine quality, valuation, earnings power, and predictable dividend growth. Today it’s screening for dividend growth.
What This Series Aims to Do
Chuck’s goal is simple: use FAST Graphs’ screening and analytical tools to build a diversified portfolio of 20 to 25 high-quality dividend growth companies with attractive starting yields and long-term income growth potential.
This first installment (Part 1) focuses on the screening process—how to narrow down thousands of publicly traded companies into a focused list of stocks that fit the F.I.R.E. income-building blueprint.
Step 1: Building the Dividend Growth Screen
Using FAST Graphs, Chuck creates a custom screen designed to find companies that demonstrate strong dividend growth characteristics without sacrificing valuation discipline. His starting parameters include:
Dividend per Share CAGR: ≥ 8%
Credit Rating: BBB– or higher (ensures investment-grade quality)
Estimated Earnings Growth: ≥ 8%
Dividend Yield: ≥ 0% (later refined upward)
Earnings Yield: ≥ 6% (roughly P/E ≤ 16)
These criteria are intentionally balanced—they’re strict enough to filter out low-quality companies but flexible enough to produce a usable starting list.
The initial screen returns 46 companies, many of which are recognizable dividend growers with long histories of raising their payouts.
Step 2: Understanding the Range of Candidates
Within the list, estimated earnings growth spans from around 8% to over 30%, while dividend yields range from 0.5% to nearly 6%. Chuck emphasizes that while total return matters, the focus of this exercise is sustainable dividend growth, which fuels rising retirement income for F.I.R.E. investors.
This leads to one of his core principles: the most consistent and reliable line on almost any FAST Graphs chart is the dividend line. Earnings can fluctuate, and prices can be volatile, but quality dividend-paying companies tend to maintain steady upward dividend trends—even during tough periods.
Step 3: Narrowing the List by Desired Yield
Chuck demonstrates how adjusting the yield requirement tightens the list:
Yield ≥ 1% → 44 companies
Yield ≥ 2% → 33 companies
Yield ≥ 3% → 21 companies
Why adjust the yield? Because the needed starting yield depends on the investor’s specific income objectives.
For example:
A portfolio with a 3% starting yield on $2 million produces $60,000 in annual income.
A portfolio needing 4–5% would require different stock selections or blended allocations.
Chuck will eventually blend higher-yield/lower-growth stocks with lower-yield/higher-growth names to create an optimal combination of starting income and future income growth.
Step 4: Reviewing Companies Individually
Screening is only the first step. Chuck shows that each company must be evaluated individually using FAST Graphs’ historical and forecasting tools.
He previews this process by reviewing several examples:
Archer Daniels Midland (ADM) – A cyclical company with volatile earnings and price swings, but a stable and steadily rising dividend line.
American Financial Group – A high-quality financial with strong expected returns and a history of delivering special dividends.
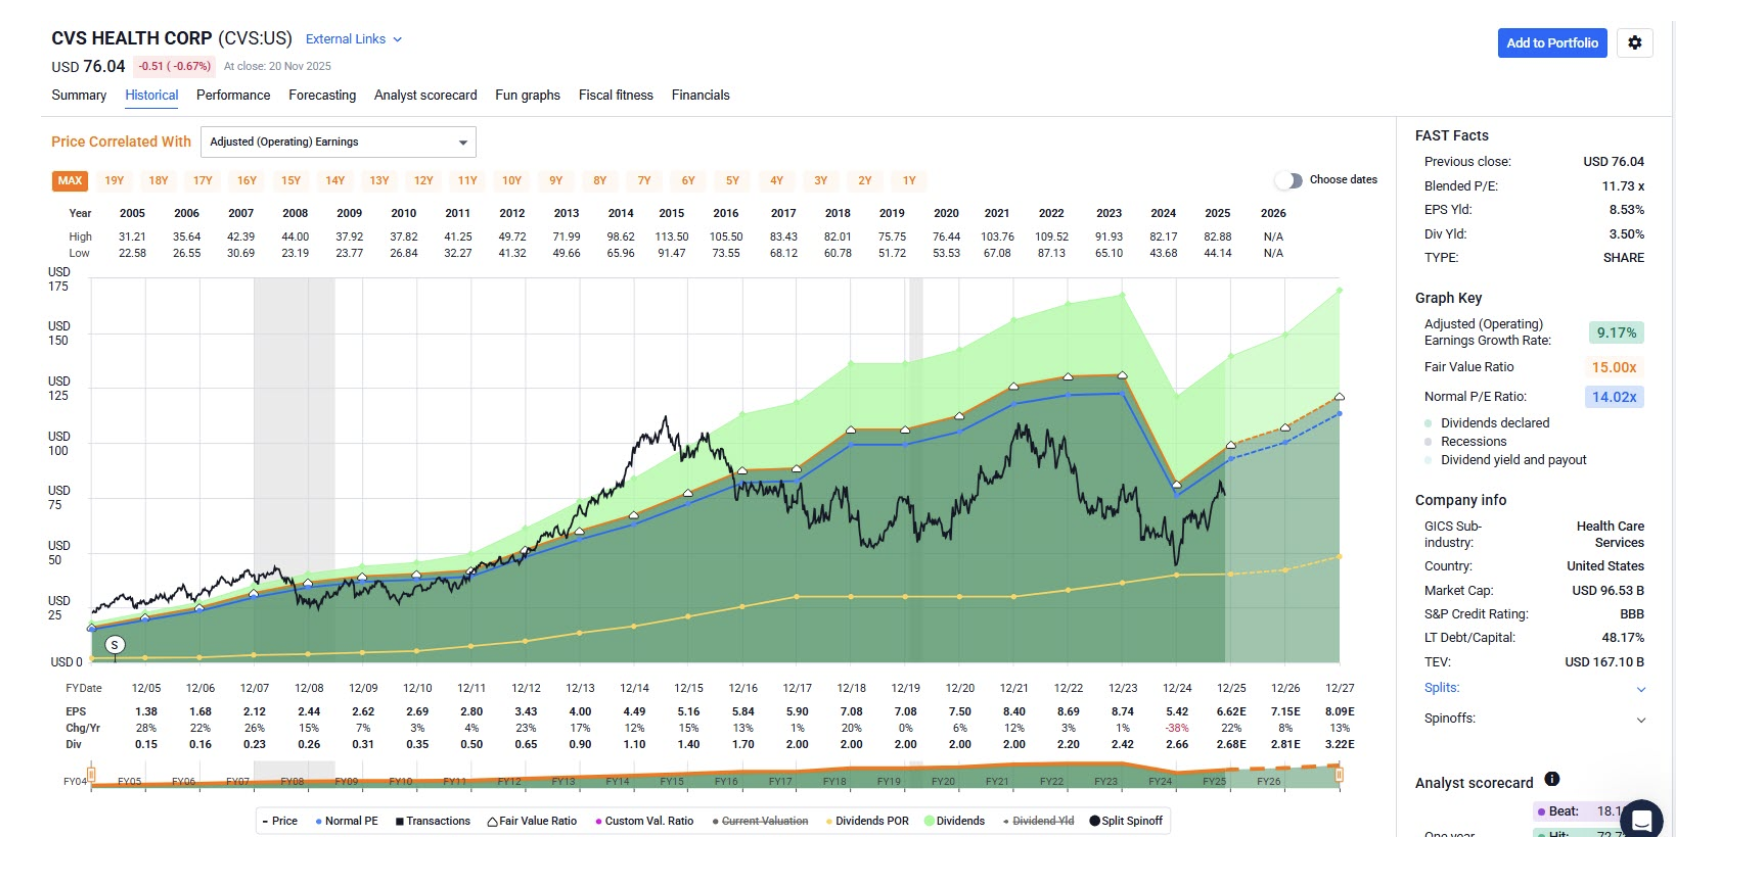
CVS – A well-known healthcare retailer with recent operational struggles, yet a solid dividend that continues to grow modestly.
Each chart helps determine whether a stock fits the portfolio based on valuation, quality, dividend reliability, and growth potential.
Step 5: Valuation Matters—Even in a Bull Market
Chuck also compares these stocks to the broader market by examining the FAST Graphs chart of the S&P 500 (SPY). He highlights that today’s market is trading near the upper end of its historical valuation range, with the index priced well above intrinsic value levels (the orange line).
This demonstrates why screening for value—especially earnings yield—matters. In expensive markets, opportunities become scarce, and disciplined selection becomes even more important.
What Comes Next in the Series
Part 1 is about building and refining the candidate pool. Over the next installments, Chuck will:
Evaluate each stock one by one
Select 20–25 companies for the F.I.R.E. Dividend Growth Portfolio
Enter the portfolio into FAST Graphs’ Portfolio Management tool
Track dividend income, valuation, growth, and total return over time
Provide periodic public updates
He even hints that stocks like KeyCorp, which offer strong yields, investment-grade ratings, and good growth prospects, will likely make the final list.
Final Thoughts
This series shows exactly how an experienced fundamental analyst uses FAST Graphs to build a dividend growth portfolio with real-world constraints. The combination of valuation discipline, dividend reliability, and forward growth expectations forms the foundation of Chuck’s process.
Disclosure: Long ADM, CVS, KEY
Disclaimer: The opinions in this document are for informational and educational purposes only and should not be construed as a recommendation to buy or sell the stocks mentioned or to solicit transactions or clients. Past performance of the companies discussed may not continue and the companies may not achieve the earnings growth as predicted. The information in this document is believed to be accurate, but under no circumstances should a person act upon the information contained within. We do not recommend that anyone act upon any investment information without first consulting an investment advisor as to the suitability of such investments for his specific situation.
A message from Advisor Perspectives and VettaFi: Are you backed by institutional quality bond funds? Click here to learn more.