There are hundreds of technical indicators that market analysts track, but only one gets a live television chyron the moment it breaks. The 200-day moving average (200-DMA) is the single most widely followed technical level in global financial markets, and the reason isn’t mystical; it’s institutional. Quant funds, pension allocators, programmatic traders, systemic funds, and risk managers embed this level directly into their models. When the S&P 500 closes below it, automated selling activates from desks that have nothing to do with earnings or fundamentals.
Combine that selling pressure with Friday’s massive options expiration, and you get a sell-off that sent investors home in tears after last week’s close. However, the math behind it is simple, as it is just the average closing price over the previous 200 trading sessions, or 40 weeks, or 10 months of market history. When the price trades above the 200-day average, it suggests the long-term trend is rising. When the price falls below, the long-term trend is deteriorating. Since 1950, the S&P 500 has traded above its 200-dma during 71% of all trading sessions, and average annual returns during those above-average periods are meaningfully higher than during sessions spent below it.
Last week, on March 19th, the S&P 500 closed below its 200-DMA for the first time since May 2025. The first instinct is to panic as media headlines talk about bear markets and financial crisis events. However, as we will explore today, the data says it depends entirely on the type of break: sustained or brief. Therefore, the crucial question for investors is never “did the market break the 200-DMA?” The right question is “what kind of break is this?” A declining 200-dma, a deteriorating credit backdrop, and a Fed still tightening look nothing like a bull market where the Fed is cutting rates, forward earnings expectations are strong, and the economy is still stable. Treating them the same is the kind of selective statistics that gets retail investors in trouble.
We will examine both types of events, and you can draw your own conclusions.
The Seven Times It Was The Start Of A Bear Market
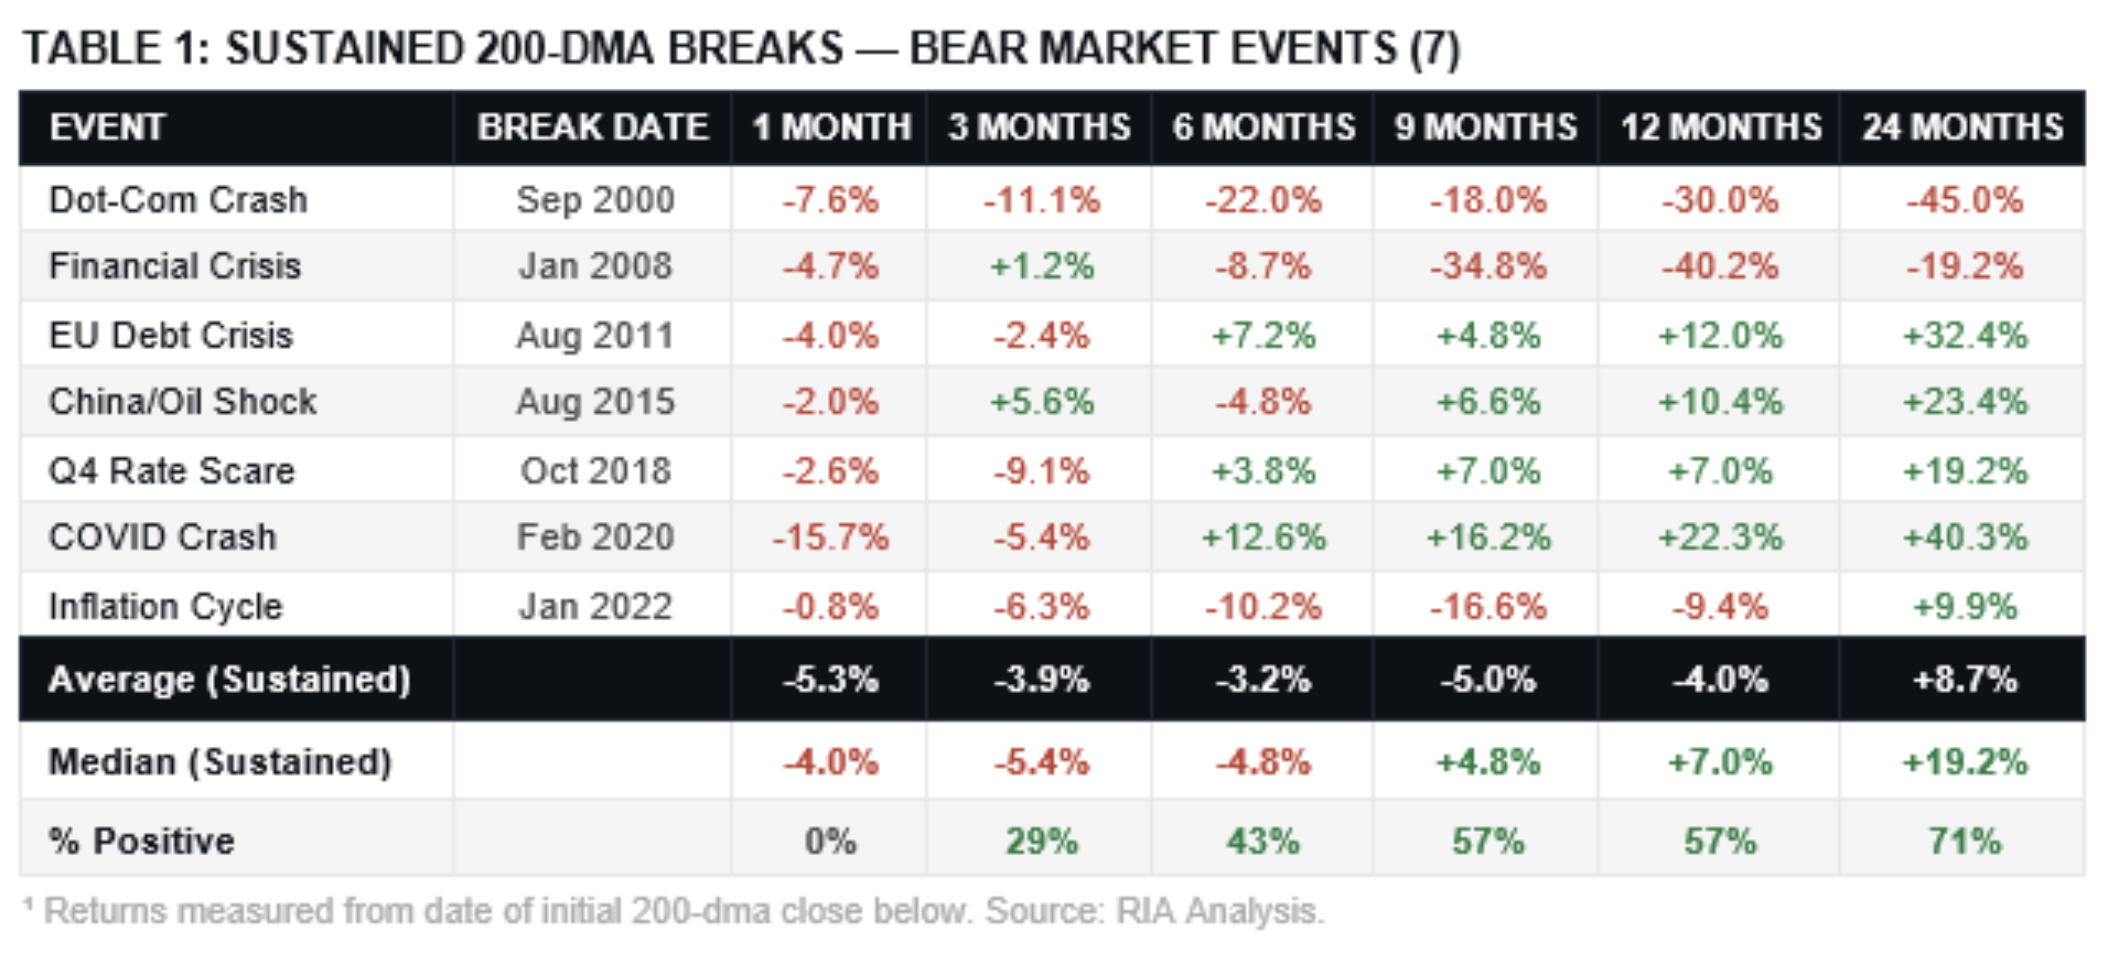
Since 2000, we have identified 7 instances in which the S&P 500 broke below its 200-DMA on a sustained basis. The most notable, shown in the table below, were the Dot-com crash in 2000 and the Financial Crisis in 2008. However, there were several other, more “minor,” at least compared to the first two events, that occurred. The EU debt scare in August 2011 and the China and oil shock in August 2015 were fairly short. Following those were the Q4 2018 rate scare and the COVID crash in February 2020. In both cases, the Federal Reserve interventions reversed the break rather quickly. The longer-lasting event was the inflation cycle that began in January 2022, which lasted 9 months.
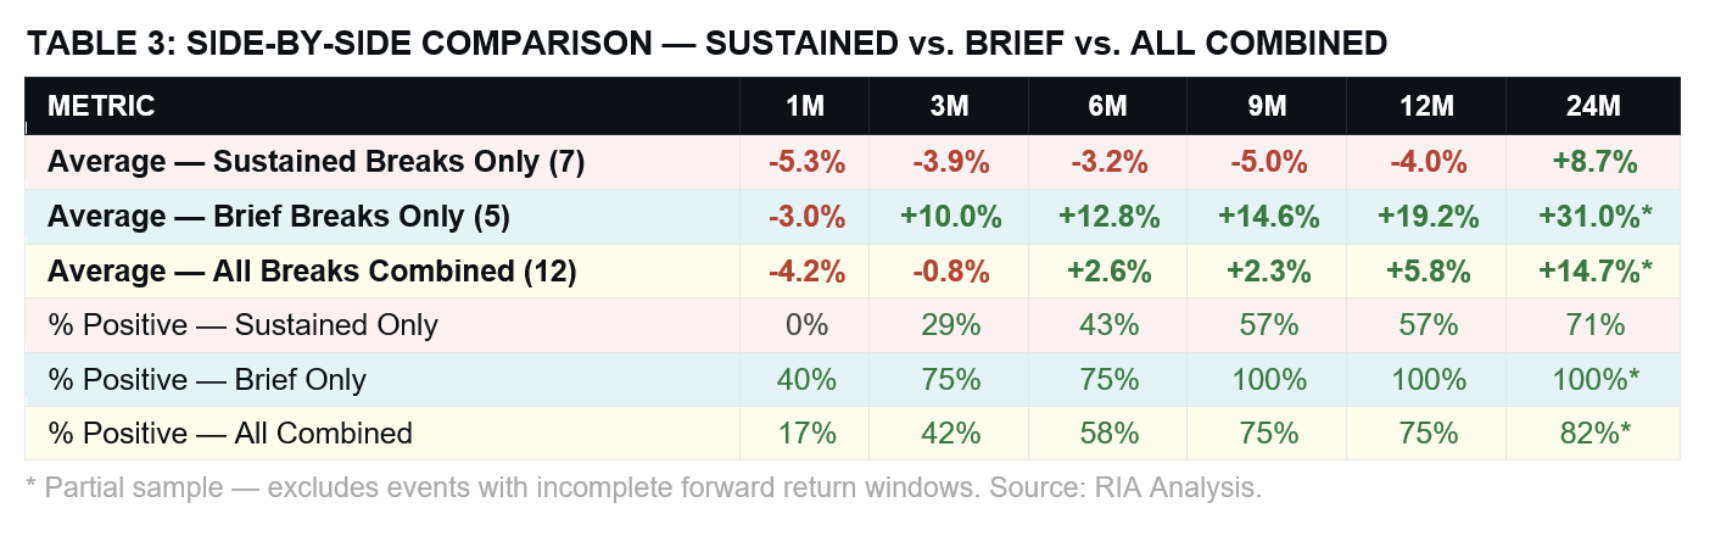
The performance numbers across those seven events are unambiguous. The average one-month return after the break: -5.3%. The average 12-month return: -4.0%. Not a single one of those seven events posted a positive first-month return. Zero for seven. Investors who bought the initial 200-dma break in 2000 and 2008 were still underwater two full years later.

What defined every sustained break was what was happening beneath the index long before price confirmed it. In 2000, the Fed had already tightened aggressively, and valuations sat at historic extremes. Then, in 2008, credit markets were seizing, and the banking system was effectively insolvent. In 2022, the Fed was tightening at the fastest pace in 40 years into a market still priced for zero rates. The 200-dma break in each case confirmed a trend that had already shifted. It wasn’t the starting gun. It was the final whistle.
Five Breaks Where The Bears Were Wrong
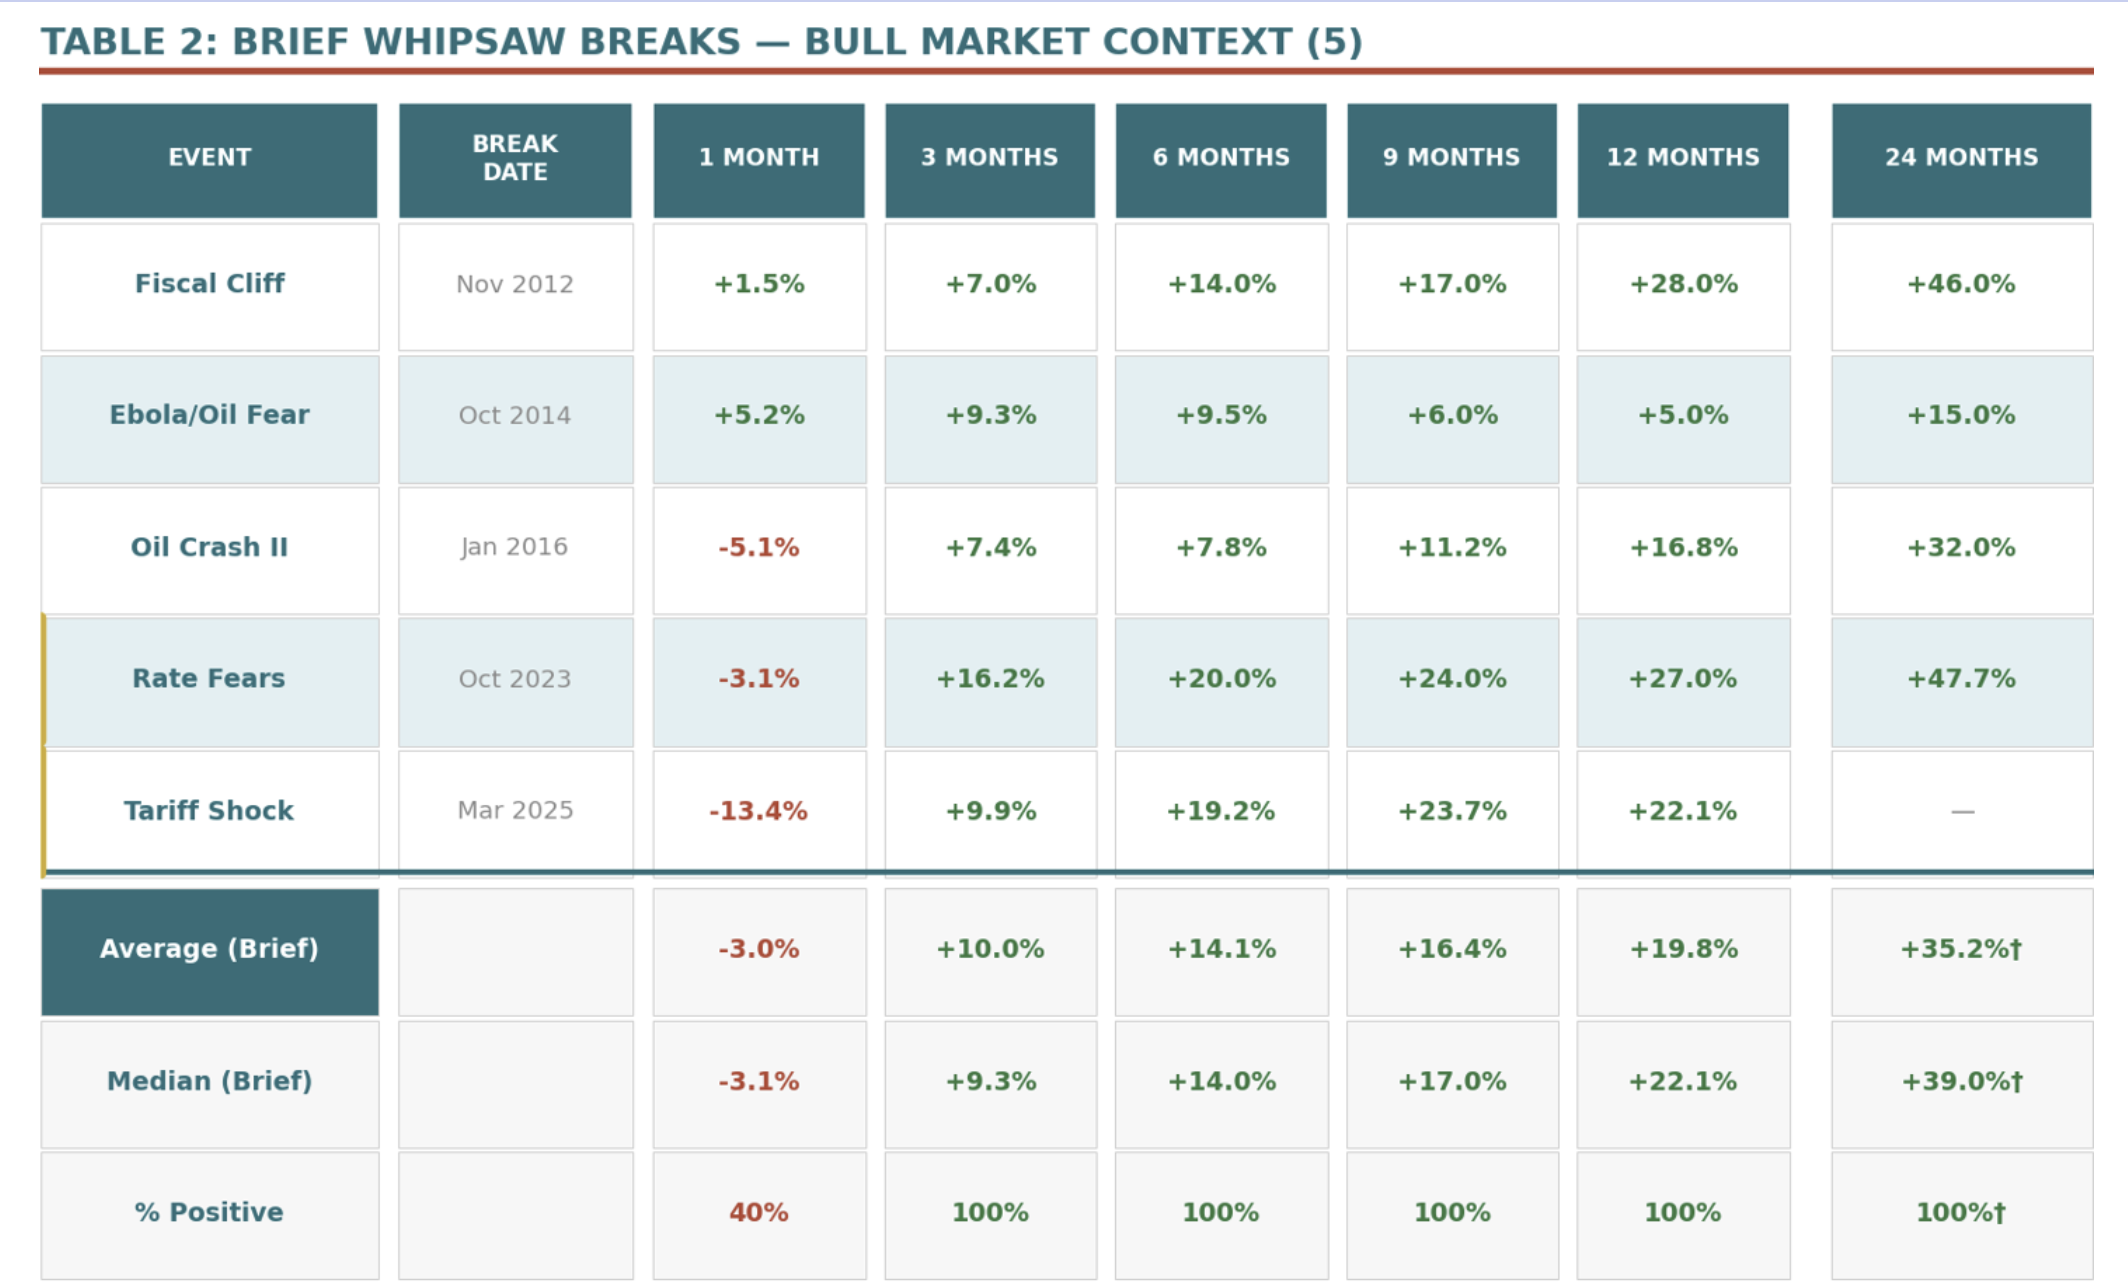
Between those seven sustained breaks, the index also crossed below the 200-dma on five additional occasions. Notably, in every single case, the market recovered quickly and then launched sharply higher. The fiscal cliff panic in November 2012 and the Ebola and oil scare in October 2014 lasted only days. The second China devaluation and oil collapse in January 2016 lasted just one month. The 10-year yield spike in October 2023 and the Liberation Day tariff shock in March 2025 were also false breaks.
The numbers from those five events stand in stark contrast to the sustained breaks. Average 12-month return: +19.8%. The 2012 fiscal cliff break recovered so fast that the market returned over 28% over the following year. The October 2023 break reclaimed the 200-dma within weeks and ran +27.0% over 12 months. Crucially, once you get past the first month, every single brief whipsaw event posted positive returns at 3, 6, 9, and 12 months. The hit rate is 100% for investors who didn’t panic-sell on those breaks. For those who did, it was among the most expensive decisions made in those market cycles.
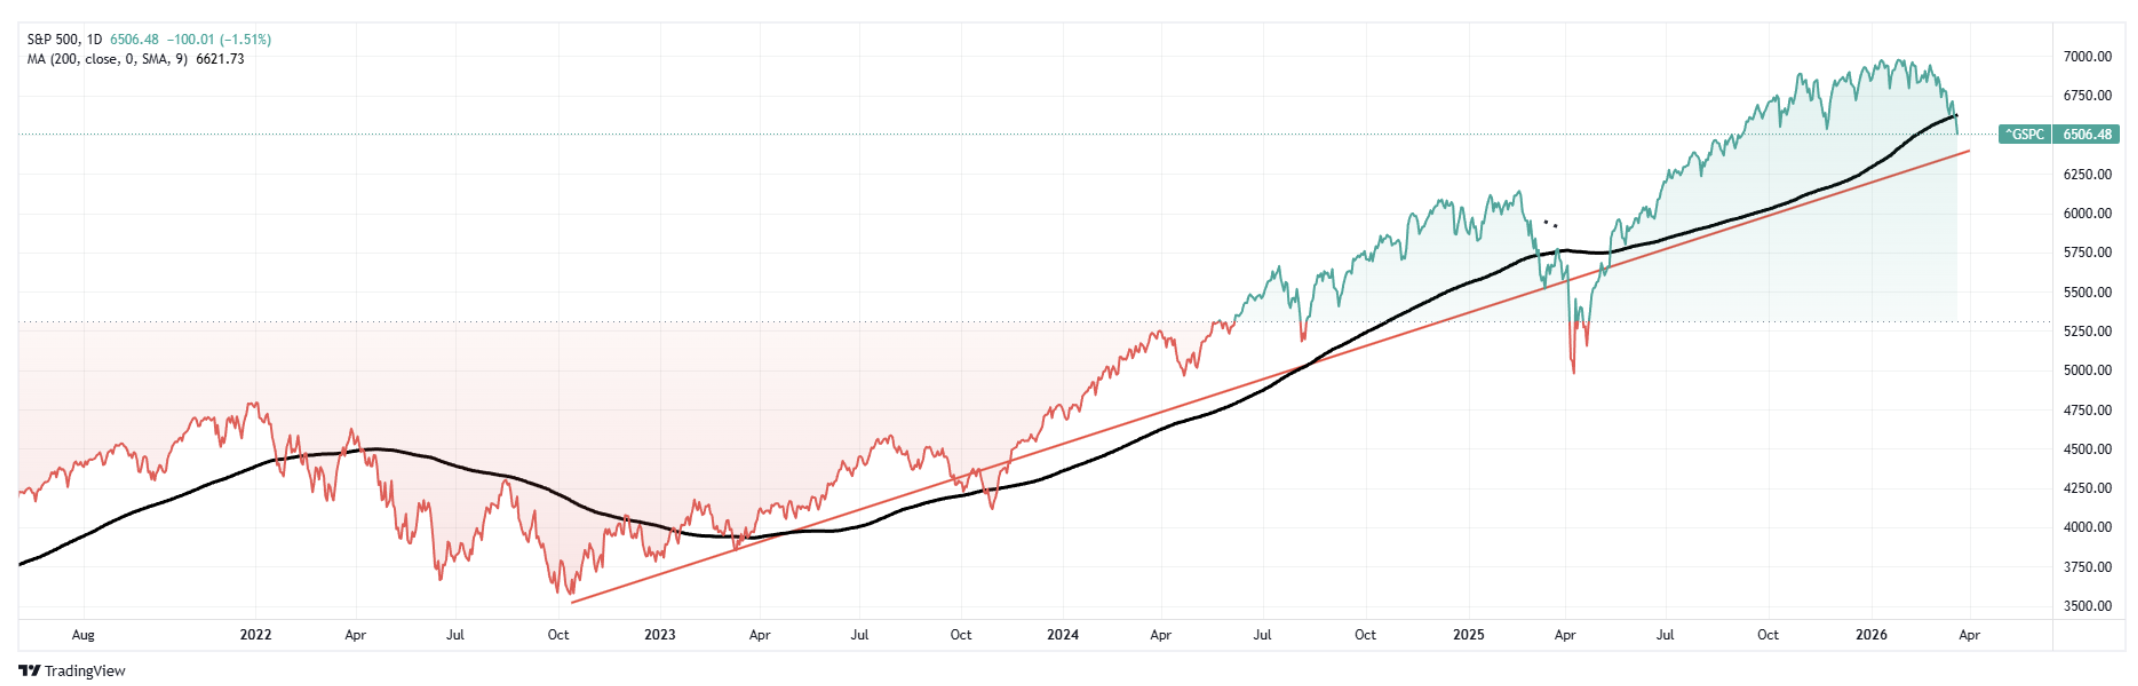
The structural difference is what matters most. In every brief break, the 200-dma was still rising or flat when the price crossed below it. The long-term trend hadn’t broken as a sentiment shock had temporarily pushed the price below an intact baseline. Fear was already extreme at the moment of the break, which meant the contrarian setup was already in place. As shown, the 200-DMA is still rising, and the long-term trend remains intact.
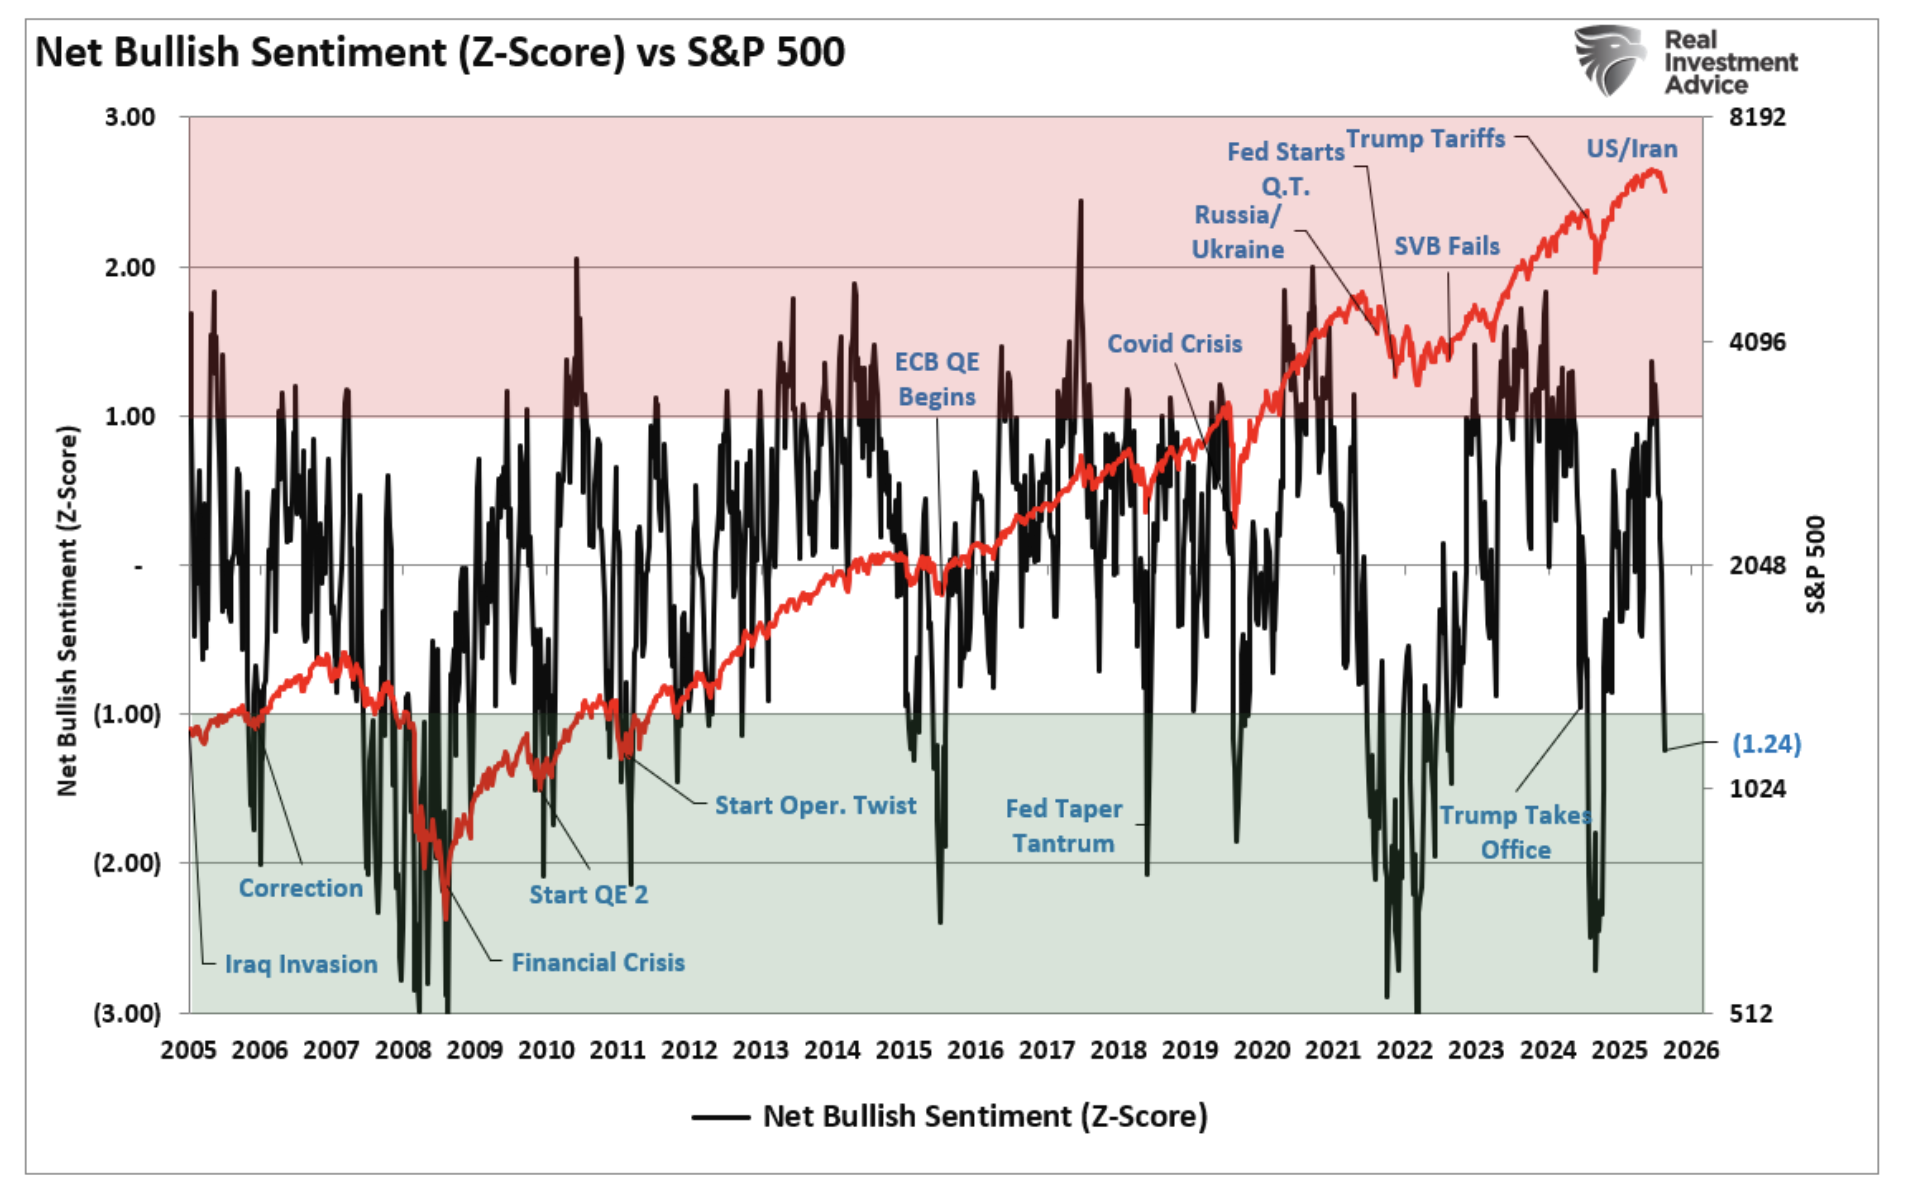
From a sentiment perspective, investor bearishness is rising rapidly.
With that in mind, just remember that:
“The 200-dma break is not a verdict. It’s a question. The answer depends on whether the trend was already broken before price got there.”
Six Indicators To Determine The Difference
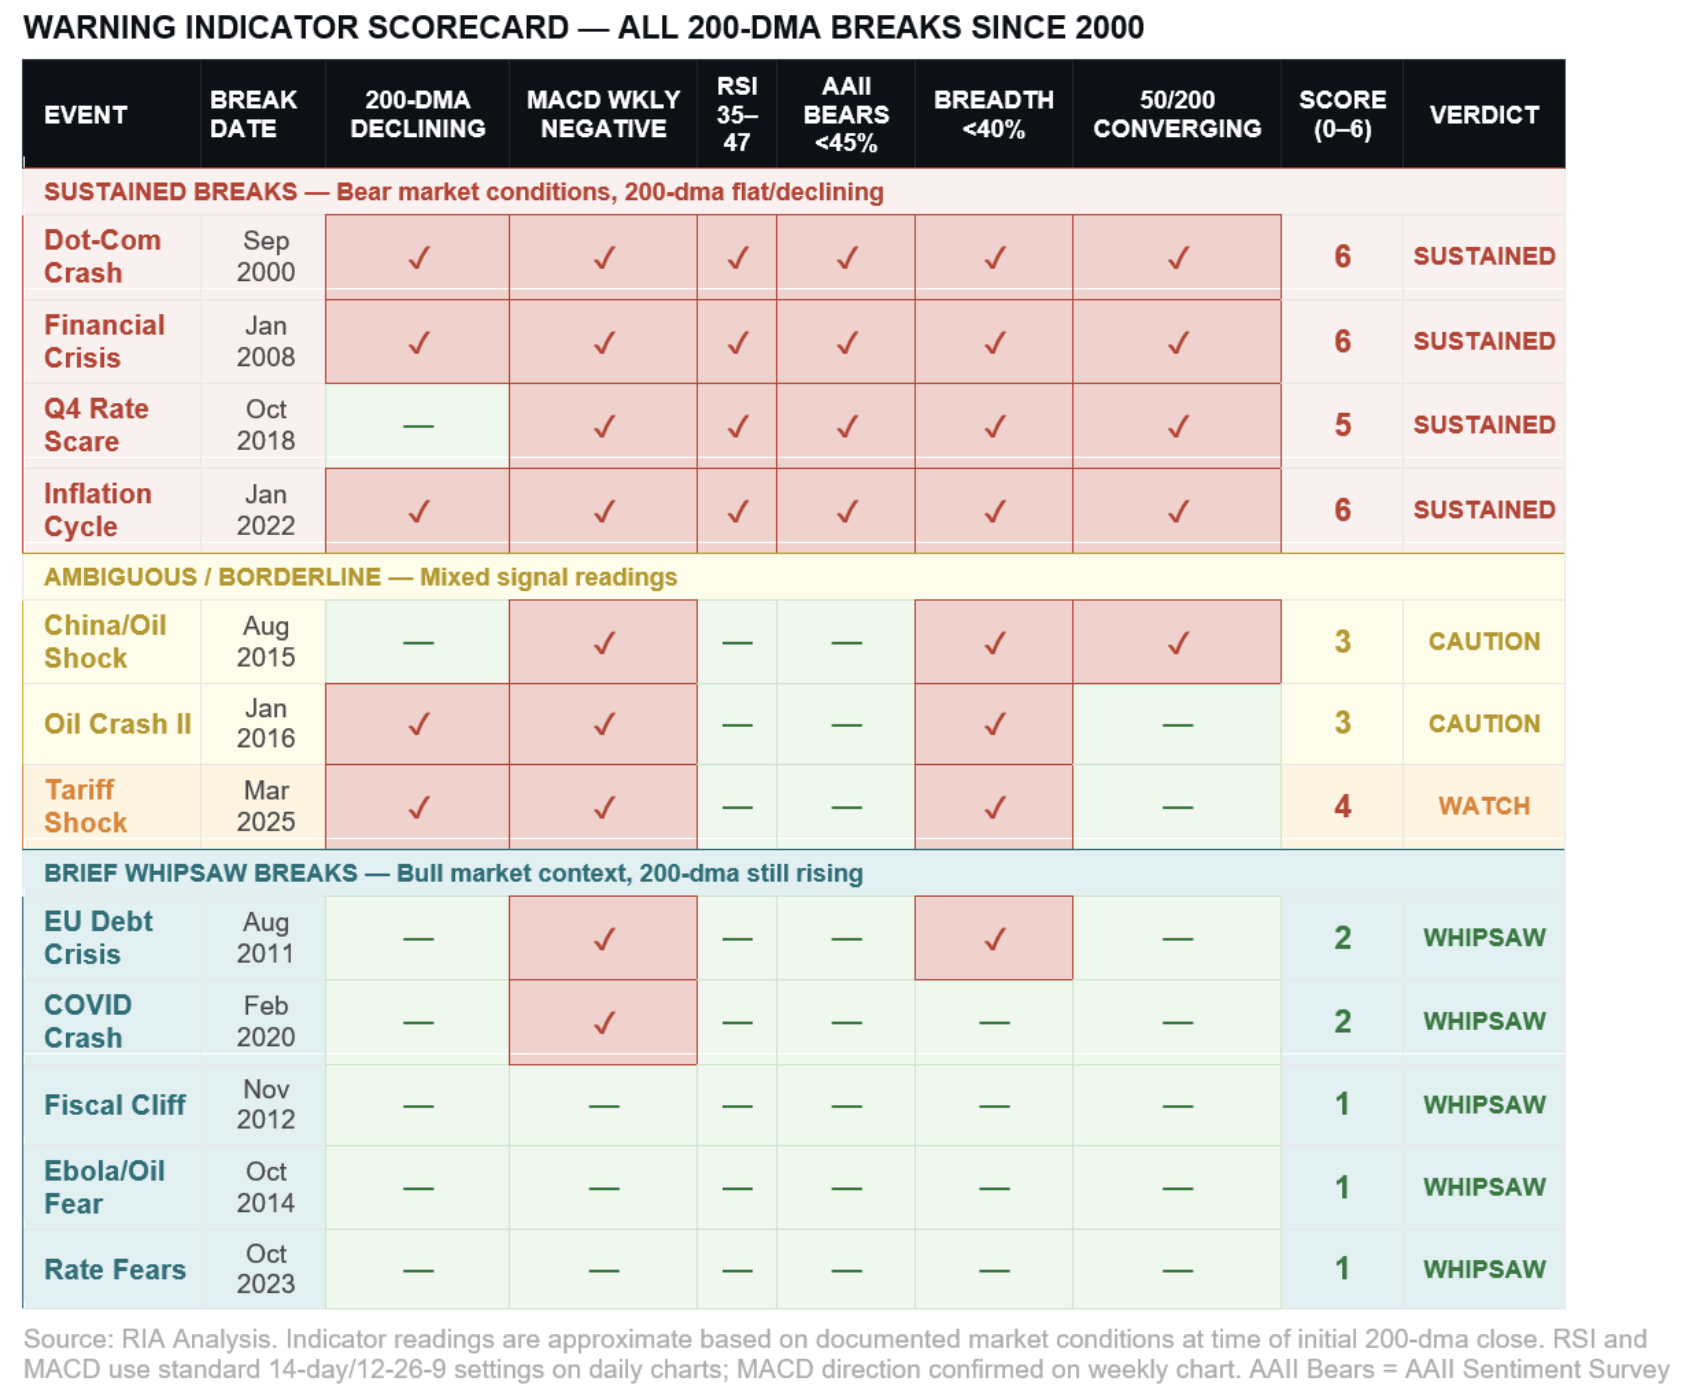
So, how are you supposed to know the difference between a “sustained” break of the 200-DMA and a “brief” one that is buyable? Good question. After studying all 12 events, six technical and sentiment indicators consistently distinguished sustained breaks from whipsaws. No single indicator was a perfect classifier. But when three or more were fired simultaneously, the result was almost always a sustained decline. When zero or one fired, the break almost always reversed.
- The direction of the 200-dma itself is the most powerful signal. When the average was already flat or declining before the price crossed it, the break was sustained in every serious case — 2000, 2008, 2022. When the 200-dma was still rising, the break was almost always a whipsaw.
- The weekly MACD at the point of the break tells you whether momentum had already shifted at a structural level. In sustained breaks, the weekly MACD had turned negative weeks before the index confirmed the break. In whipsaws, it was barely negative or still positive.
- RSI at the break works in a counterintuitive direction. A deeply oversold reading (below 32) at the moment of the 200-dma break signals that fear has already capitulated, and the break is likely a buying opportunity. RSI in the mid-range (35 to 47) at the break means the market isn’t oversold enough. There’s more air below.
- AAII Bears, the weekly sentiment survey from the American Association of Individual Investors, functions as a contrarian gauge. When the AAII bearish reading was above 45% at the time of the break, the signal was bullish. In other words, there was too much pessimism, not enough optimism. When bears were under 40%, investors weren’t scared enough, and the market had further to fall.
- Market breadth — the percentage of S&P 500 members trading below their 200-day averages confirmed whether the index-level break reflected genuine internal deterioration. When breadth had already fallen below 40% before the index itself broke, the damage was broad-based. Whipsaw events typically showed breadth still healthy at 60% or higher.
- 50-dma convergence toward the 200-dma, signaling an impending death cross, confirmed the medium-term trend had already shifted. This fired in 2000, 2008, 2022, and the Q4 2018 event — none of which produced quick recoveries.
So, last week, the market broke the 200-day moving average. As of this writing, the scorecard is still developing, but only 2 of 6 indicators are firmly in the “sustained” break territory.
- The 200-DMA is still rising. (Bullish)
- The weekly MACD has turned lower. (Bearish)
- RSI (relative strength index) is below 32 (Bullish)
- AAII Bearish sentiment is at 52%, well above the 45% threashold. (Bullish)
- Market breadth shows just 46% of stocks trading above their 200-DMA (Bearish)
- The 50-DMA has flattened out but is not signaling an impending “death cross.” (Bullish)
These measures may change as the correction process continues, so careful monitoring is needed.
Personally, I suspect we are more likely in the “CAUTION” zone than the more immediate “WHIPSAW.” Of course, much of this will depend on the speed of the resolution of the current Iran conflict.
The 200-DMA Is Broken: What Should Investors Do?
As noted, my personal feeling, and I may be wrong, is that we are more in a “CAUTION” zone, rather than a “SUSTAINED” break, more aligned with a more significant corrective event. As shown in the comparative table below, understanding the difference between a sustained break of the 200-dma and one that wasn’t was critical to future returns.
Two of the three cleanest signals are active. The 200-dma remains upward sloping for now; however, the weekly MACD turned negative before the price confirmed the break. Breadth has also deteriorated significantly in the weeks leading up to today, the break. But as noted above, with the RSI already in the low-30s and a spike in bearish sentiment, this historically suggests fear is acute. At a minimum, those two measures suggest that a reflexive rally is likely, allowing investors to rebalance portfolio risks.
Most crucially, the honest interpretation is that this is not 2008. It may not even be 2022. But it’s not November 2012 either. So be cautious, as data from comparable setups, like 2015 and Q4-2018, shows a market that eventually recovered but typically found a lower low first. The goal isn’t to go to cash and wait. It’s to reduce the cost of being wrong while staying positioned for the recovery when it arrives.
- Trim the most extended positions, not the entire portfolio. Reduce concentration in your highest-valuation, highest-conviction holdings by 20 to 30 percent. You’re not betting against recovery — you’re limiting the damage from a potential 12 to 15 percent further drawdown before the low is confirmed.
- Build cash to roughly 10-15 percent. Cash isn’t a long-term strategy, but it’s a short-term option on the future. Dry powder lets you add exposure when a lower low is confirmed rather than being fully deployed into a market still searching for its floor.
- Rotate from growth to quality. Favor companies with durable free cash flow, strong balance sheets, and pricing power over high-multiple, low-visibility growth names. The quality factor has historically outperformed in the 3 to 9 months following score-3 and score-4 environments by a meaningful margin.
- Add selective defensive sector exposure. A modest 10 to 15 percent shift toward healthcare, consumer staples, or utilities lowers your portfolio’s beta without abandoning equities. Think of it as buying insurance before the next storm, not after.
- Tighten stop-losses on cyclicals and high-beta names. Rather than selling outright, define your risk explicitly. Set trailing stops at 7 to 10 percent below current levels on consumer discretionary, industrials, and small-cap positions. If the market recovers, you participate. If the score moves toward 5 or 6, the stops do the work without an emotional decision, sending the tape into a fall.
- Extend bond duration modestly. A shift from very short-duration cash to intermediate Treasuries in the 5- to 7-year range provides yield and potential capital appreciation if growth fears accelerate. This is a hedge, not a pivot.
Most importantly, watch the 200-dma slope, not just the price. If, over the next four to six weeks, the 200-dma continues to decline while price stays below it, the score upgrades to a much more bearish outlook. At that point, the playbook shifts to a meaningful defense position. If price reclaims the 200-dma cleanly and slope stabilizes, the score retreats, and the playbook will flip to adding exposure.
Set a calendar reminder for four weeks from today and re-run the scorecard. The signal will tell you what to do next.
Lance Roberts is a Chief Portfolio Strategist/Economist for RIA Advisors. He is also the host of “The Lance Roberts Podcast” and Chief Editor of the “Real Investment Advice” website and author of “Real Investment Daily” blog and “Real Investment Report“. Follow Lance on Facebook, Twitter, Linked-In and YouTube Customer Relationship Summary (Form CRS)
Join RIA Advisors and elevate your career within a deeply experienced team focused on innovation. Our collaborative environment is built on a foundation of advanced technology and effective investment models, designed to enhance your ability to serve clients and grow your practice. Benefit from a supportive culture that encourages professional development and fosters a forward-thinking approach. By joining our team, you’ll be part of a group dedicated to excellence and continuous improvement, empowering you to focus on building meaningful client relationships and pursuing your business ambitions. Discover the advantages of working with our accomplished advisory team by starting your conversation today.
A message from Advisor Perspectives and VettaFi: Discover something new! Click here to register for our upcoming webcasts.
© Real Investment Advice
Read more commentaries by Real Investment Advice