2026 Mid-Year Outlook: U.S. Stocks and Economy
Membership required
Membership is now required to use this feature. To learn more:
View Membership BenefitsKey takeaways
- Economic growth is rebounding, but consumers are becoming strained by negative real wage growth, weak savings, and rising energy costs.
- Inflation remains sticky, with energy and artificial intelligence-driven capital expenditures (capex) adding to already elevated core services inflation.
- Earnings are driving the bull market, but market leadership is narrow and concentrated in artificial intelligence (AI) and energy-related sectors.
- Markets may be vulnerable to disappointment with stretched positioning, a thin equity risk premium, and rising bond yield pressure.
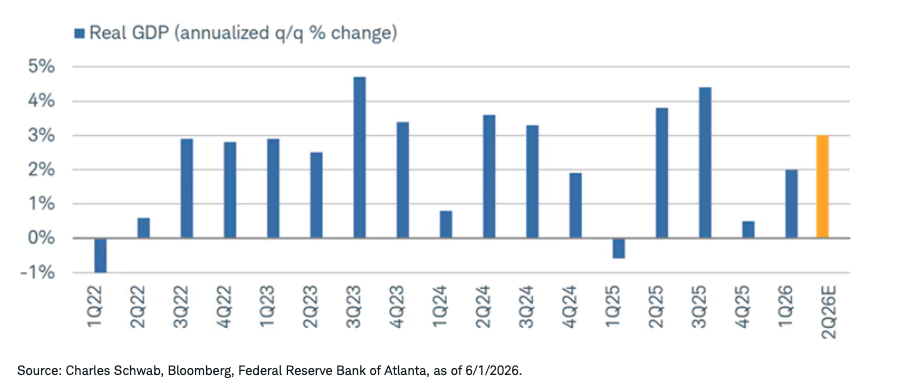
As is typically the case with our mid-year outlook, we like to take stock of the expectations we had at the beginning of the year when publishing our full-year outlook. Starting with the overall growth picture, one of the themes we had higher conviction on was a continued heavy lift from the private sector—namely, the ongoing expansion in the capital expenditures (capex) cycle related to artificial intelligence (AI). So far, that has played out to a healthy degree for headline economic growth. As shown below, real gross domestic product (GDP) growth has rebounded from its recent soft patch at the end of 2025 and is expected to look solid in the second quarter.
Read more: Washington: What to Watch Now
Per the nowcast from the Atlanta Fed's GDPNow model, real GDP growth is currently tracking at 3% (on a quarter-over-quarter annualized basis) in the second quarter. Importantly, a nowcast is not a forecast. The Atlanta Fed is not necessarily projecting a growth rate, but rather taking in data on a rolling basis and estimating what GDP is for the given quarter.
GDP continues to recover

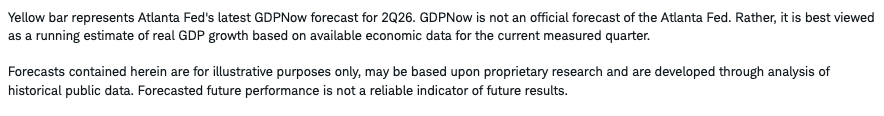
Since a good chunk of second-quarter data was still unavailable when this report was published, we think the current nowcast needs to be taken with a grain of salt—not least because of the current estimate for consumer spending. The chart below breaks out the key subcomponents of GDP and their contributions to growth. As shown, personal consumption is looking quite strong for the quarter but we think that could weaken further if higher energy prices persist and put more pressure on affordability.
Indeed, inflation-adjusted wage growth is currently in negative territory and the savings rate is about half of what it was right before the last meaningful inflation spike driven by Russia's invasion of Ukraine in 2022. Today's consumer—especially those populating the bottom part of the economy's K shape—is in a weaker spot. We don't expect affordability concerns to fade if the Strait of Hormuz remains effectively closed throughout the summer, mostly because of the likely persistence of higher energy prices.
GDP breadth improving
Despite real wage growth being negative, the main message from the labor market over the past year has been that a high and rising total number of nonfarm payrolls has mattered more than a slowdown in how many jobs are being created on a monthly basis (a differential we highlighted in our full year outlook). Our focus on layoff activity as a driver of labor views has thus far worked, as the labor market has shown signs of stabilization this year. We were, however, wrong on the slight upward pressure we expected for the unemployment rate. Labor weakness has continued in a rolling fashion at the industry level, not the broad economic level, leading to a relatively stable unemployment rate.
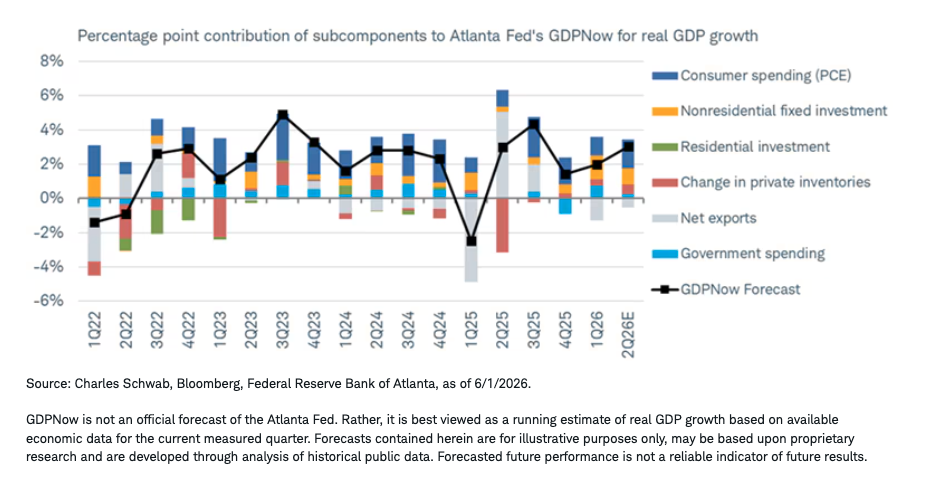
Looking to the back half of the year, we remain focused on layoff activity and will continue to let leading indicators like jobless claims and job postings drive our view. One gap worth monitoring, though, is the recent split between nonfarm payrolls (which come from the establishment survey) and household employment. As shown below, the latter has continued to weaken on a six-month average basis while the former has stabilized. At key turning points in economic cycles, household employment tends to be "right" in the end. We also recognize, though, that it's much more volatile than the establishment survey—even sending some false signals in 2024.
Another survey divergence
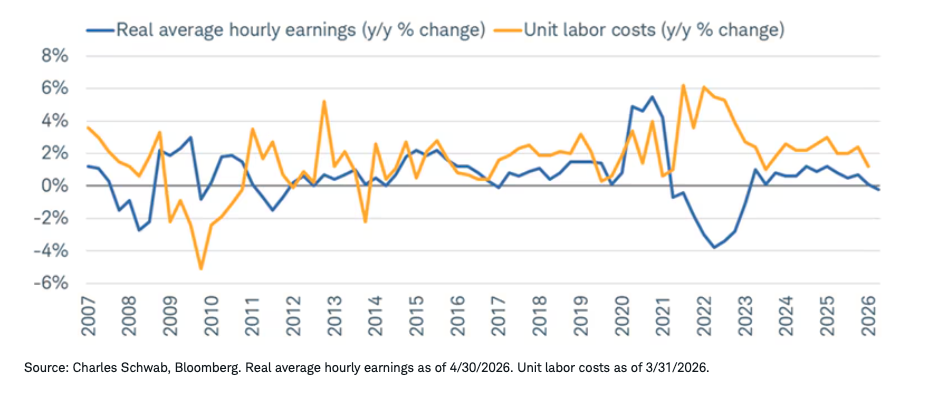
The recent decline in real wage growth is not nearly as bad as it was in 2022 and 2023 when the inflation rate was higher. However, consumers will continue to feel a pinch, especially because the pace of job creation today is well below where it was in the prior inflation shock. Not much about that is encouraging, but if there is a silver lining, it's that the labor market isn't generating much inflation pressure right now—which is a key difference from a few years ago. That can be seen via the easing in unit labor cost growth over the past year, shown via the orange line in the chart below.
Little labor inflation pressure
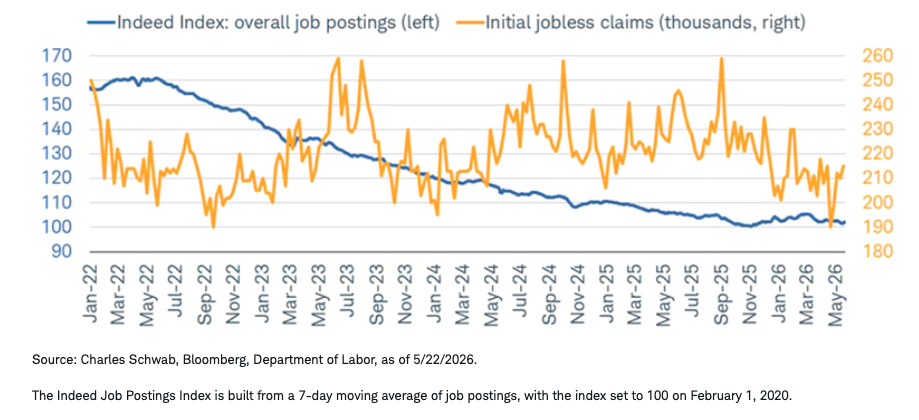
Unit labor cost growth can remain benign as long as the hiring environment stays in its lukewarm state. We continue to see a stagnant backdrop for labor demand, evidenced by the hiring rate being near a multi-decade low and job postings not rising much over the past six months (shown via the Indeed data in the chart below). Low initial jobless claims are normally consistent with a tight labor market, but in this unique cycle, they haven't been consistent with strong hiring activity. In short, we don't see the low-hire, low-fire backdrop dramatically changing in the back half of the year.
Low firing, barely any hiring
Inflation vs. "inflation"
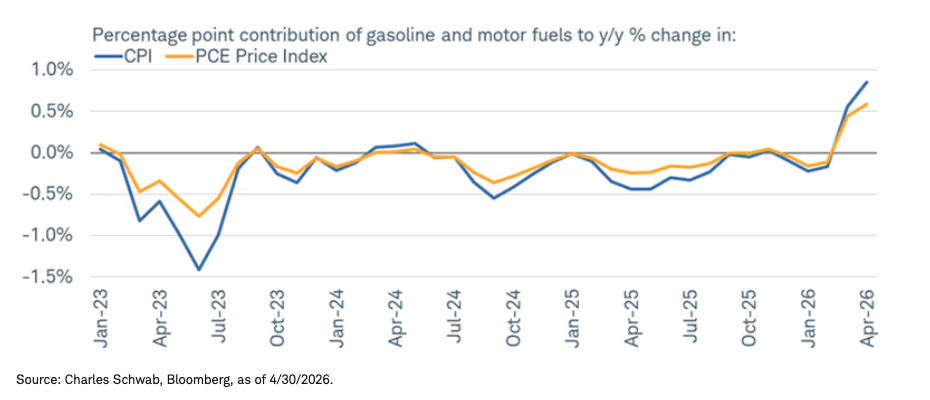
Coming into 2026, we expected inflation to be top of mind, albeit not as much on the energy front because—frankly—we did not have the United States-Iran war on our list of expectations. Needless to say, inflation has jumped to the top of the list of concerns, chiefly because of the rapid increase in energy's contribution to both the consumer price index (CPI) and personal consumption expenditures (PCE) price index (the Federal Reserve's preferred inflation gauge). As shown below, the jump is not only notable because of how much energy is now contributing to headline inflation, but also because of how stark a departure it is from the negative contributions over the past few years.
Energy's stark rise
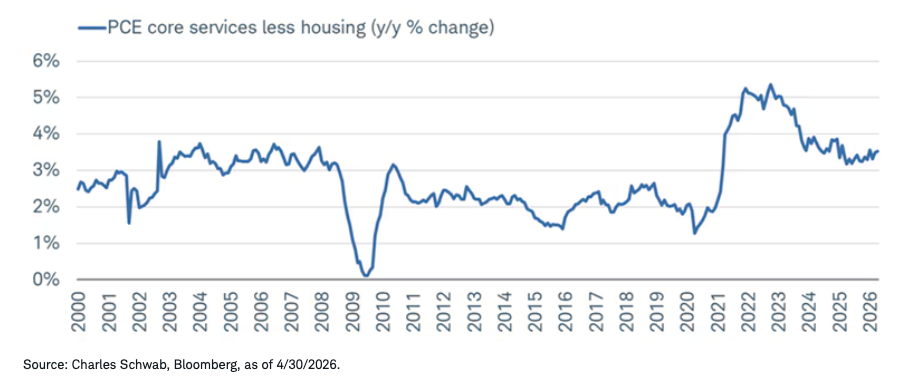
Even outside of the energy complex, we are not optimistic about inflation easing meaningfully in the back half of the year. There is a broadening base of pressure from various segments of the economy. Notably, as shown below, PCE core services excluding housing has settled into a new, uncomfortable range above 3% year-over-year (y/y). In April, the pace picked up to 3.5% y/y. Given this metric excludes any direct effects from tariffs and the energy sector, it gives us a clear view into the sticky nature of inflation, as well as how difficult it will be for the Fed to get to its 2% target anytime soon.
"Supercore" inflation stays sticky
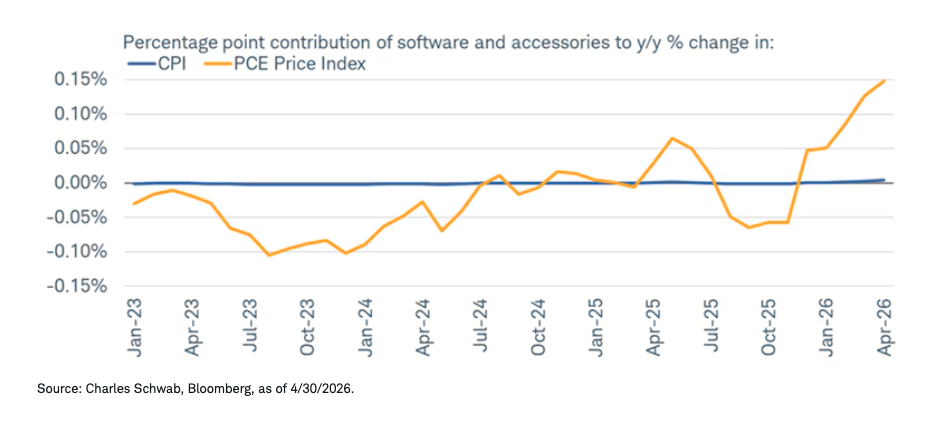
In the past several months, an increasingly dominant factor in the inflation surge has been a basket of goods and services tied to the AI buildout. From computer equipment to software, we are seeing meaningful momentum as the capex cycle continues its march. The rub is that these components' contributions to inflation make the Fed's job increasingly difficult. Software, for example, has a much larger weight in the PCE Price Index versus the CPI, which means its presence is much more dramatic in the PCE, as you can see in the chart below.
AI's growing inflation role
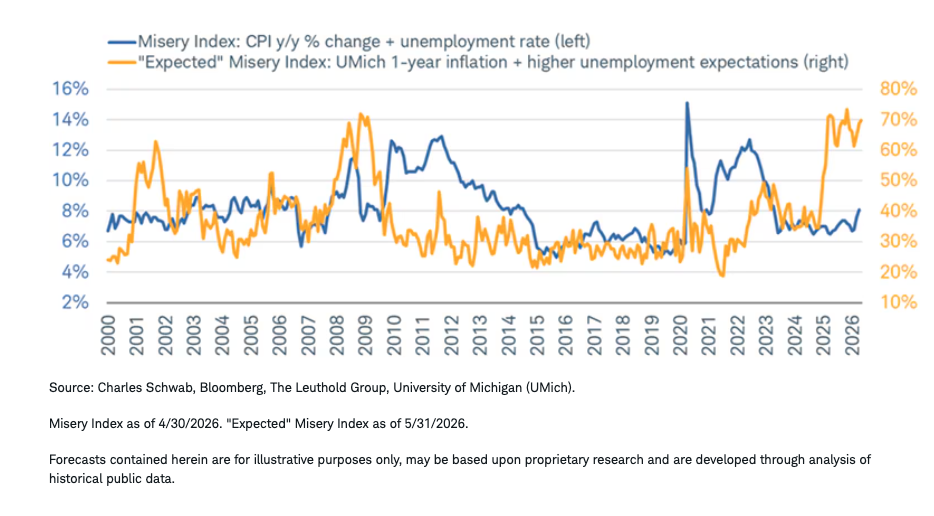
AI's growing role in the inflation story is tricky since it represents a demand shock, which is happening alongside a major supply shock (the Iran war). We expect both to continue to weigh on consumer attitudes. While it might be hard to envision them getting worse from here, we wouldn't put the odds that low. As shown below, there is still a major gap between the actual (blue line) and expected (orange line) misery indexes (which combine the unemployment rate and y/y CPI). However, the former has started to drift higher, thanks to the recent climb in inflation.
We don't expect the actual index to climb into double-digit territory this year, but given the growing public pushback against data center construction, frustration with higher gas prices, and fear of AI consuming job opportunities, consumer sentiment is likely not set to see a major improvement any time soon. We like to remind investors that how the average consumer experiences inflation is vastly different than how Wall Street analyzes inflation. Main Street does not obsess over y/y changes in CPI, it cares about price levels, labor opportunities, and living wages.
Economic concerns are not fading
Bull market rages on
In our full-year 2026 outlook, we expressed optimism about a long runway for the AI buildout. We also anticipated that the strong run by stocks in the lead-in to 2026 could be met by a corrective phase. Although the S&P 500 avoided an "official" correction in March, the churn and rotation under the surface of index returns has been stark: the average S&P 500 member maximum drawdown has been -21% year-to-date.
In our full-year outlook we also highlighted "leapfrog effects," expecting a less obsessive focus on cohorts like the Magnificent 7. We also expected a broadening out in terms of leadership—or those with less concentration and greater participation among S&P 500 stocks. That held true until the war with Iran kicked back in a highly concentrated phase of leadership. Finally, we also expected continued strength in S&P 500 earnings.
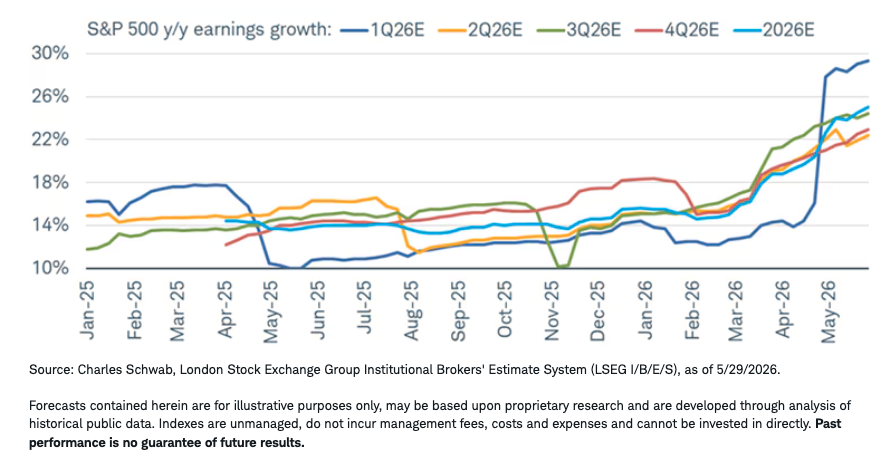
The bullish case for U.S. equities entering the second half of 2026 rests on a foundation of earnings that have defied virtually every cautious forecast laid out at the start of this year. Wall Street analysts now project S&P 500 earnings growth of 25% for the full calendar year, up from less than 16% at the start of the year. The chart below shows the massive surge in earnings that occurred during first quarter 2026 reporting season, as well as each subsequent quarter and the full year (in turquoise).
2026 earnings estimates have surged
The pattern of estimate improvements is atypical as analysts have, more often than not, historically revised estimates lower as the year progresses. The improvement is not even across sectors, however. Relative to the start of the year, the largest jumps in expectations have been among the Energy, Materials, Technology, and Communication Services sectors (three of which we have favorable views on per our latest Sector Views); while the Consumer Discretionary, Consumer Staples, Health Care, Industrials, and Real Estate sectors now have lower estimates than at the start of the year.
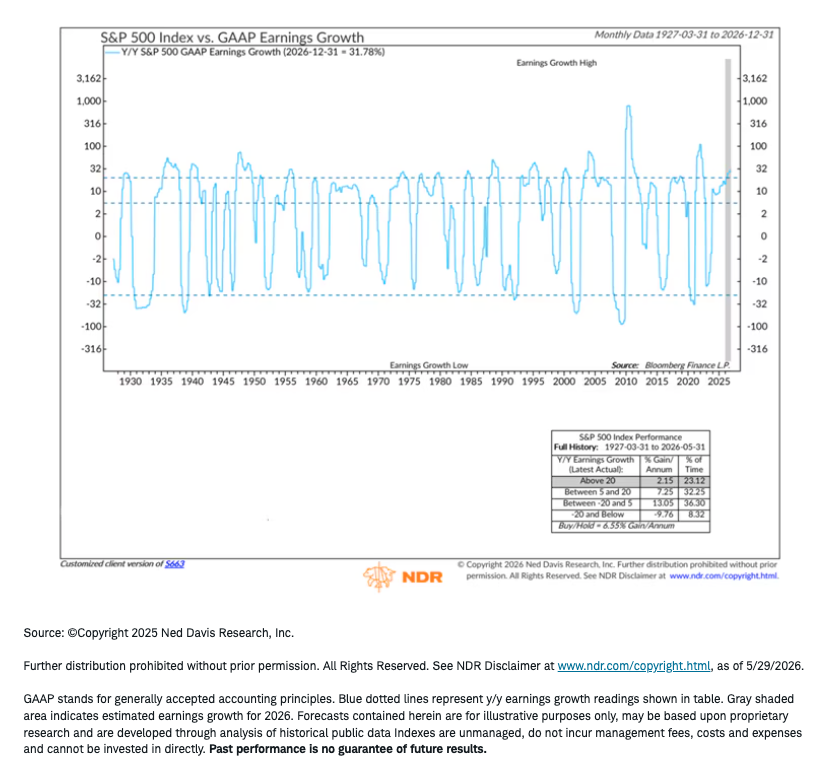
Earnings growth rates as high as what's expected this year are rare outside of periods when the economy was emerging from recessions…not in year seven of an economic expansion. The chart, courtesy of our friends at Ned Davis Research (NDR), utilizes generally accepted accounting principles (GAAP) earnings growth and shows that when year-over-year earnings growth has exceeded 20%, S&P 500 returns have been somewhat anemic. The reason is that investors anticipate that companies will be unable to maintain a lofty pace of growth in the future.
Earnings: too good to be true?
Another rub to strong earnings growth is the concentration of that growth among AI-related leaders and the commodity/energy space. The full-year estimate of 25% S&P 500 earnings growth is driven disproportionately by a handful of high-momentum and individual stocks. In Communication Services, Alphabet (Google) is the largest single driver. In Technology, the outsized expectation is concentrated among Sandisk, Micron, Intel, and Broadcom. Only the Energy sector has notable breadth in terms of contributing stocks.
This is the AI earnings circular financing problem (about which we wrote in the full-year outlook) wearing a second-half outfit: the very companies that need continued hyperscaler capex to justify their earnings trajectories are the same companies whose results underpin the index. Note that hyperscalers are companies that design, own, and operate a large portion of data center networks to provide cloud computing at scale. AI infrastructure stocks have seen 2026 earnings estimates revised higher by more than 50% since December 2024, while the S&P 500, excluding AI infrastructure, has seen estimates move down slightly. That divergence is difficult to dismiss.
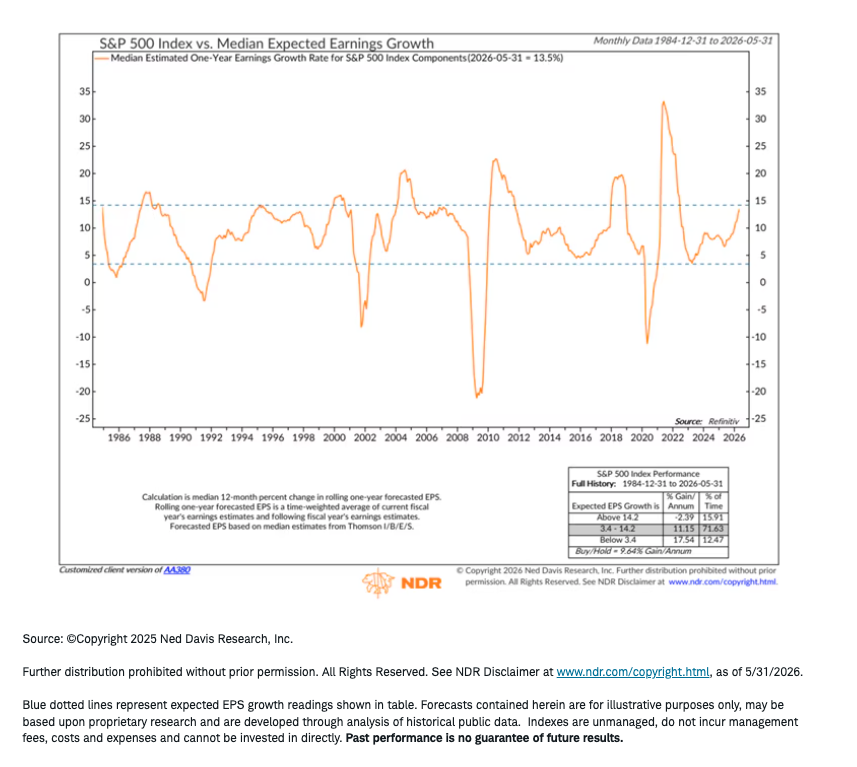
One way to remove the impact of outliers is to look at the median index stock. Per NDR, the median one-year forward estimate for S&P 500 stocks is nearly 13%. As shown below, that remains in a zone where the index has risen at a double-digit annual rate, on average. We will be keeping an eye on whether the median growth rate accelerates to a level that has been unsustainable in the past, but for now this is a positive.
Median earnings growth in good shape
From a valuation perspective, there is also good news as the forward price/earnings (P/E) ratio has actually moved slightly lower so far this year. An improving forward P/E alongside rising earnings estimates suggests investors are not pricing in stronger earnings growth in perpetuity.
Halitosis of note
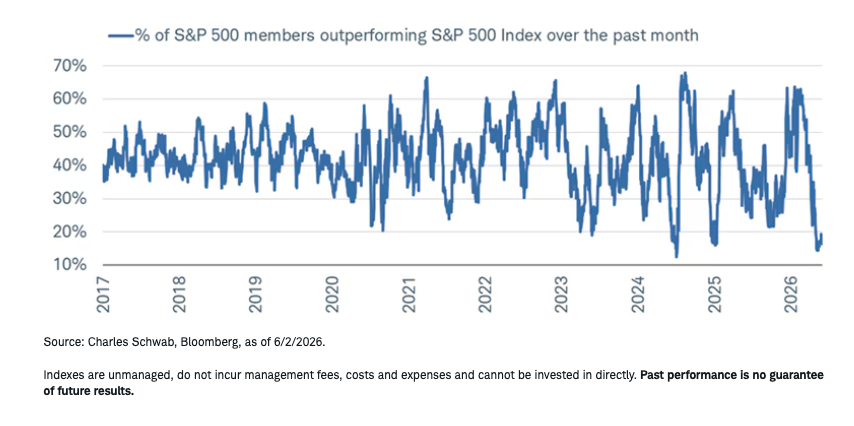
Notwithstanding a lessening of valuation risk, market performance remains highly concentrated, with limited participation under the surface of the capitalization-weighted indexes. Shown below, only about 17% of stocks within the S&P 500 have outperformed the index itself over the past month, which is one of the lowest readings in the past decade, suggesting a possible rebound in participation. A more sustainable broadening out of market performance—like we saw pre-Iran war—would likely require an end to the war and a "permanent" re-opening of the Strait of Hormuz.
Looking for breadth rebound
AI all the time
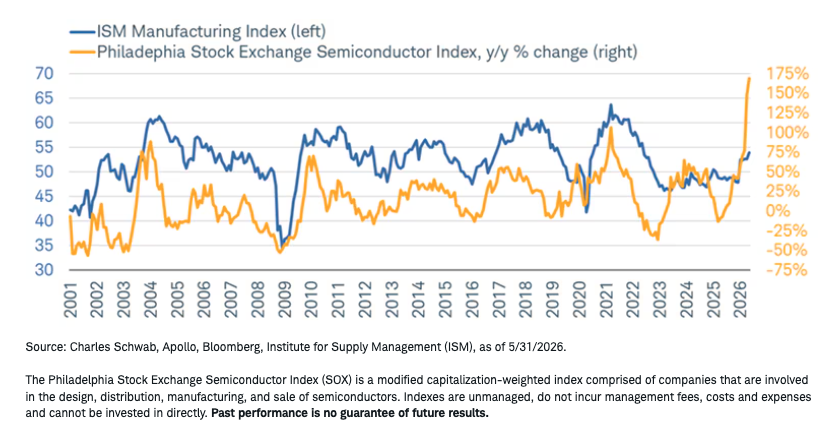
We remain optimistic about AI, and trends in the space have broader economic implications. Per a recent Apollo Global note, semiconductor chips go into virtually everything manufactured, including automobiles, appliances, industrial equipment, and mobile phones. When manufacturers plan to ramp up production, they order chips first; often six to 12 months in advance due to long lead times. As shown below, chip demand therefore anticipates broader manufacturing demand. We also remain optimistic on U.S. manufacturing.
Chip demand bodes well for manufacturing
One of the striking structural features of the current AI investment cycle is the widening spread between hyperscalers' share of S&P 500 capex and their share of S&P 500 net income. The four largest hyperscalers—Amazon, Microsoft, Alphabet, and Meta—collectively spent north of $400 billion in 2025, nearly 70% more than in 2024, according to Goldman Sachs. As shown below, with total S&P 500 capex having nearly doubled since 2021, the hyperscalers' share of aggregate index capex commands an outsized, and rapidly growing, slice. Yet, their share of index-level net income, while also elevated, has not kept pace.
Hyper hyperscalers' capex
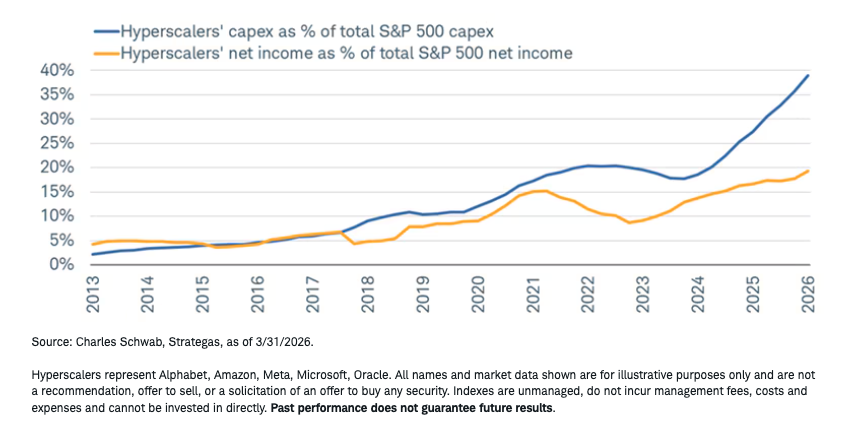
Goldman Sachs estimates that the largest hyperscalers will spend nearly $800 billion on capex this year, a more than 80% increase from last year, and another more than $900 billion in 2027. Hyperscalers' capex is on track to reach about 75% of the companies' cash flows, a ratio reminiscent of tech company spending in the late 1990s. The result is a structurally negative and widening spread, with hyperscalers claiming a dramatically larger share of the index's investment dollars than of its earnings dollars. This does raise questions about return on invested capital, the durability of free cash flow, and whether the market's valuation of these companies already prices in a monetization trajectory that has yet to materialize.
Supply chain vulnerabilities also represent a meaningful but often underappreciated risk to the AI infrastructure buildout. The concentration of advanced semiconductor manufacturing—particularly leading-edge logic and memory—in a narrow geographic corridor spanning Taiwan, South Korea, and the Netherlands creates single points of failure that geopolitical tensions could rapidly expose. Investors pricing in a smooth, multi-year AI ramp-up may be underweighting the fragility embedded in that assumption.
Sentiment sorrow
The consumer sentiment backdrop offers a different kind of complexity. As shown below, the University of Michigan Consumer Sentiment Index has plunged to a record low, largely driven by the war in Iran and the impact on the cost of living. That kind of reading—which is below every recession trough in the survey's 75-year history—would normally be treated as a bearish signal for equities. Yet, the S&P 500 has continued to grind higher. A simple explanation is that consumer sentiment measures how people feel, while the stock market reflects what investors expect.
K-shape's poster child
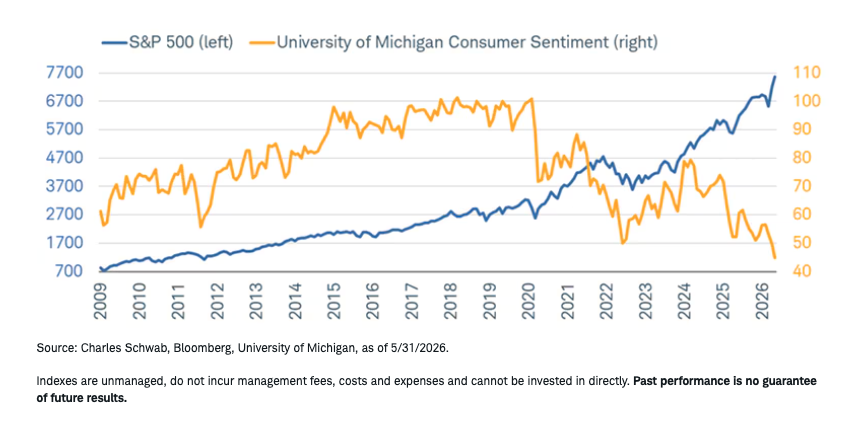
Equity ownership is heavily concentrated among higher-income households, and stock returns are being disproportionately driven by a relatively small group of mega-cap AI-related stocks. Investors are focusing on earnings, productivity gains from AI, and future cash flows. Consumers are still facing the cumulative effects of inflation and, as noted earlier, they tend to anchor on price levels, not inflation rates. Asset owners and non-asset owners are experiencing very different economies. Consumer sentiment signals capture economic stress that equity markets are structurally insulated from…at least for now.
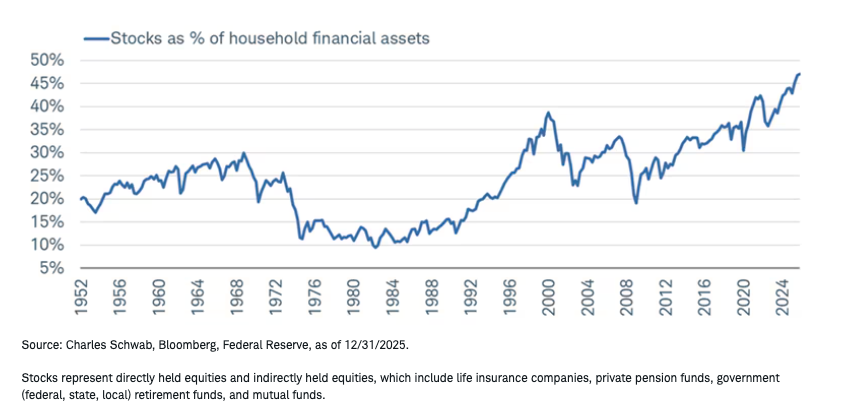
That insulation comes with its own risks. According to the Federal Reserve, the share of equities in household financial assets has reached more than 47%, nearly tripling from the 2008 financial crisis low, as shown in the chart below. At that level of exposure, any meaningful correction by stocks likely wouldn't "stay" in portfolios—it would likely flow through to consumption as well. The "wealth effect," which has long been a tailwind, could become a transmission risk.
Households' lofty equity position
Real household wealth excluding stocks has been far more tepid due to housing contributing less and real income growth constrained by above-average inflation. The stock market is effectively carrying the household balance sheet, which works until it doesn't.
Stocks carrying household wealth
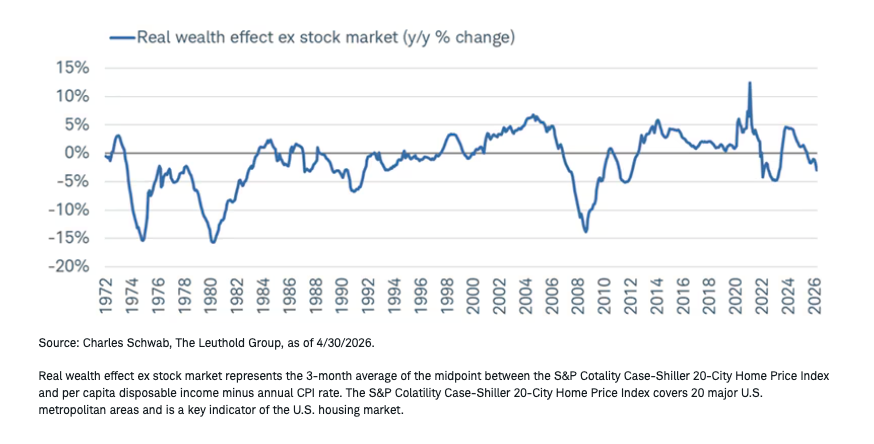
Real household wealth excluding stocks has been far more tepid due to housing contributing less and real income growth constrained by above-average inflation. The stock market is effectively carrying the household balance sheet, which works until it doesn't.
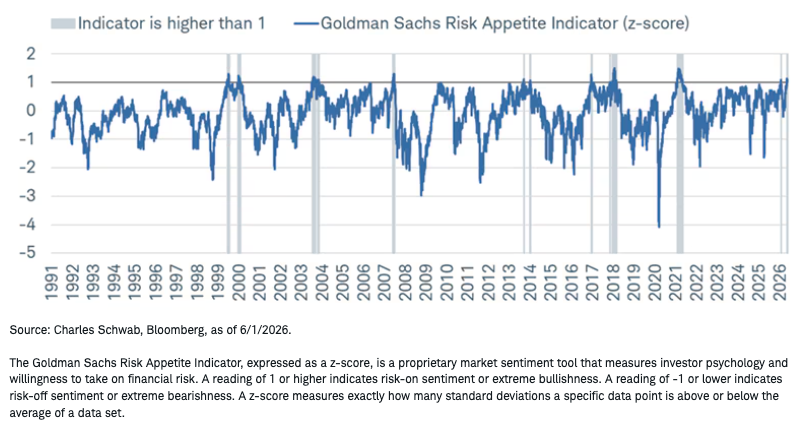
Investor positioning corroborates the vulnerability. Goldman Sachs' proprietary Risk Appetite Indicator—shown below—now sits in the 99th percentile of all observations since 1991. Historical analogues to this reading show S&P 500 forward returns running below historical averages out to 12 months. The signal is that markets are likely priced for continuation, not for disappointment.
Risk appetites in lofty territory
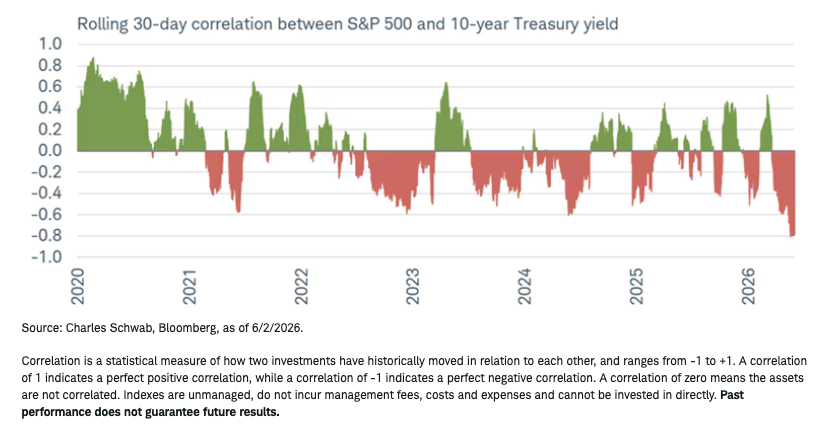
The bond market is adding a dimension to this calculus as well. The 10-year Treasury yield recently jumped above 4.6% before retreating a bit. On the eve of the start of the war with Iran, the yield was sub-4%, with the yield surge since then driven by a combination of inflation risks and growing government debt issuance competing for capital. These moves have led to the correlation between equities and bond yields to turn deeply negative again, as shown below. That means that both stock prices and bond prices (which move opposite to yields) are moving in the same direction.
Sharp inverse yields/stocks correlation
The equity risk premium is historically thin, meaning stocks offer only a small return advantage over Treasuries. AI-driven earnings growth might continue to offset higher yields for now, but a sustained 10-year yield approaching or exceeding 5% may raise correction risk.
Warsh test?
Sitting at the intersection of all of this is a new Federal Reserve chair potentially facing his first formal test. The selloff in U.S. Treasuries recently took some yields—like the 30-year yield—to their highest level in years, spurring a budding narrative that markets are "testing" new Fed Chair Kevin Warsh. This is a pattern with history behind it. New Fed chairs, as shown below, have reliably faced an early market probe of their inflation credibility and policy tolerance.
Market tends to test new Fed chairs
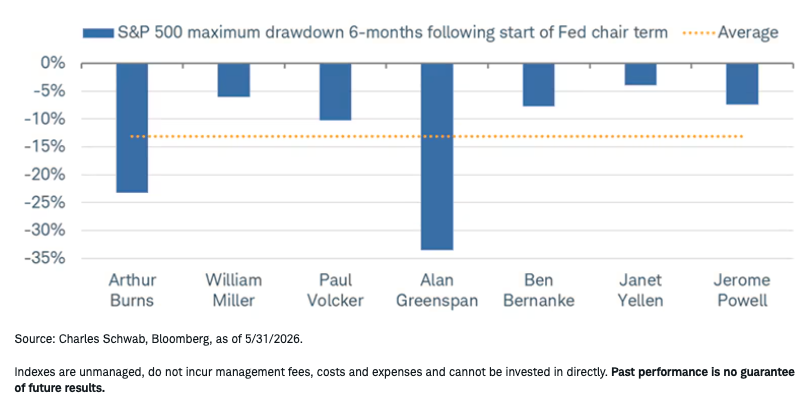
The new chair is not the same as the old chair. Markets had become accustomed to former Fed Chair Jerome Powell's communication style, which was generally seen as market-friendly. The Warsh tenure may usher in more market volatility given his known skepticism of the Fed's balance-sheet footprint, and his preference for tighter communication discipline.
Other risks that could drive volatility episodes:
- High bar for forward earnings expectations and some accompanying sentiment froth.
- Longer-than-anticipated closure of the Strait of Hormuz, which would further entrench troubling inflation trends, impact the demand side of global growth, and cause further supply chain pressures.
- Private credit concerns spreading into the public markets.
- Massive size of pending initial public offerings (IPOs) leading to passive investment vehicles trimming existing mega-cap holdings to make room for new entrants.
- AI's benefits to productivity under-shooting expectations.
In sum
Considering the interplay between economic trends and stock market behavior, the second half of 2026 is presenting investors with a bit of a split verdict. The earnings backdrop is the strongest it has been in years and although it is concentrated, it is not a mirage. The economy and labor market have remained resilient. However, the index-level signal from the stock market is obscuring a more complicated picture: concentrated earnings growth, record household equity exposure, consumer sentiment at historical lows for everyone outside the stock market, a bond market that's increasingly competitive with equities on a risk-adjusted basis, and a new Fed chair who may not feel inclined to rescue a richly valued market at the first sign of stress. We think that the bull case has real substance. So does the case for managing it carefully.
A message from Advisor Perspectives and VettaFi: Discover something new! Click here to register for our upcoming webcasts.
This material is intended for general informational and educational purposes only. This should not be considered an individualized recommendation or personalized investment advice. The investment strategies mentioned are not suitable for everyone. Each investor needs to review an investment strategy for his or her own particular situation before making any investment decisions.
All expressions of opinion are subject to change without notice in reaction to shifting market, economic or political conditions. Data contained herein from third party providers is obtained from what are considered reliable sources. However, its accuracy, completeness or reliability cannot be guaranteed.
Past performance is no guarantee of future results.
Investing involves risk, including loss of principal.
Performance may be affected by risks associated with non-diversification, including investments in specific countries or sectors. Additional risks may also include, but are not limited to, investments in foreign securities, especially emerging markets, real estate investment trusts (REITs), fixed income, and small capitalization securities. Each individual investor should consider these risks carefully before investing in a particular security.
All corporate names and market data shown are for illustrative purposes only and are not a recommendation, offer to sell, or a solicitation of an offer to buy any security.
Diversification and asset allocation strategies do not ensure a profit and do not protect against losses in declining markets.
Schwab does not recommend the use of technical analysis as a sole means of investment research.
The policy analysis provided by the Charles Schwab & Co., Inc., does not constitute and should not be interpreted as an endorsement of any political party.
Indexes are unmanaged, do not incur management fees, costs, and expenses and cannot be invested in directly. For more information on indexes, please see schwab.com/indexdefinitions.
The Schwab Center for Financial Research is a division of Charles Schwab & Co., Inc.
Source: Bloomberg Index Services Limited. BLOOMBERG® is a trademark and service mark of Bloomberg Finance L.P. and its affiliates (collectively "Bloomberg"). Bloomberg or Bloomberg's licensors own all proprietary rights in the Bloomberg Indices. Neither Bloomberg nor Bloomberg's licensors approves or endorses this material, or guarantees the accuracy or completeness of any information herein, or makes any warranty, express or implied, as to the results to be obtained therefrom and, to the maximum extent allowed by law, neither shall have any liability or responsibility for injury or damages arising in connection therewith.
Investment and Insurance Products Are: Not FDIC Insured • Not Insured by Any Federal Government Agency • Not a Deposit or Other Obligation of, or Guaranteed by, the Bank or any of its Affiliates • Subject to Investment Risks, Including Possible Loss of Principal Amount Invested
The Charles Schwab Corporation provides a full range of brokerage, banking and financial advisory services through its operating subsidiaries. Its broker-dealer subsidiary, Charles Schwab & Co. Inc. (Member SIPC), and its affiliates offer investment services and products. Its banking subsidiary, Charles Schwab Bank, SSB (member FDIC and an Equal Housing Lender), provides deposit and lending services and products.
This site is designed for U.S. residents. Non-U.S. residents are subject to country-specific restrictions. Learn more about our services for non-U.S. residents, Charles Schwab Hong Kong clients, Charles Schwab U.K. clients.
© 2026 Charles Schwab & Co., Inc. All rights reserved. Member SIPC. Unauthorized access is prohibited. Usage will be monitored.
Membership required
Membership is now required to use this feature. To learn more:
View Membership BenefitsSponsored Content
Upcoming Virtual Events View All


