This month’s Muni Monthly covers performance, supply and demand technicals, fundamentals and valuations for the month ending June 2026.
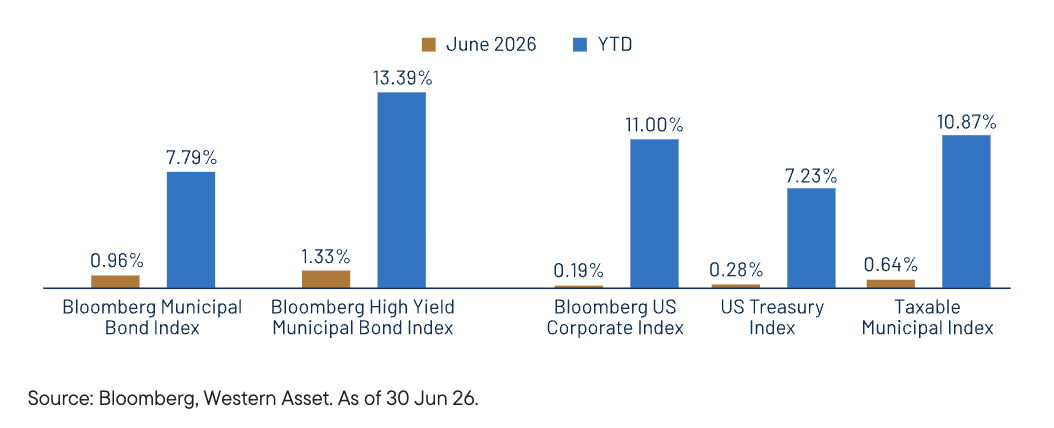
Performance Overview: Municipals continued to outperform taxable fixed income in June.
In June, market news continued to be dominated by the Middle East conflict as frequent flare-ups in hostilities gave way to repeated ceasefire efforts and the signing of a high-level memorandum of understanding between the US and Iran. Meanwhile, inflation pressures continued over the month, with headline Consumer Price Index (CPI) rising to 4.20% year-over-year (YoY) from 3.80% the prior month and core CPI rising to 2.90% YoY from 2.80%. The US Treasury yield curve flattened, with short- and intermediate-term yields moving higher as the market priced in additional rate hikes for the remainder of the year. Municipals extended their outperformance observed earlier in the year, with yields declining across the curve and the strongest returns concentrated in the longest maturities.
See more: Before You Implement Tax-Aware Long-Short: Five Things Every Advisor Should Know
Exhibit 1: Monthly Bloomberg Municipal Index Total Returns
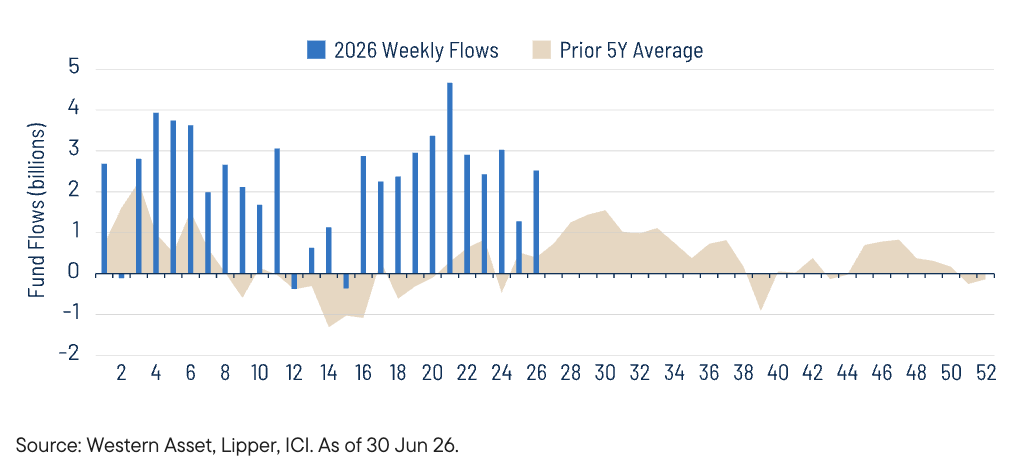
Technicals: Municipal demand has remained above average and continues to be supported by improved fund flows.
Municipal technicals remained defined by elevated supply and strong demand. June total new issuance maintained a near-record pace at $63 billion, 18% above prior-month levels. The tax-exempt municipal supply of $58 billion represented 94% of total issuance and increased 22% from prior-month levels. Year-to-date (YTD) total supply of $295 billion is tracking 4% above the previous record year. Demand remained firm, with municipal mutual funds recording approximately $7 billion of net inflows during the month. Long-term funds and ETFs garnered the majority of net inflows and brought total YTD inflows to $57 billion.
Exhibit 2: Monthly Municipal Mutual Fund Flows
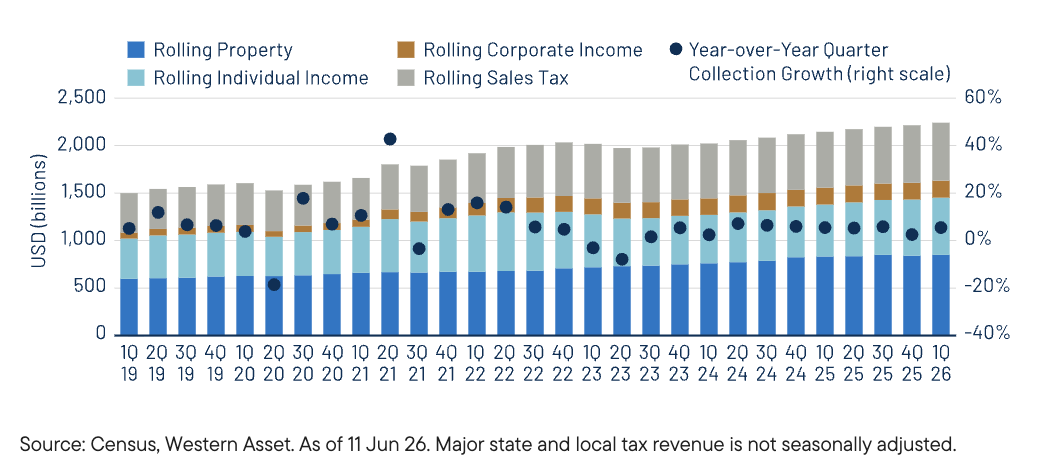
Fundamentals: Record tax collections continue to bolster resilient muni credit fundamentals, even amid federal funding pressures.
The municipal market navigated a budget season marked by reduced federal support and ongoing cost pressures. However, resilient economic growth and a healthy labor market continued to support record tax collections and broadly stable municipal credit fundamentals. The U.S. Census Bureau’s first-quarter 2026 state and local tax collection estimates showed total collections rising 5.5% YoY on a trailing 12-month basis, to a record $2.22 trillion. Individual income taxes were the primary growth driver, increasing 10.0% YoY. Sales tax collections rose 3.8%, property tax collections increased 2.1% and corporate income tax collections rose a more modest 0.8%.
Exhibit 3: 12-Month Trailing and Local Revenue Collections
While credit fundamentals remain strong across most of the municipal market, rating actions have begun to reflect moderate growth expectations and persistent cost pressures. As a result, the pace of rating improvement slowed in 1H26. According to Bloomberg data through June 18, upgrades from the three major rating agencies (Moody’s, S&P and Fitch) continued to outnumber downgrades by issuer count, with 540 upgrades versus 509 downgrades. However, downgrades exceeded upgrades by par value, with $101 billion downgraded versus $88 billion upgraded. Meanwhile, first-time payment defaults totaled $692 million, below the $1 billion recorded in the prior year.
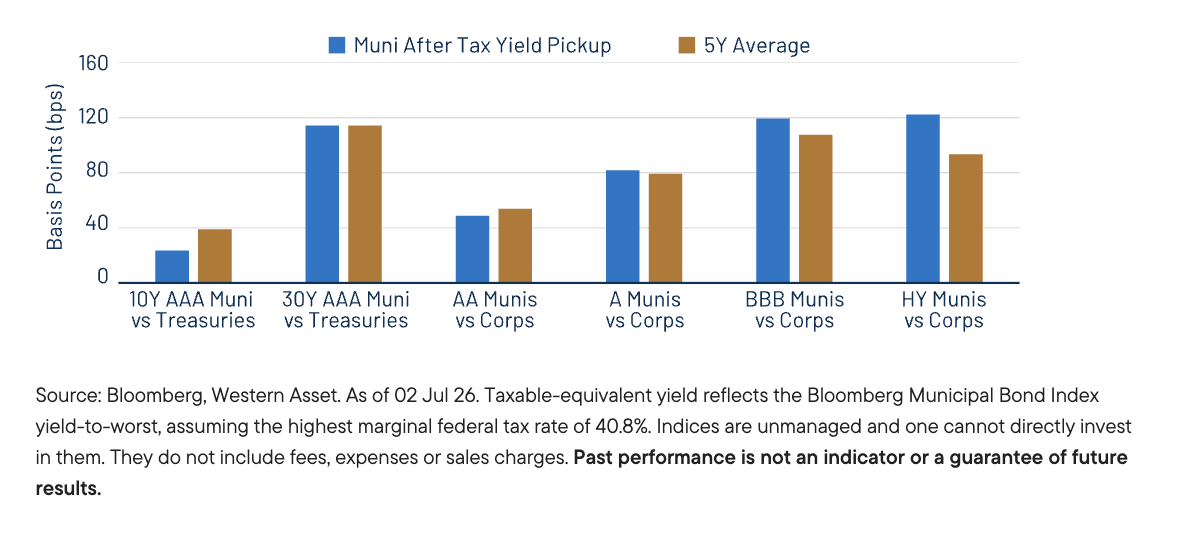
Valuations: Municipals offer attractive relative value vs. like structured corporates.
Despite strong nominal and relative returns so far this year, Western Asset believes value persists in the municipal market. The average yield-to-worst of the Bloomberg Municipal Bond Index ended June at 3.6%, roughly in line with the start of the year and equivalent to a tax-equivalent yield of approximately 6.0%, assuming a top marginal tax rate of 40.8%. Relative after-tax income opportunities remain favorable out the curve and from lower investment-grade to high-yield credit. We believe these opportunities remain compelling in an environment where equity valuations appear elevated and corporate credit spreads remain tight. However, recent outperformance has narrowed broad relative value, underscoring the importance of security selection within the market.
Exhibit 4: After-Tax Yield Pickup by Quality Cohort
A message from Advisor Perspectives and VettaFi: Discover something new! Click here to register for our upcoming webcasts.
Definitions:
“AAA” and “AA” (high credit quality) and “A” and “BBB” (medium credit quality) are considered investment grade. Credit ratings for bonds below these designations (“BB,” “B,” “CCC,” etc.) are considered low credit quality, and are commonly referred to as “junk bonds.”
One basis point (bps) is one one-hundredth of one percentage point (1/100% or 0.01%).
The Bloomberg Municipal “Muni” Bond Index covers the USD denominated long-term tax-exempt bond market. The index has four main sectors: state and local general obligation bonds, revenue bonds, insured bonds, and prerefunded bonds.
The Bloomberg Municipal High Yield Bond Index is an unmanaged index made up of bonds that are non-investment grade, unrated, or rated below Ba1 by Moody’s Investors Service with a remaining maturity of at least one year.
The Bloomberg Taxable Municipal Bond Index is a rules-based, market-value-weighted index engineered for the long-term taxable bond market. To be included in the index, bonds must be rated investment-grade (Baa3/BBB- or higher) by at least two of the following ratings agencies if all three rate the bond: Moody’s, S&P, Fitch. If only two of the three agencies rate the security, the lower rating is used to determine index eligibility. If only one of the three agencies rates a security, the rating must be investment-grade.
The Bloomberg US Corporate Bond Index measures the performance of the investment-grade, fixed-rate, taxable corporate bond market. It includes U.S. dollar-denominated securities publicly issued by US and non-US industrial, utility and financial issuers.
The Bloomberg US Treasury Index measures the performance of US dollar-denominated, fixed-rate, nominal debt issued by the US Treasury with at least one year until final maturity. Treasuries, if held to maturity, offer a fixed rate of return and a fixed principal value; their interest payments and principal are guaranteed.
The Bloomberg Valuation Service (BVAL) provides prices on a daily basis for over 2.5 million securities across all asset classes.
The Bloomberg AAA BVAL Callable Municipal Credit Curve is represented by the US General Obligation AAA Muni BVAL Yield Curve. The BVAL curve is populated with pricing from uninsured AAA General Obligation bonds. The curve is populated with high quality US municipal bonds with an average rating of AAA from Moody’s and S&P. The yield curve is built using non-parametric fit of market data obtained from the Municipal Securities Rulemaking Board, new issues, and other proprietary contributed prices. The curve represents 5% couponing. The 3-month to 10-year points are bullet yields, and the 11-year to 30-year points are yields to worst for a 10-year call.
The yield curve shows the relationship between yields and maturity dates for a similar class of bonds.
Inverted yield curve refers to a market condition when yields for longer-maturity bonds have yields which are lower than shorter-maturity issues.
Yield to worst (YTW) is the lowest potential yield that can be received on a bond without the issuer actually defaulting.
WHAT ARE THE RISKS?
All investments involve risks, including possible loss of principal. Past performance is no guarantee of future results. Please note that an investor cannot invest directly in an index. Unmanaged index returns do not reflect any fees, expenses or sales charges.
Equity securities are subject to price fluctuation and possible loss of principal.
Fixed-income securities involve interest rate, credit, inflation and reinvestment risks; and possible loss of principal. As interest rates rise, the value of fixed income securities falls. Low-rated, high-yield bonds are subject to greater price volatility, illiquidity and possibility of default.
Municipal income may be subject to state and local taxes. Some income may be subject to the federal alternative minimum tax for certain investors. Capital gains, if any, are taxable.
Changes in the credit rating of a bond, or in the credit rating or financial strength of a bond’s issuer, insurer or guarantor, may affect the bond’s value.
U.S. Treasuries are direct debt obligations issued and backed by the “full faith and credit” of the US government. The US government guarantees the principal and interest payments on US Treasuries when the securities are held to maturity. Unlike US Treasuries, debt securities issued by the federal agencies and instrumentalities and related investments may or may not be backed by the full faith and credit of the US government. Even when the US government guarantees principal and interest payments on securities, this guarantee does not apply to losses resulting from declines in the market value of these securities.
© Franklin Templeton
Read more commentaries by Franklin Templeton