The U.S. labor market continued to show signs of cooling, with all major labor indicators pointing to a softening trend and a weak hiring environment. This data collectively pushed the odds of a Fed rate cut at the next meeting to 100%, with debate shifting to the size of the cut itself. In response, the S&P 500 retreated from its latest record high, and Treasuries tumbled to their lowest level in months.
Employment Report
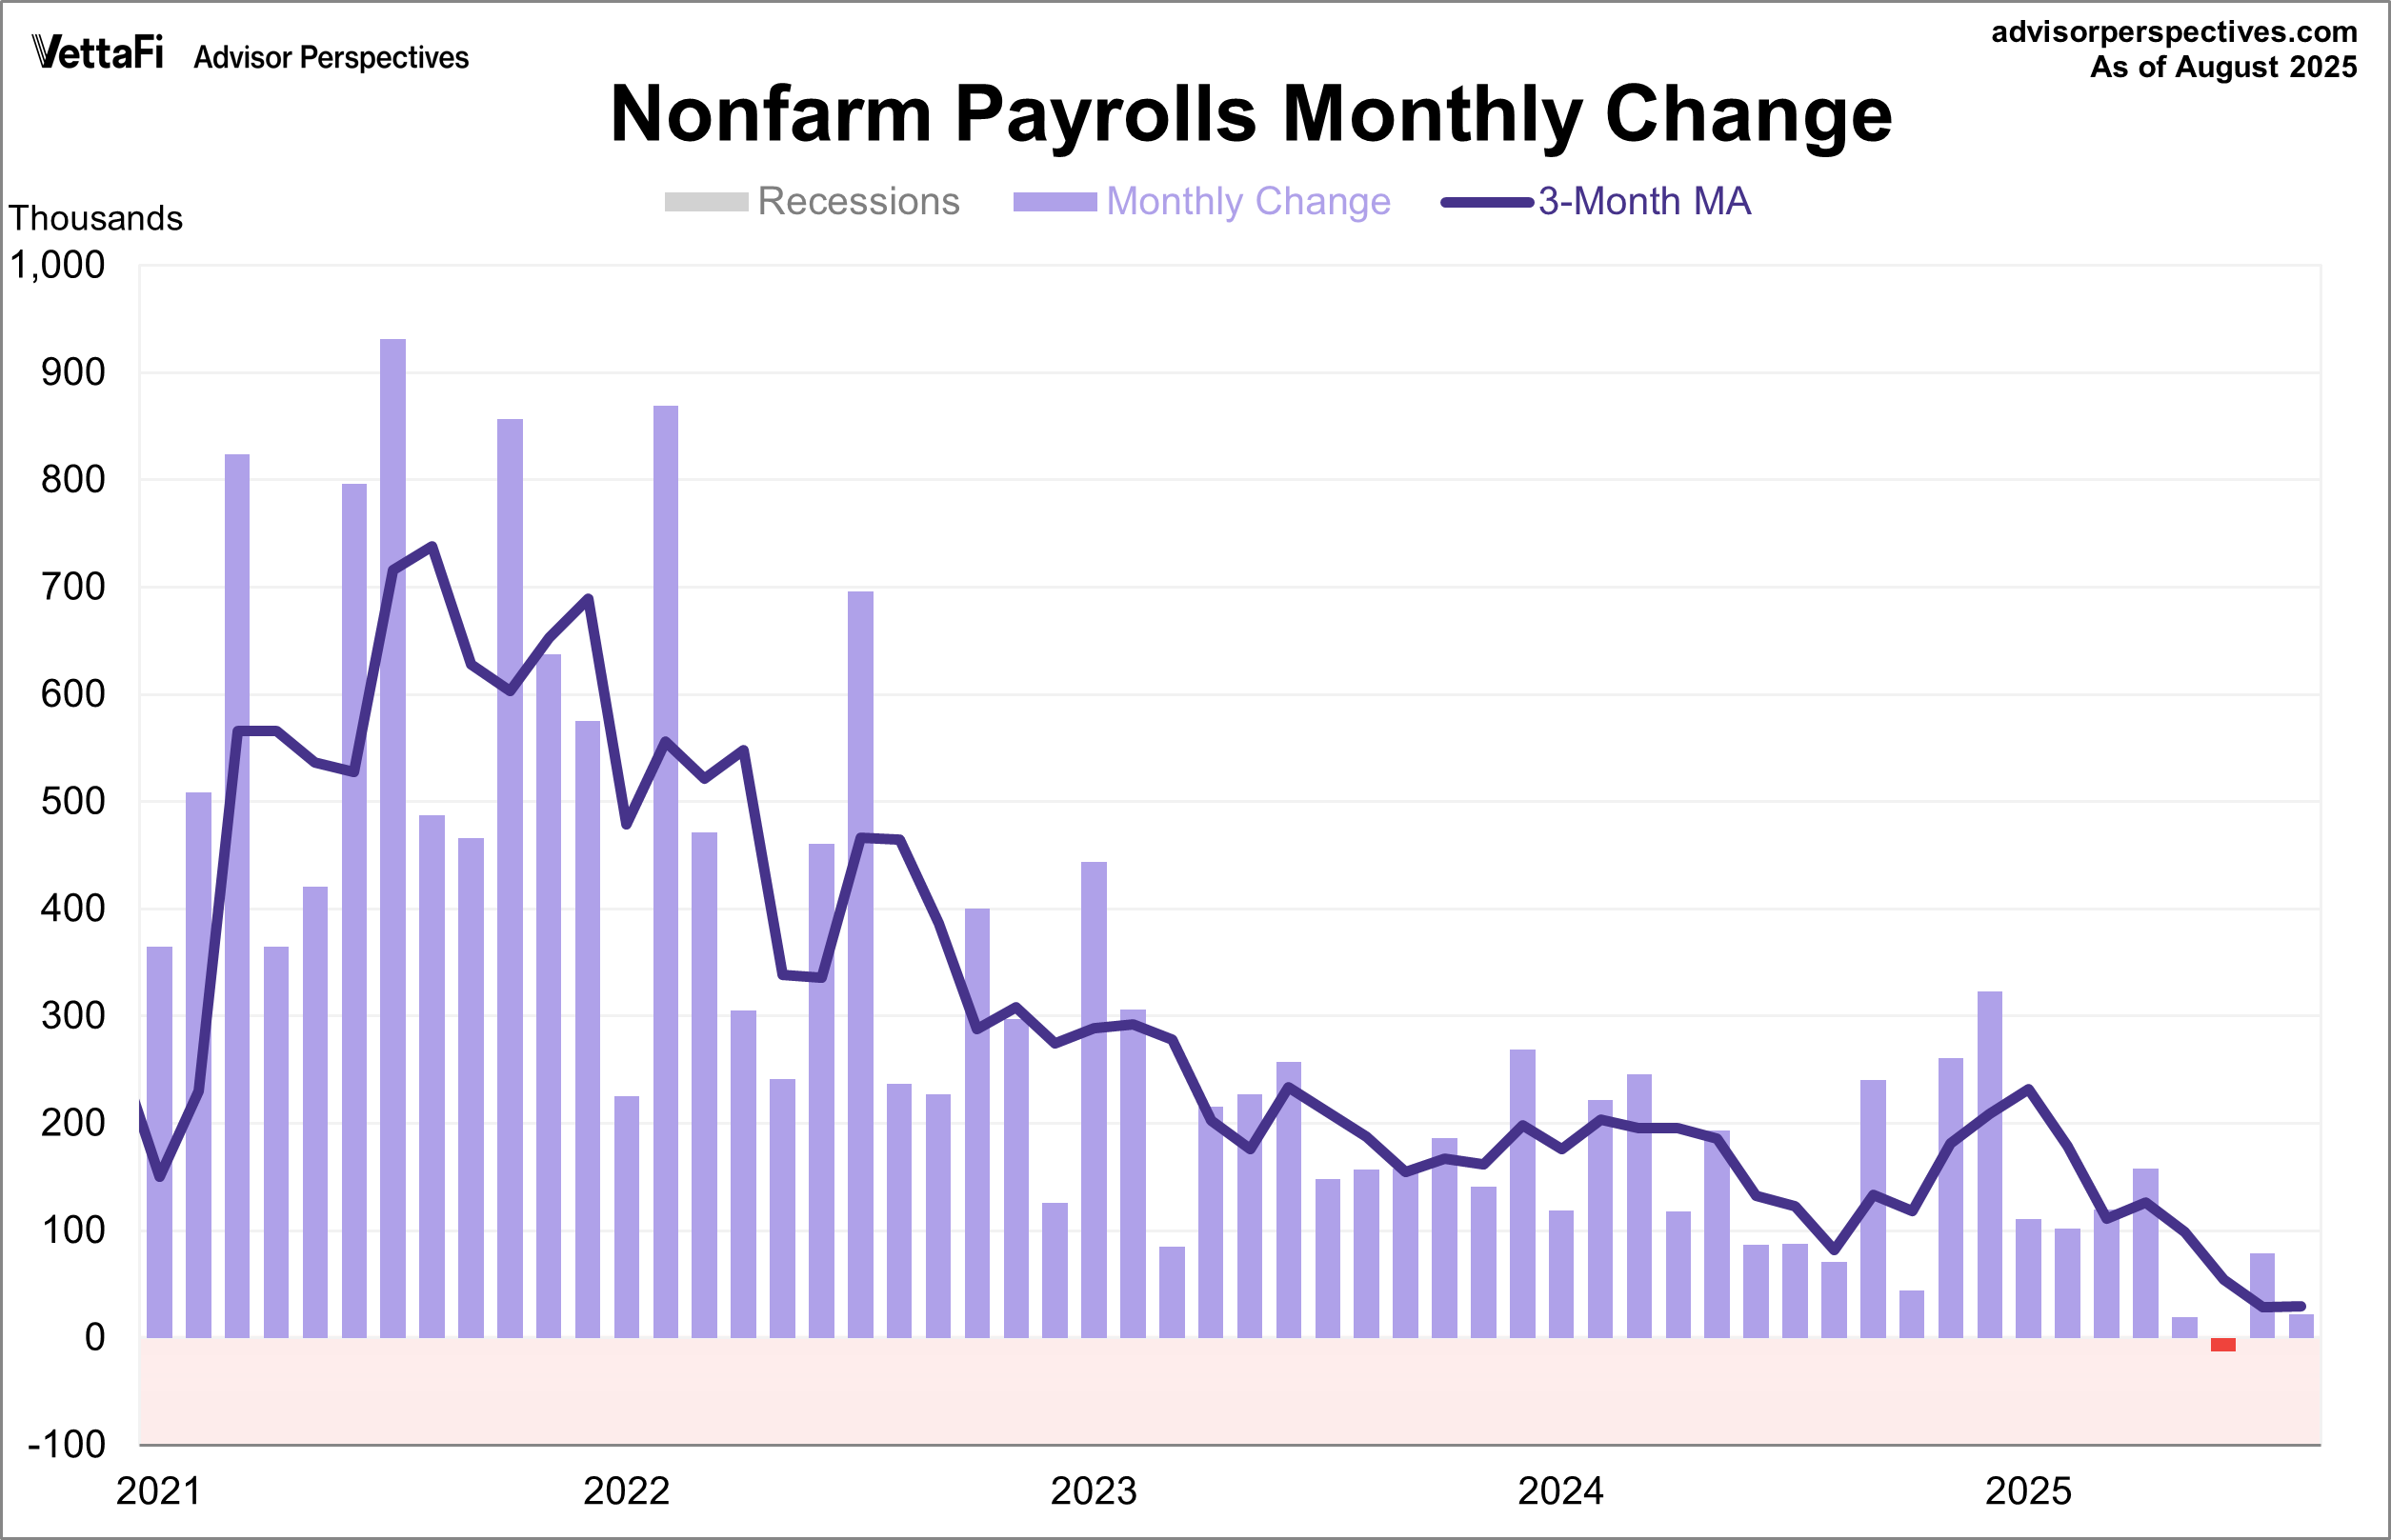
The August employment report showed that 22,000 jobs were added last month, falling short of the expected 75,000 addition. The report also revealed revisions to previous months, with June showing job losses for the first time since 2020.
The unemployment rate rose to 4.3% last month, its highest level in nearly four years, as expected. This figure aligns with other notable trends in the report, including the number of people unemployed for 27 weeks or more, which is now at its highest point since December 2021. Furthermore, the average duration of unemployment has reached its highest level since April 2022. The Employment to Population Ratio, which measures the percentage of the working-age population with a job, has also dropped to its lowest level since December 2021. Taken together, these data points point to a U.S. labor market that is not only cooling but potentially heading toward further weakness in the months ahead.

Job Openings and Labor Turnover Summary (JOLTS)
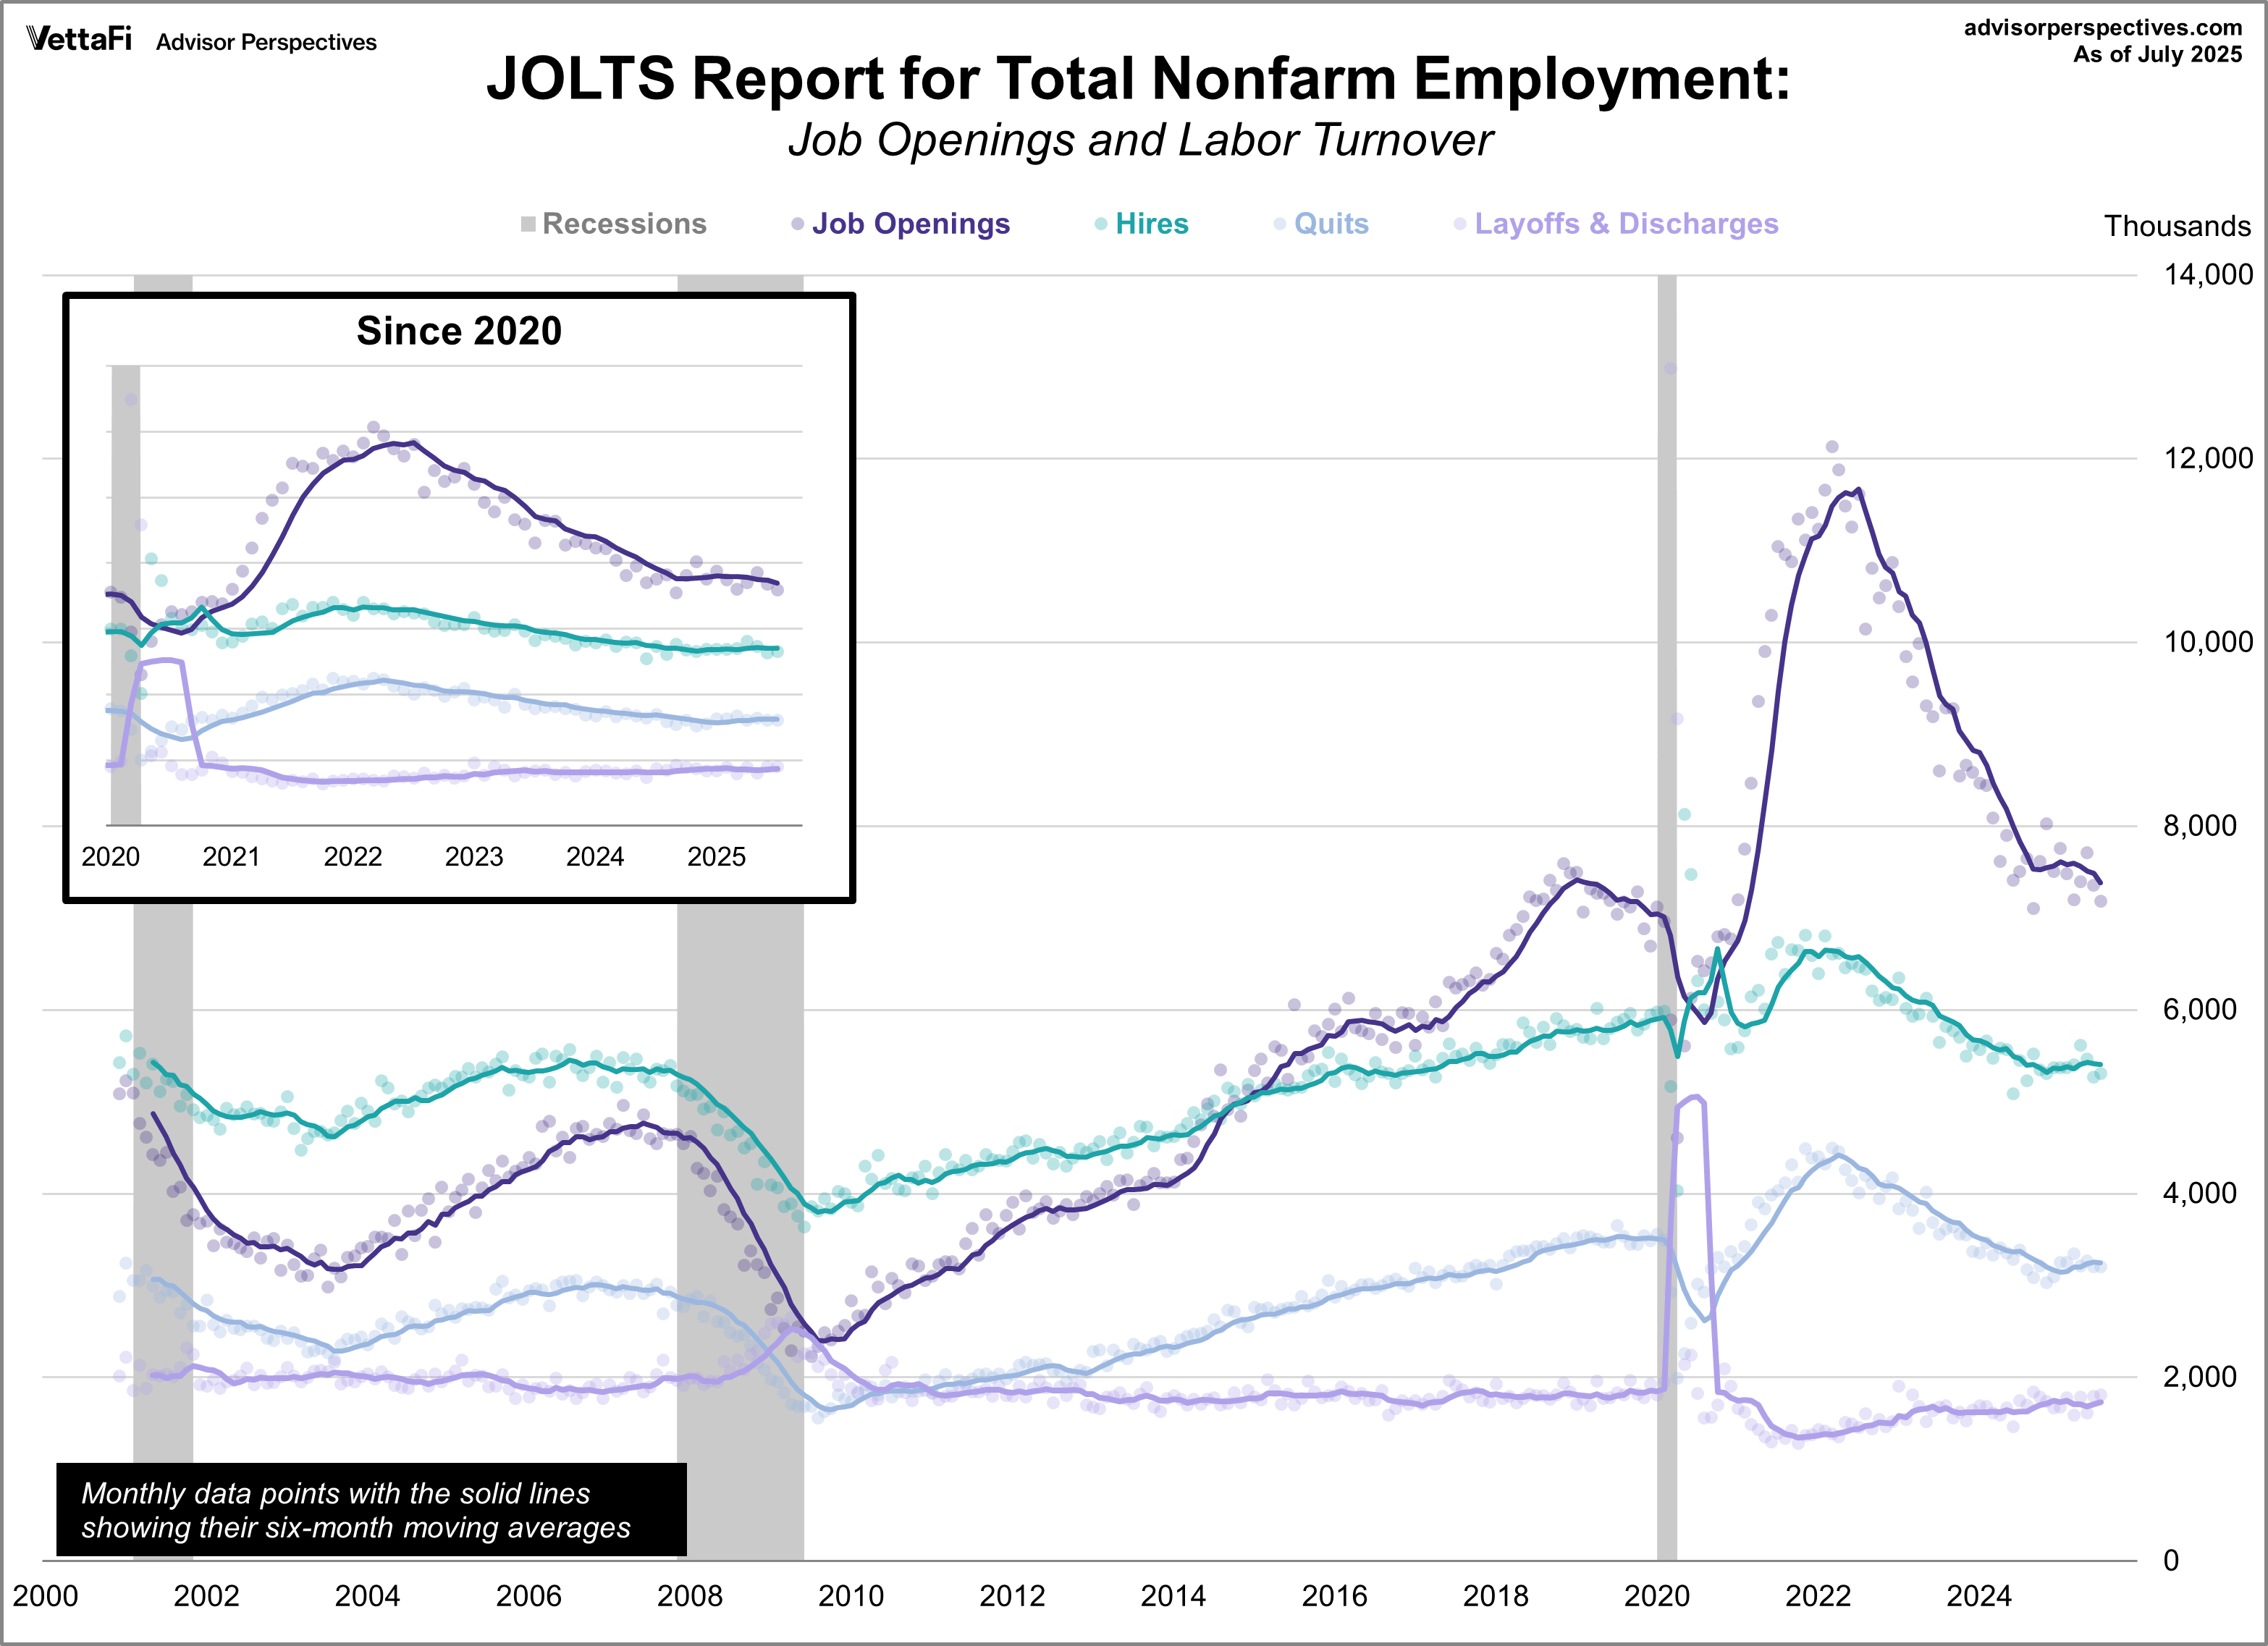
Job openings fell for a second straight month, hitting their lowest level in ten months. The July JOLTS report revealed vacancies dropped by 176,000 to 7.181 million, falling short of the expected 7.380 million. This decline continues a three-year trend, with vacancies now at pre-pandemic levels.
For the first time since April 2021, the job openings-to-unemployed-workers ratio fell below 1.0. This means there are now more unemployed people seeking work than there are available jobs, making it more challenging for job seekers.
Other significant data points, including the rates for hires, quits, and layoffs, were little changed from the previous month. While the hires rate remains near a decade low and the quits rate is below pre-pandemic levels, the layoffs rate also remains low. This shows that employers are still largely holding on to their workers even as they slow down hiring.
ADP Employment Report
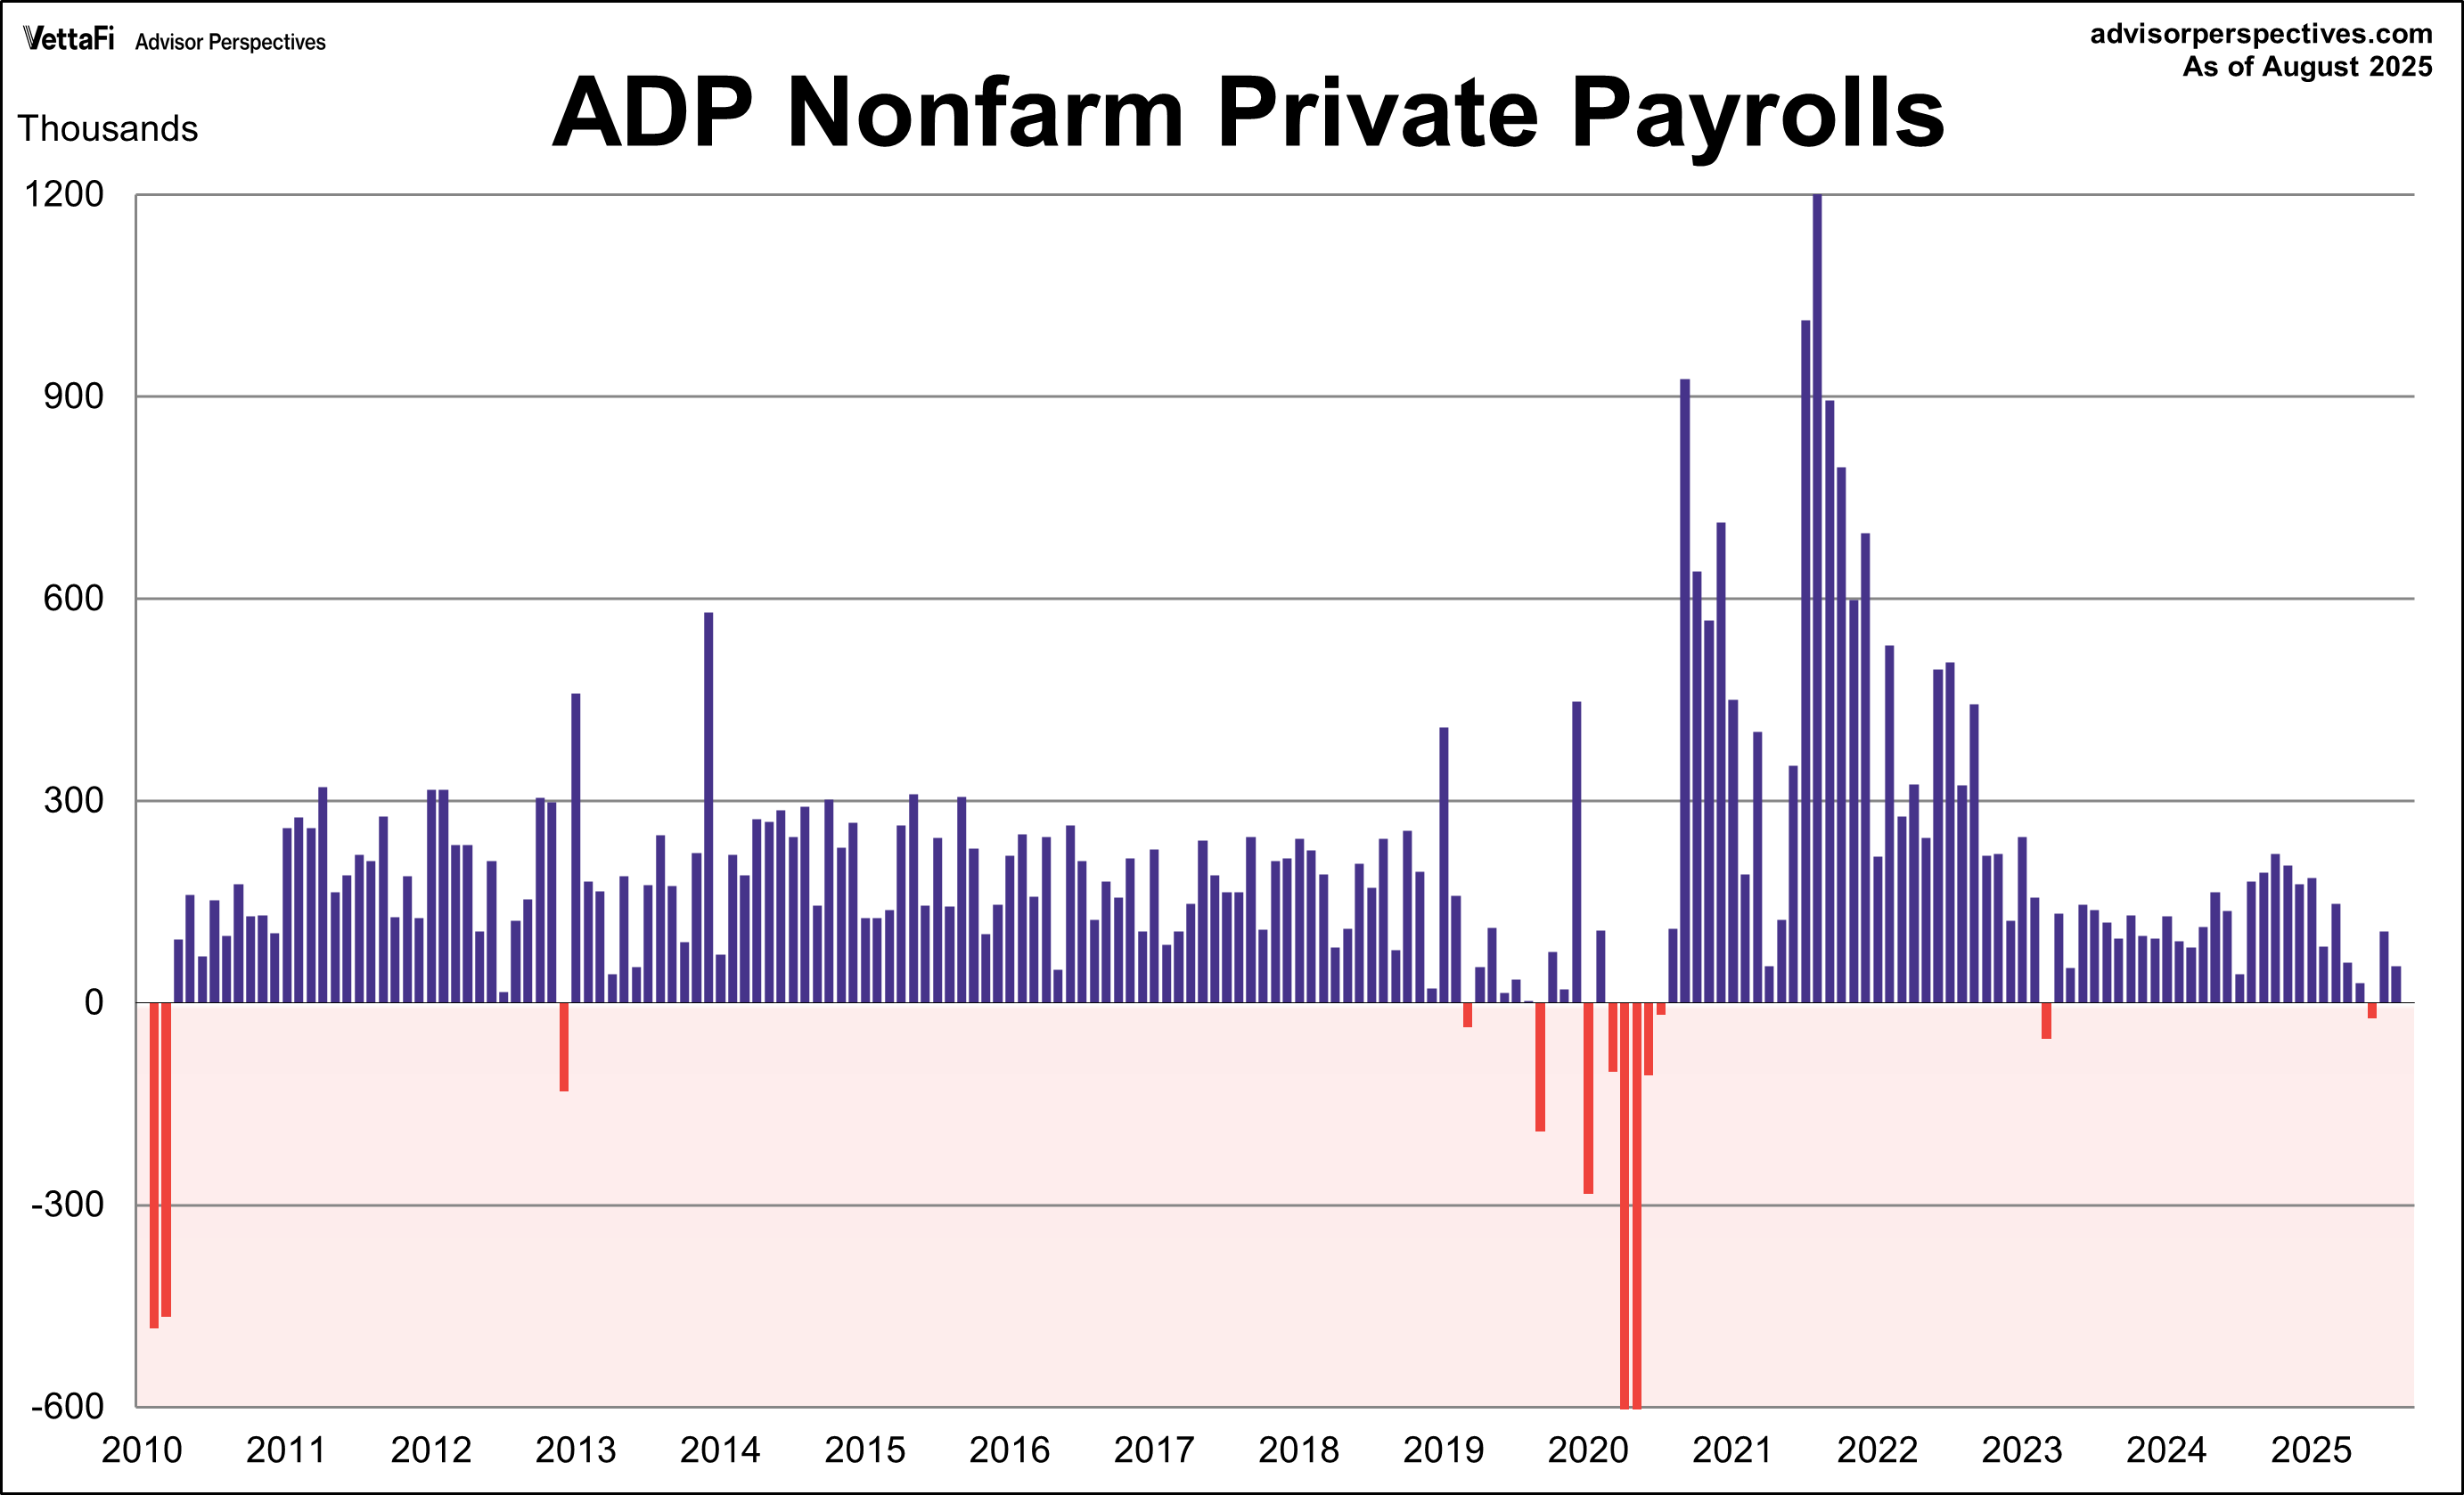
Like many other data points, the August ADP employment report continued to point to a softening labor market. According to the latest data, the private sector gained 54,000 jobs, a notable slowdown from the upwardly revised 106,000 addition in July. This figure also came in lower than the expected 73,000 addition. Private sector hiring has been slowing for most of the year, with the 6-month moving average at its lowest level since 2020.
The pickup in August was most notable in the leisure & hospitality industry, which added 50,000 jobs and accounted for over 90% of the month's private job growth. This hiring was not evenly distributed across establishment sizes, as large and mid-sized companies experienced the most significant activity, while smaller companies showed lower hiring numbers.
Weekly Unemployment Claims
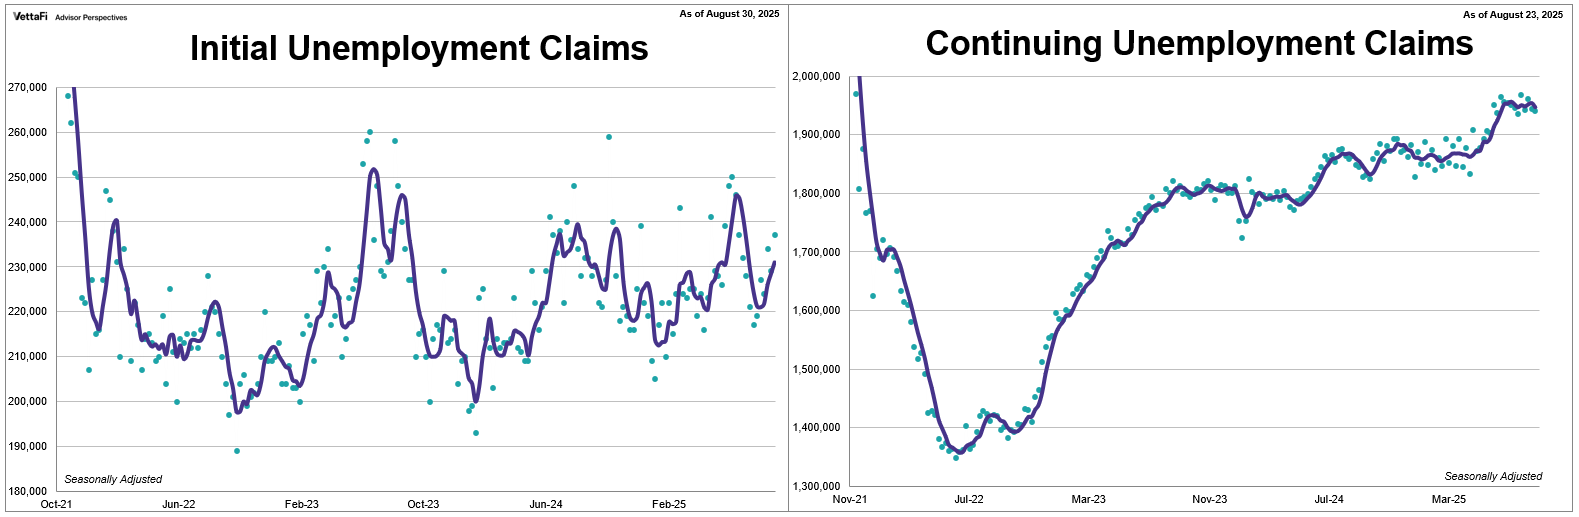
The number of people who filed for unemployment for the first time rose to its highest level in over two months. Initial jobless claims increased by 8,000 from the previous week’s figure to 237,000. The latest reading, with data through August 30th, was higher than the 230,000 forecast.
Meanwhile, the number of people who had already filed for unemployment and continued to claim benefits inched lower but remains near multi-year highs. Continuing jobless claims fell by 4,000 from the previous week’s downwardly revised figure to 1.940 million. The latest reading, with data through August 23rd, was just below the 1.960 million forecast.
IC claims have steadily risen over the past six weeks, suggesting the "low fire" narrative may no longer hold true. This rise, coupled with the ongoing difficulty for laid-off workers to find new jobs, points to a potential shift that it's becoming even more challenging to both find and keep a job.
Market Reactions
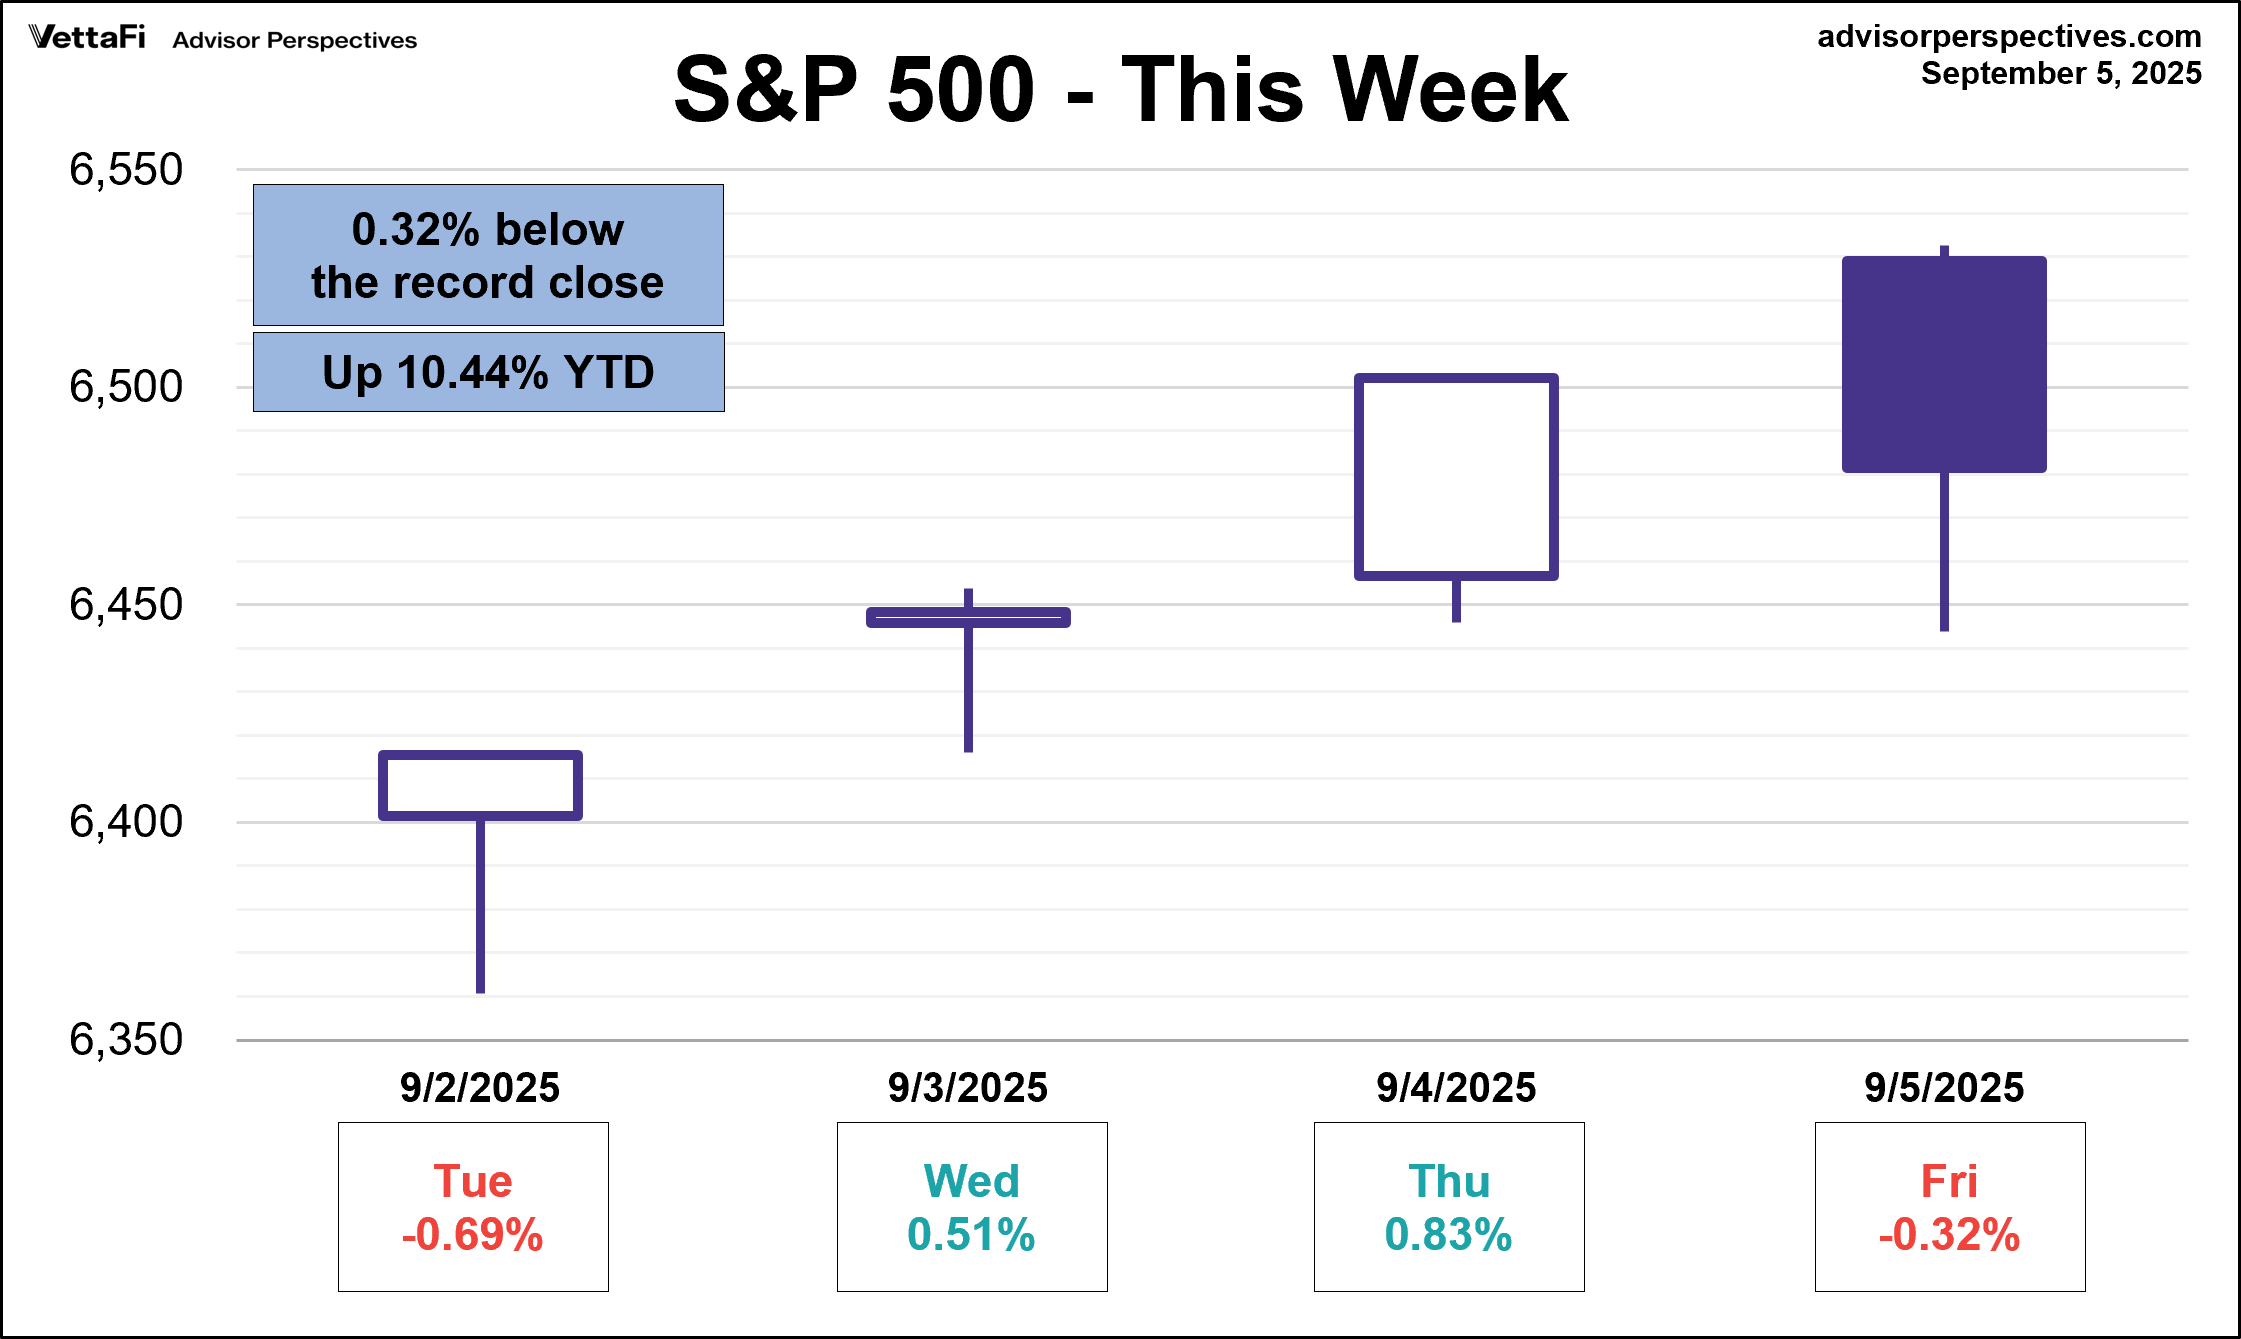
The S&P 500 notched another record high last week but slipped on Friday after August's weak jobs report. The index ultimately posted a gain of 0.3% for the week, its fourth in the past five weeks. As a result, the SPDR S&P 500 ETF Trust (SPY)rose 0.3% last week. Meanwhile, the S&P Equal Weight Index was down 0.1% from the previous week and the Invesco S&P 500® Equal Weight ETF (RSP) fell 0.1%.
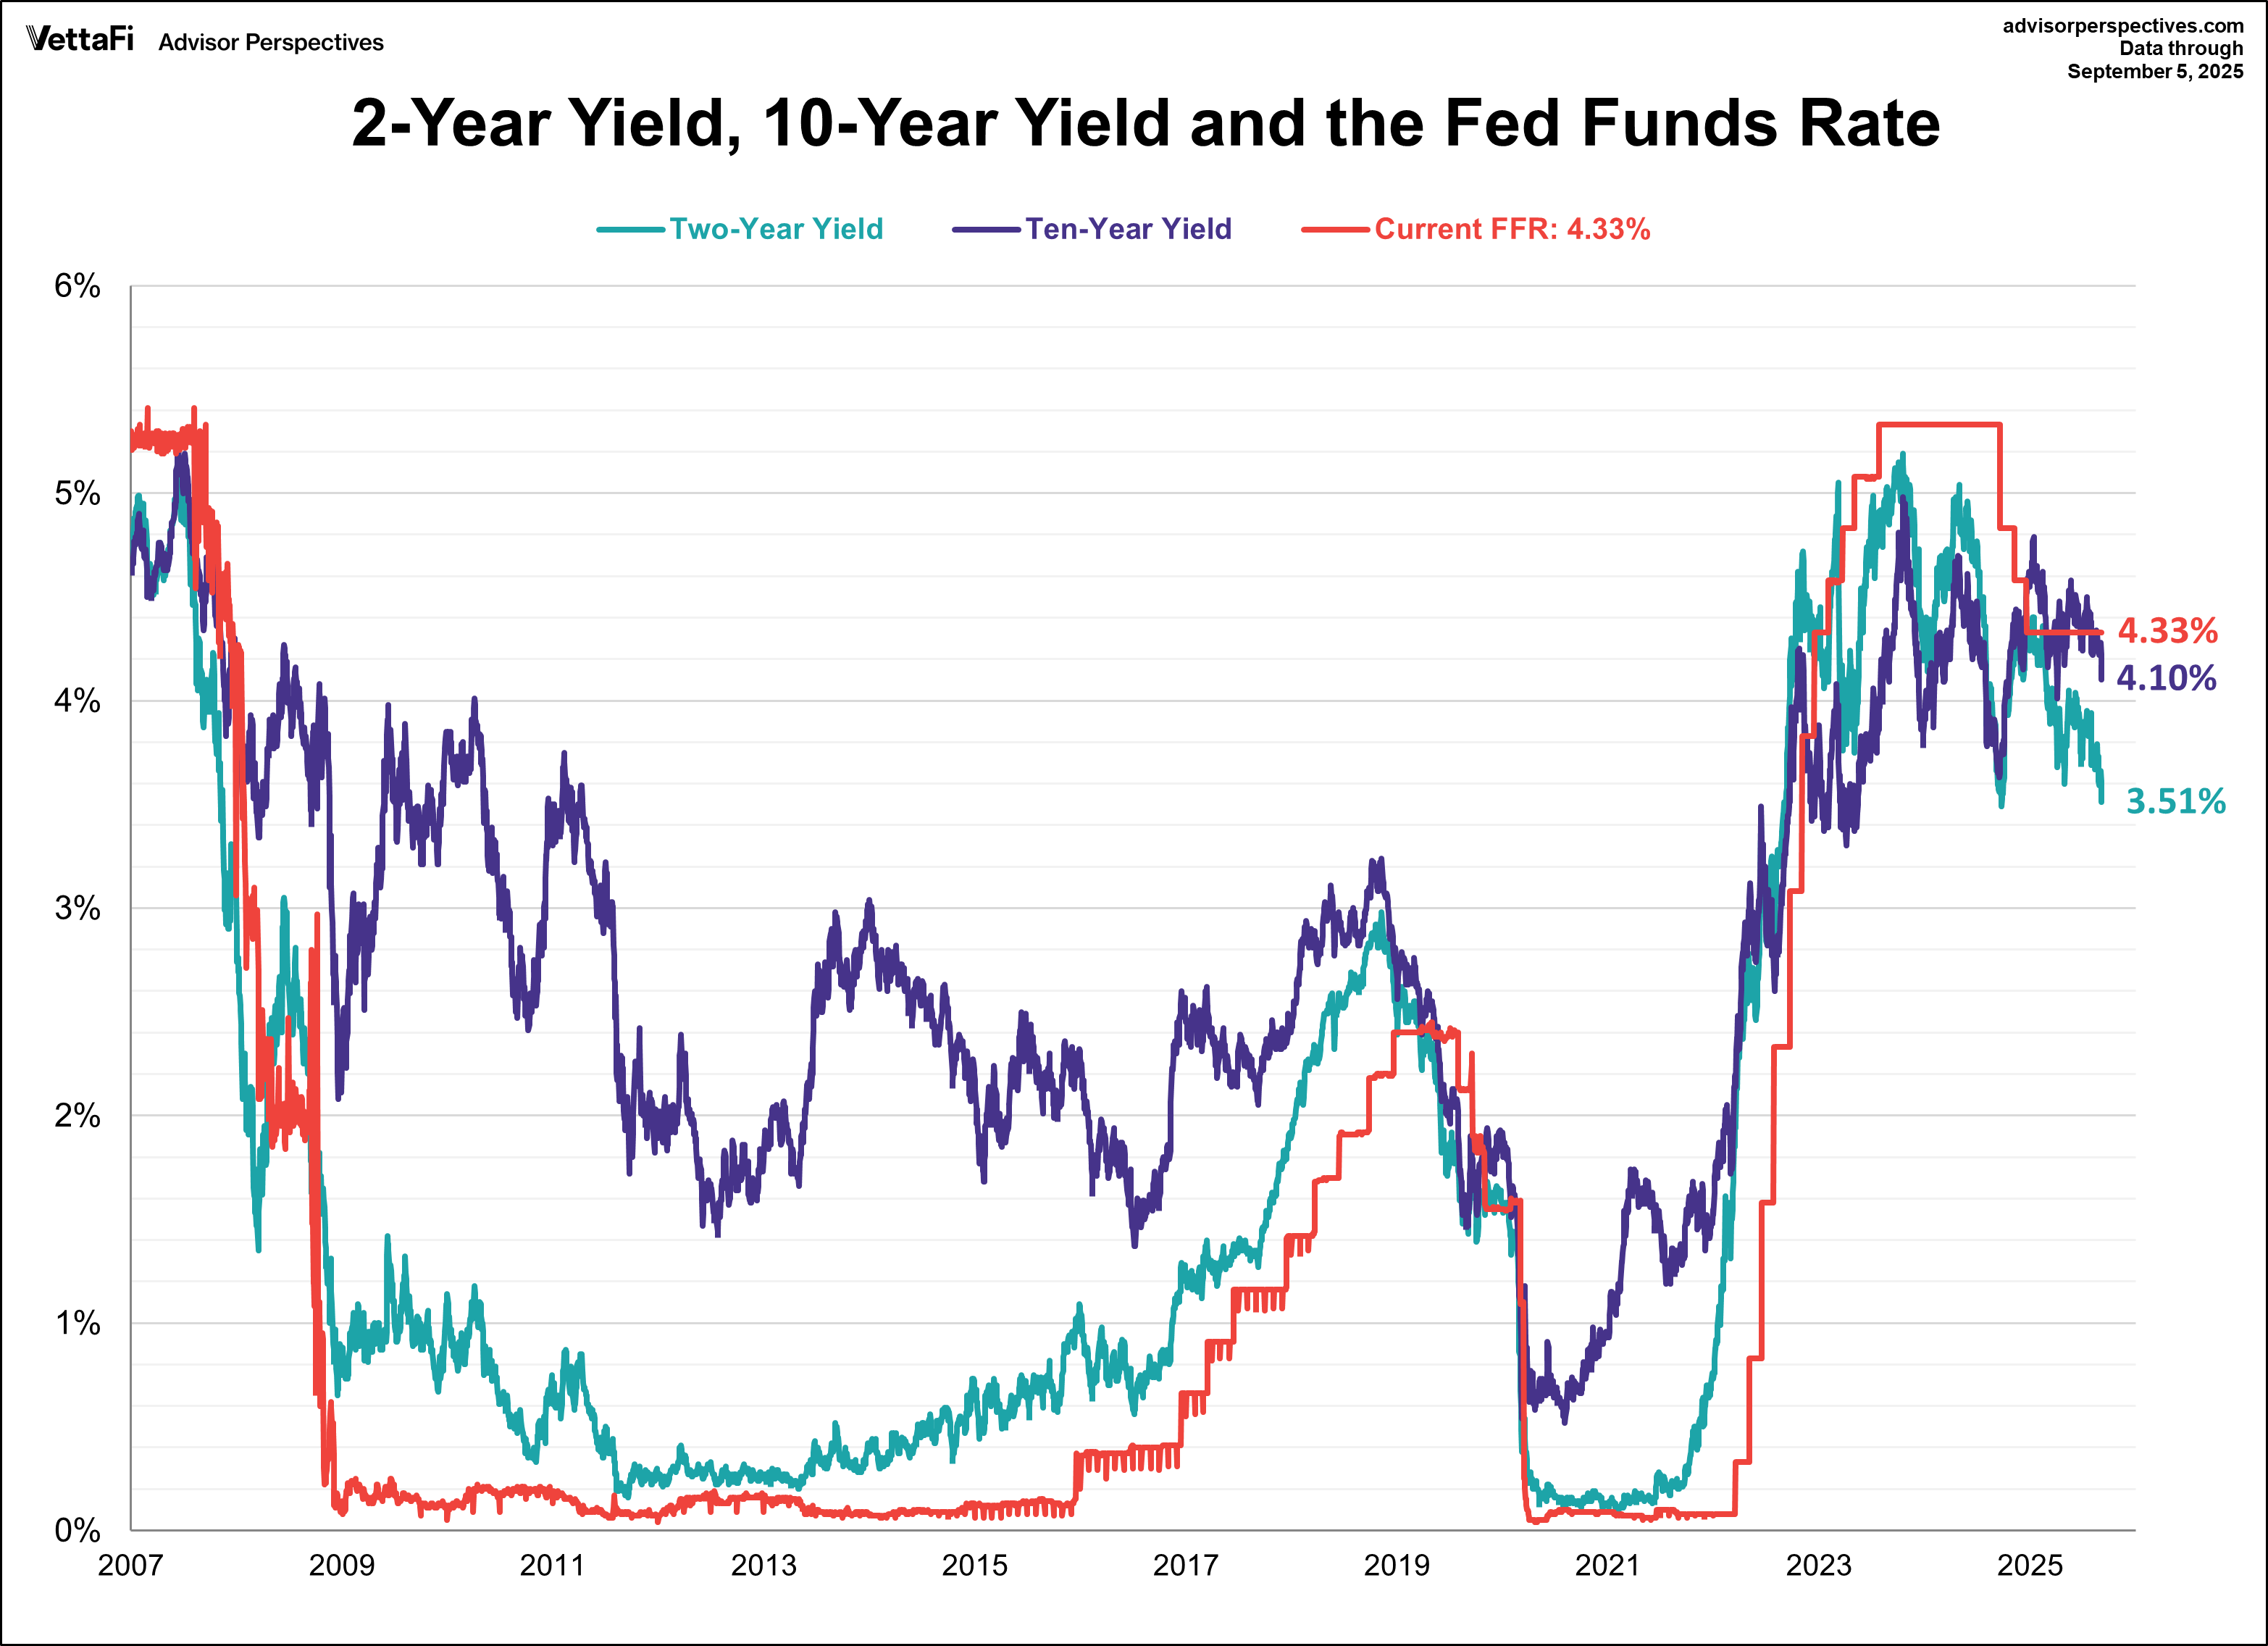
The 10-year Treasury yield finished last week at 4.10%, its lowest level since the beginning of April. Meanwhile the 2-year note finished at 3.51%, its lowest level since September 2024.
The CME FedWatch Tool currently shows an 88% chance of a 25 basis point rate cut and a 12% chance of a 50 basis point cut at next week's Fed meeting. Markets are also pricing in two additional 25 basis point cuts at the October and December meetings this year and three more in 2026.
Economic Data in the Week Ahead
The upcoming week will feature a handful of closely watched economic indicators, all shedding light on the state of inflation and consumer confidence. The Bureau of Labor Statistics will first release the Producer Price Index (PPI) for August on Wednesday, followed by the Consumer Price Index (CPI) on Thursday, which will provide the latest inflation update. These reports will be closely watched by consumers, businesses, investors, and policymakers as inflation continues to be a key driver of economic decisions. Then on Friday, the University of Michigan will release its preliminary consumer sentiment report for September. Consumer sentiment has been subdued in recent months as consumers grow increasingly pessimistic about the economy and show concerns that inflation will heat up in the future.
Read more updates by Jen Nash