Our commentary on household income distribution focuses on arithmetic mean (average) household incomes by quintile (and the top 5%) over the 50+ year history of this data series. The analysis offers some fascinating insights into U.S. household incomes. However, a quintile-based analysis doesn't fully capture the impact of age on income.
Households are by no means locked into the same quintile over time. Young educated households with professional skills and aspirations will typically move into the higher-earning brackets during their financial life cycles. Households dependent on income from unskilled labor and non-professional service employment will not see the same financial progress over the years.
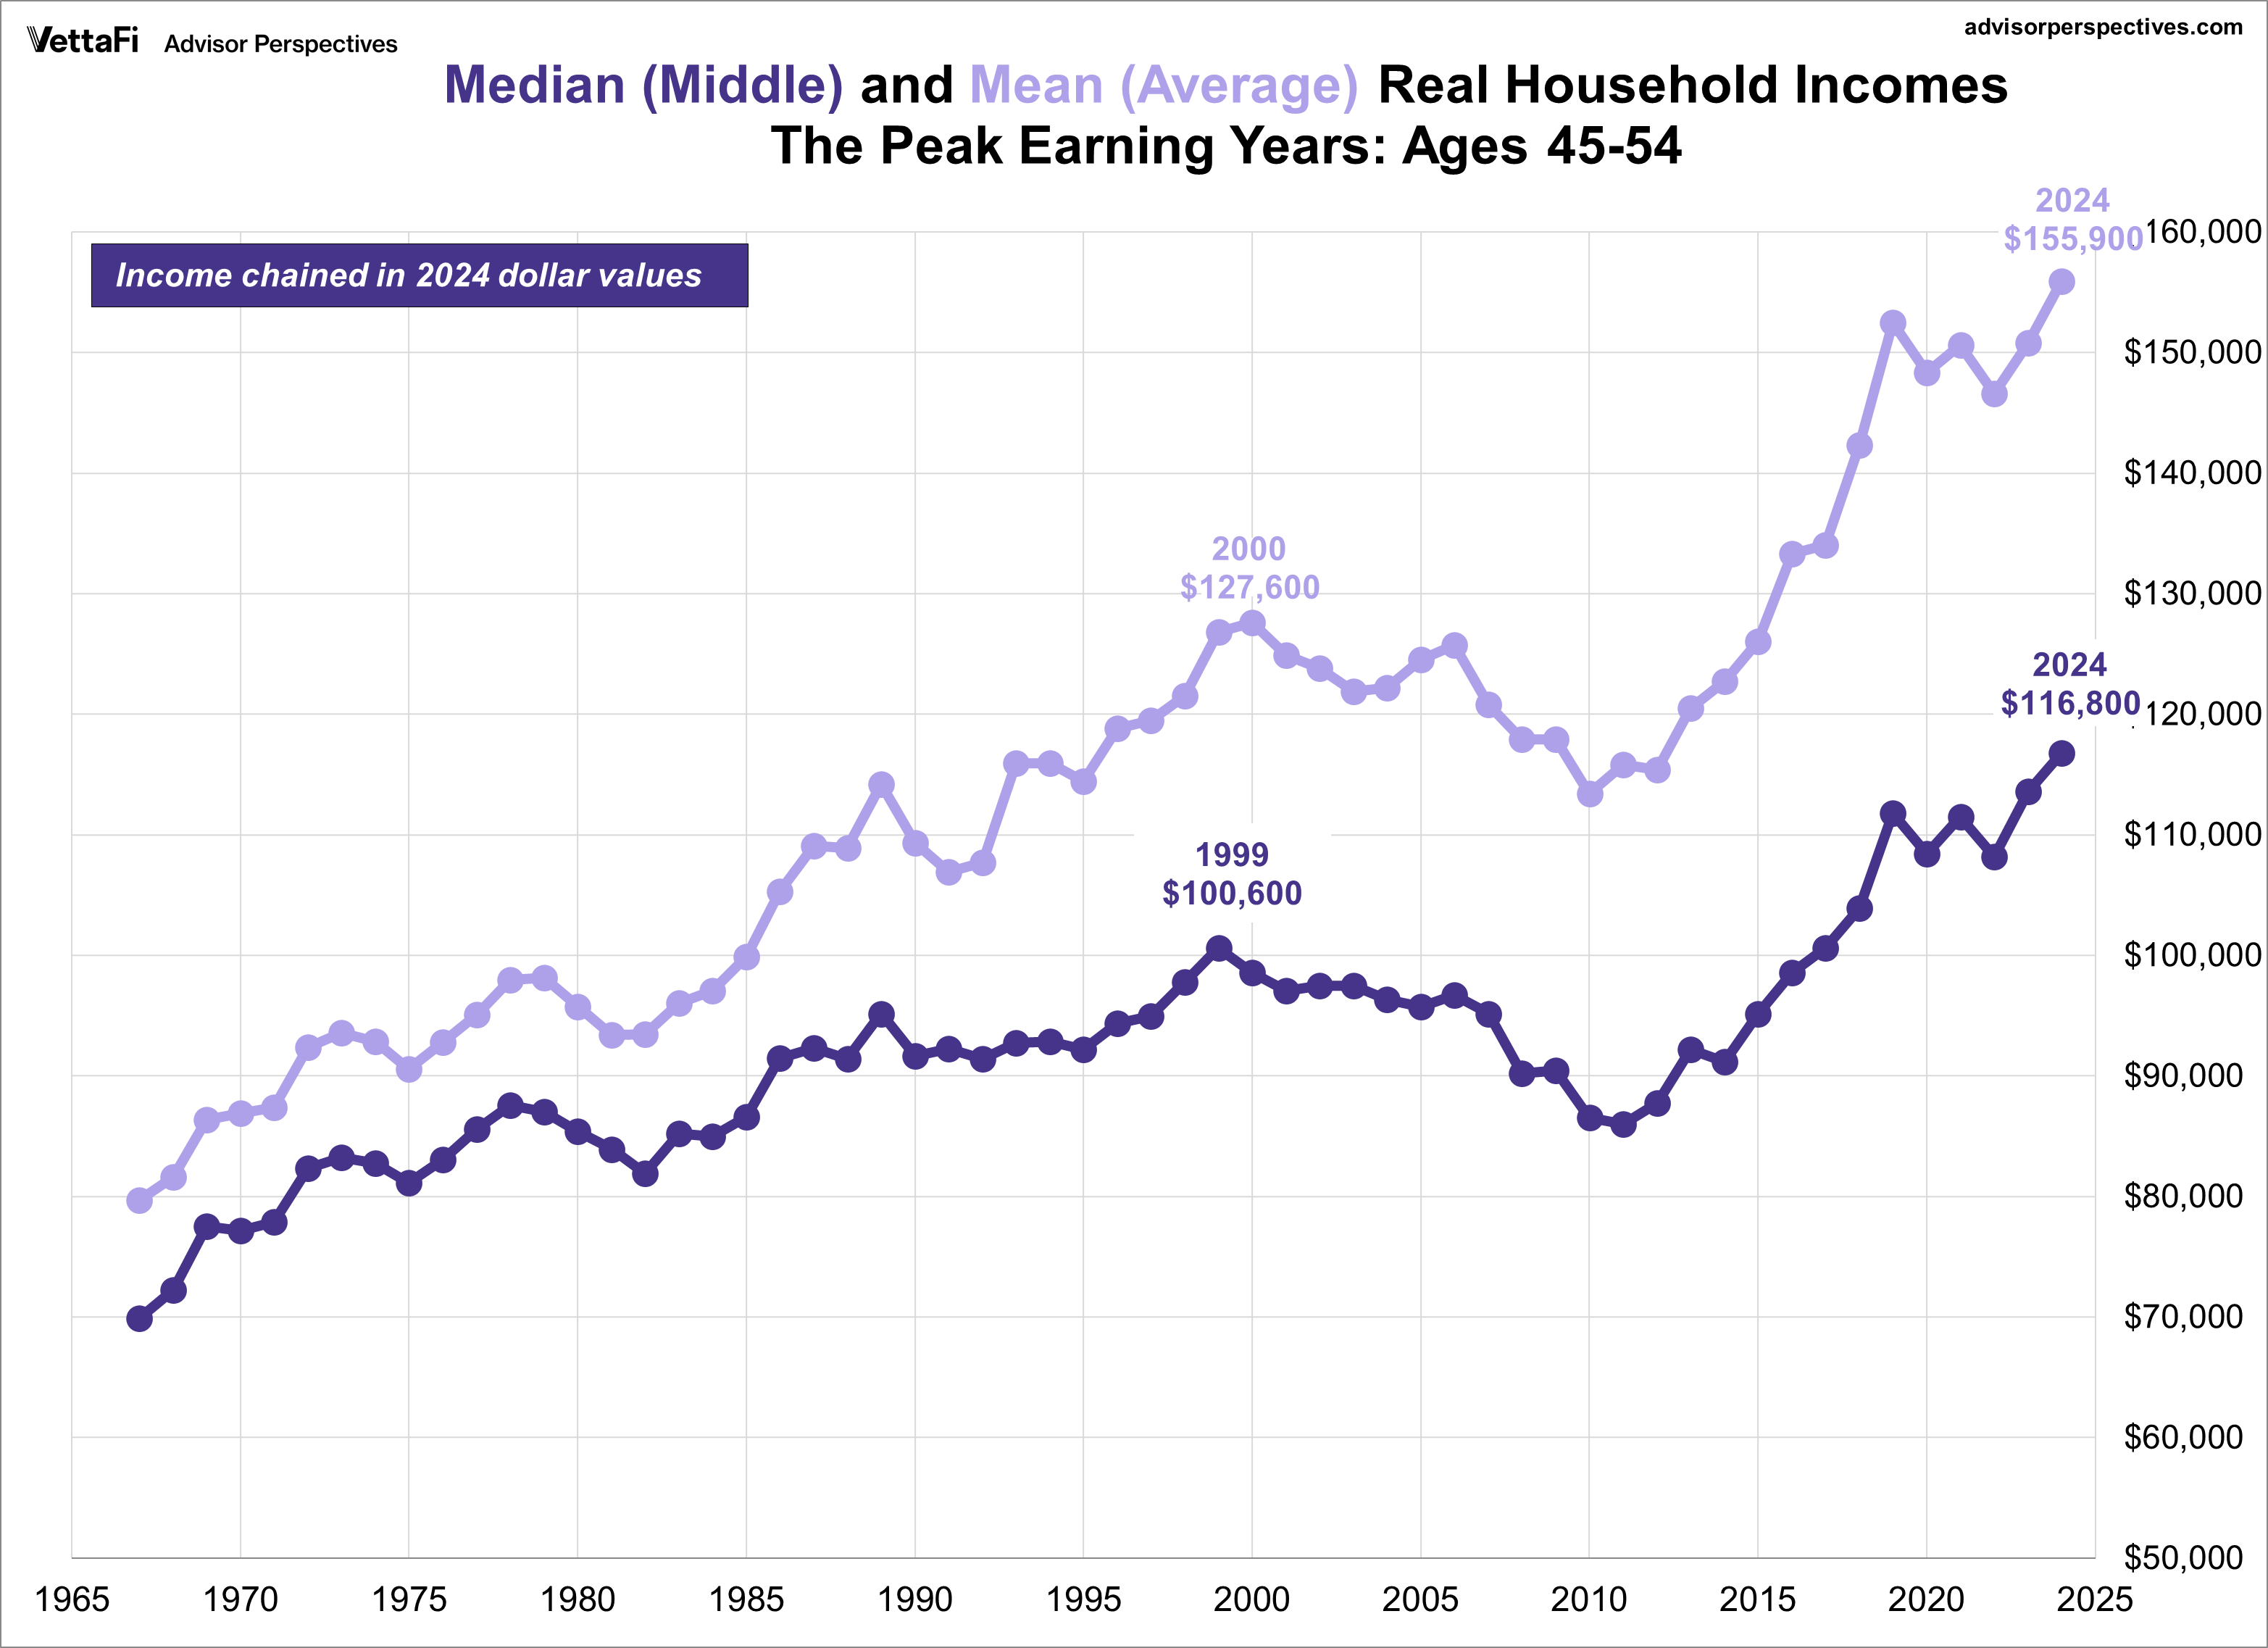
Let's review the household income data another way, this time focusing on the median (middle) household income for various age brackets. Because this is a longitudinal analysis across nearly five decades, we've used the Census Bureau's real (inflation-adjusted) series chained in 2024 dollars. In other words, the incomes in earlier years have been adjusted upward to the purchasing power of the most recent year in the series.
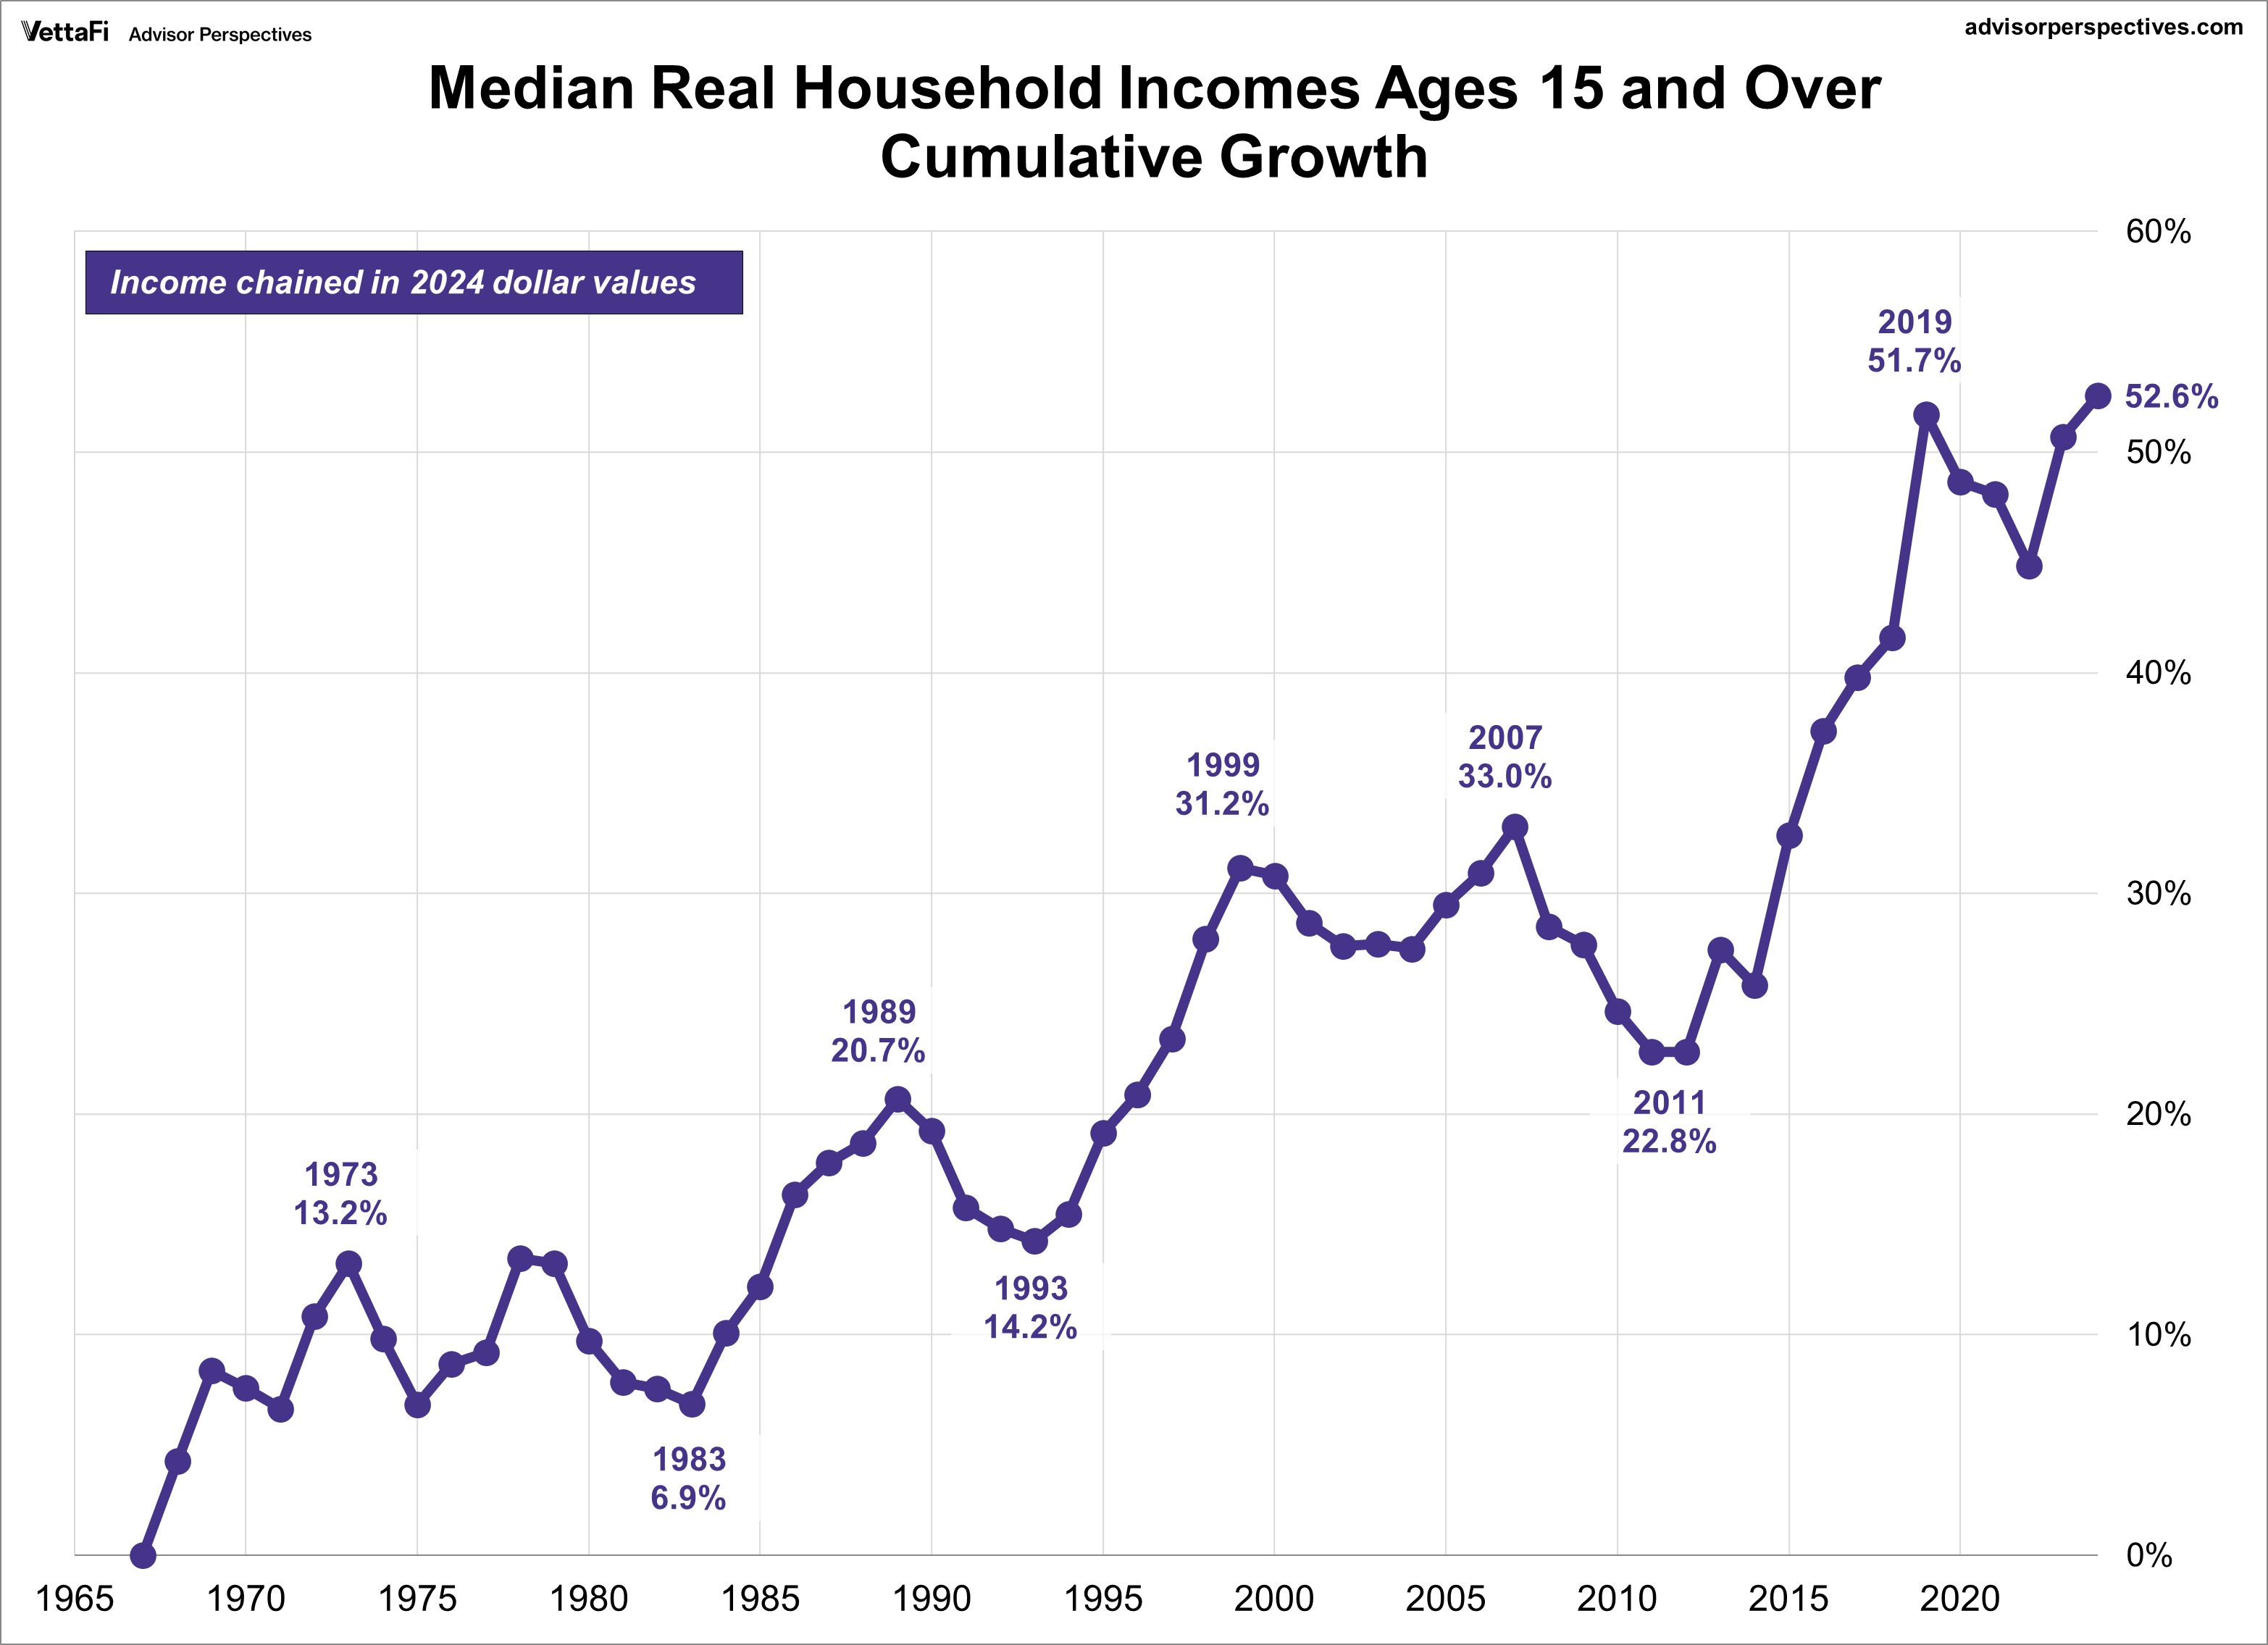
To set the stage, the chart below shows the cumulative growth of median real household incomes for all households (ages 15 and over) since 1967. It provides a macro view before we break down the data by individual age groups.
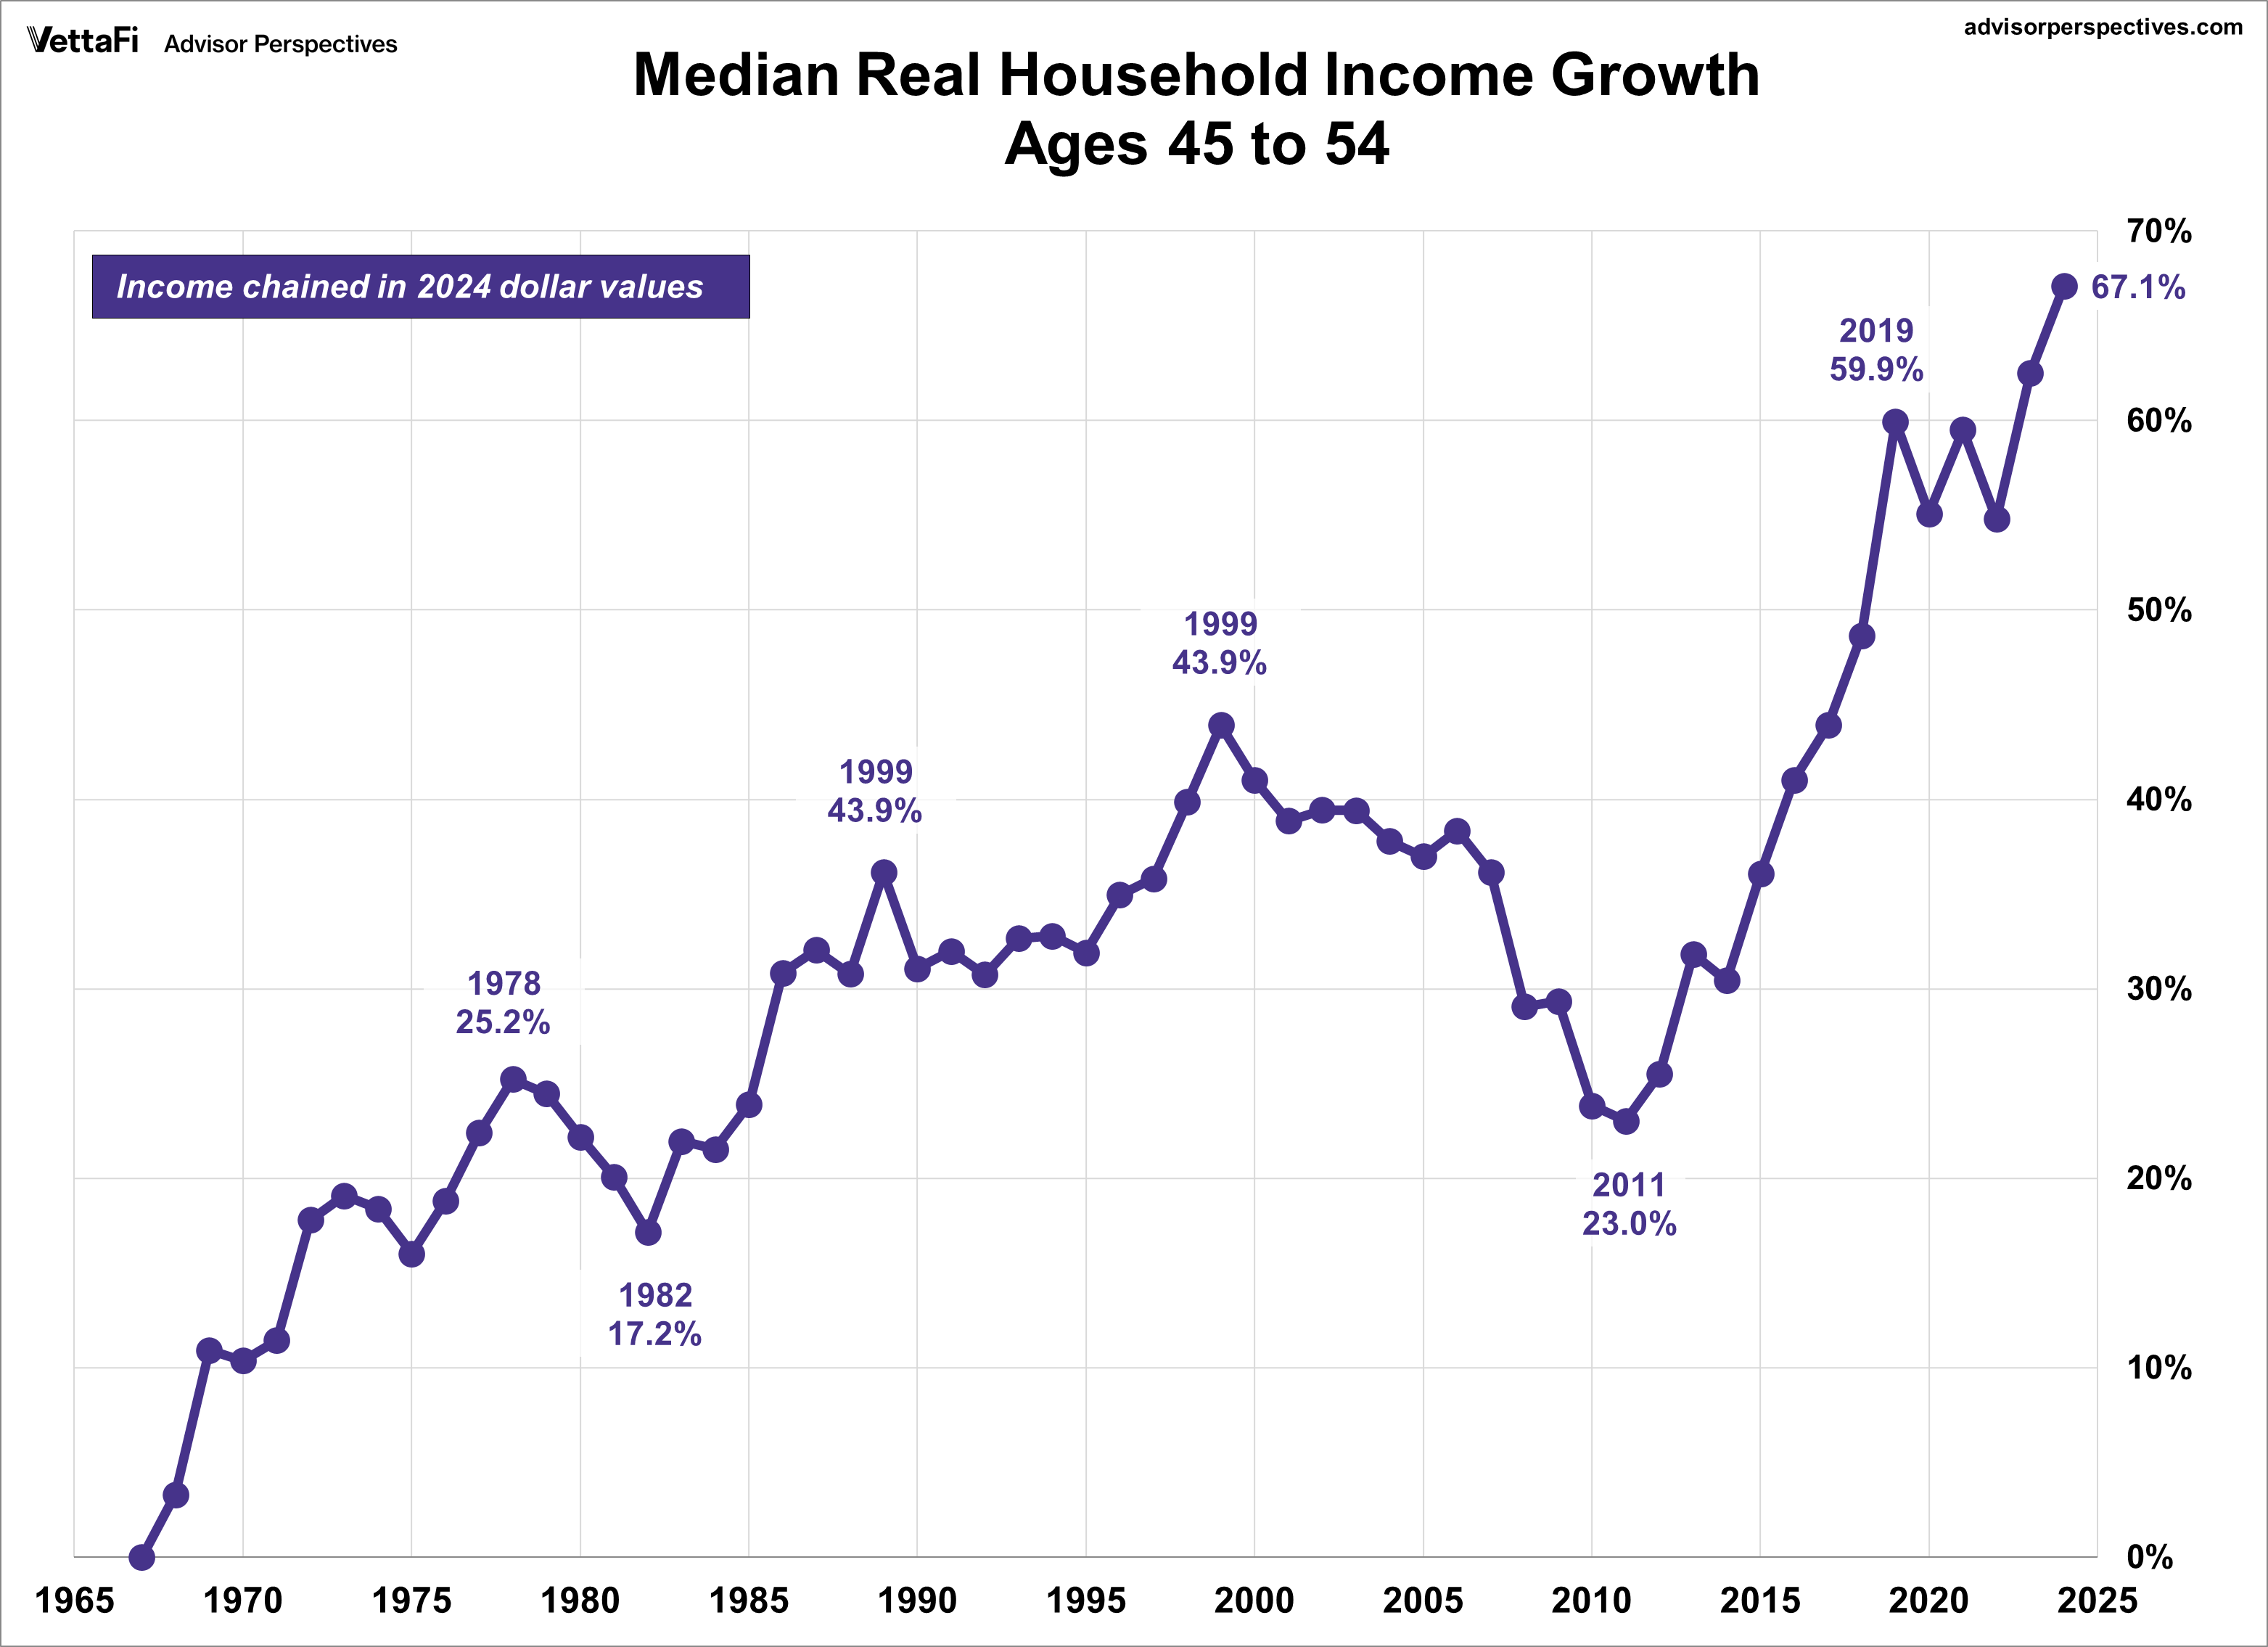
With that big-picture trend established, the next chart reveals how specific age groups contribute to it, revealing a clear lifecycle pattern: income rises with age, peaks in the middle years, and then declines during retirement.
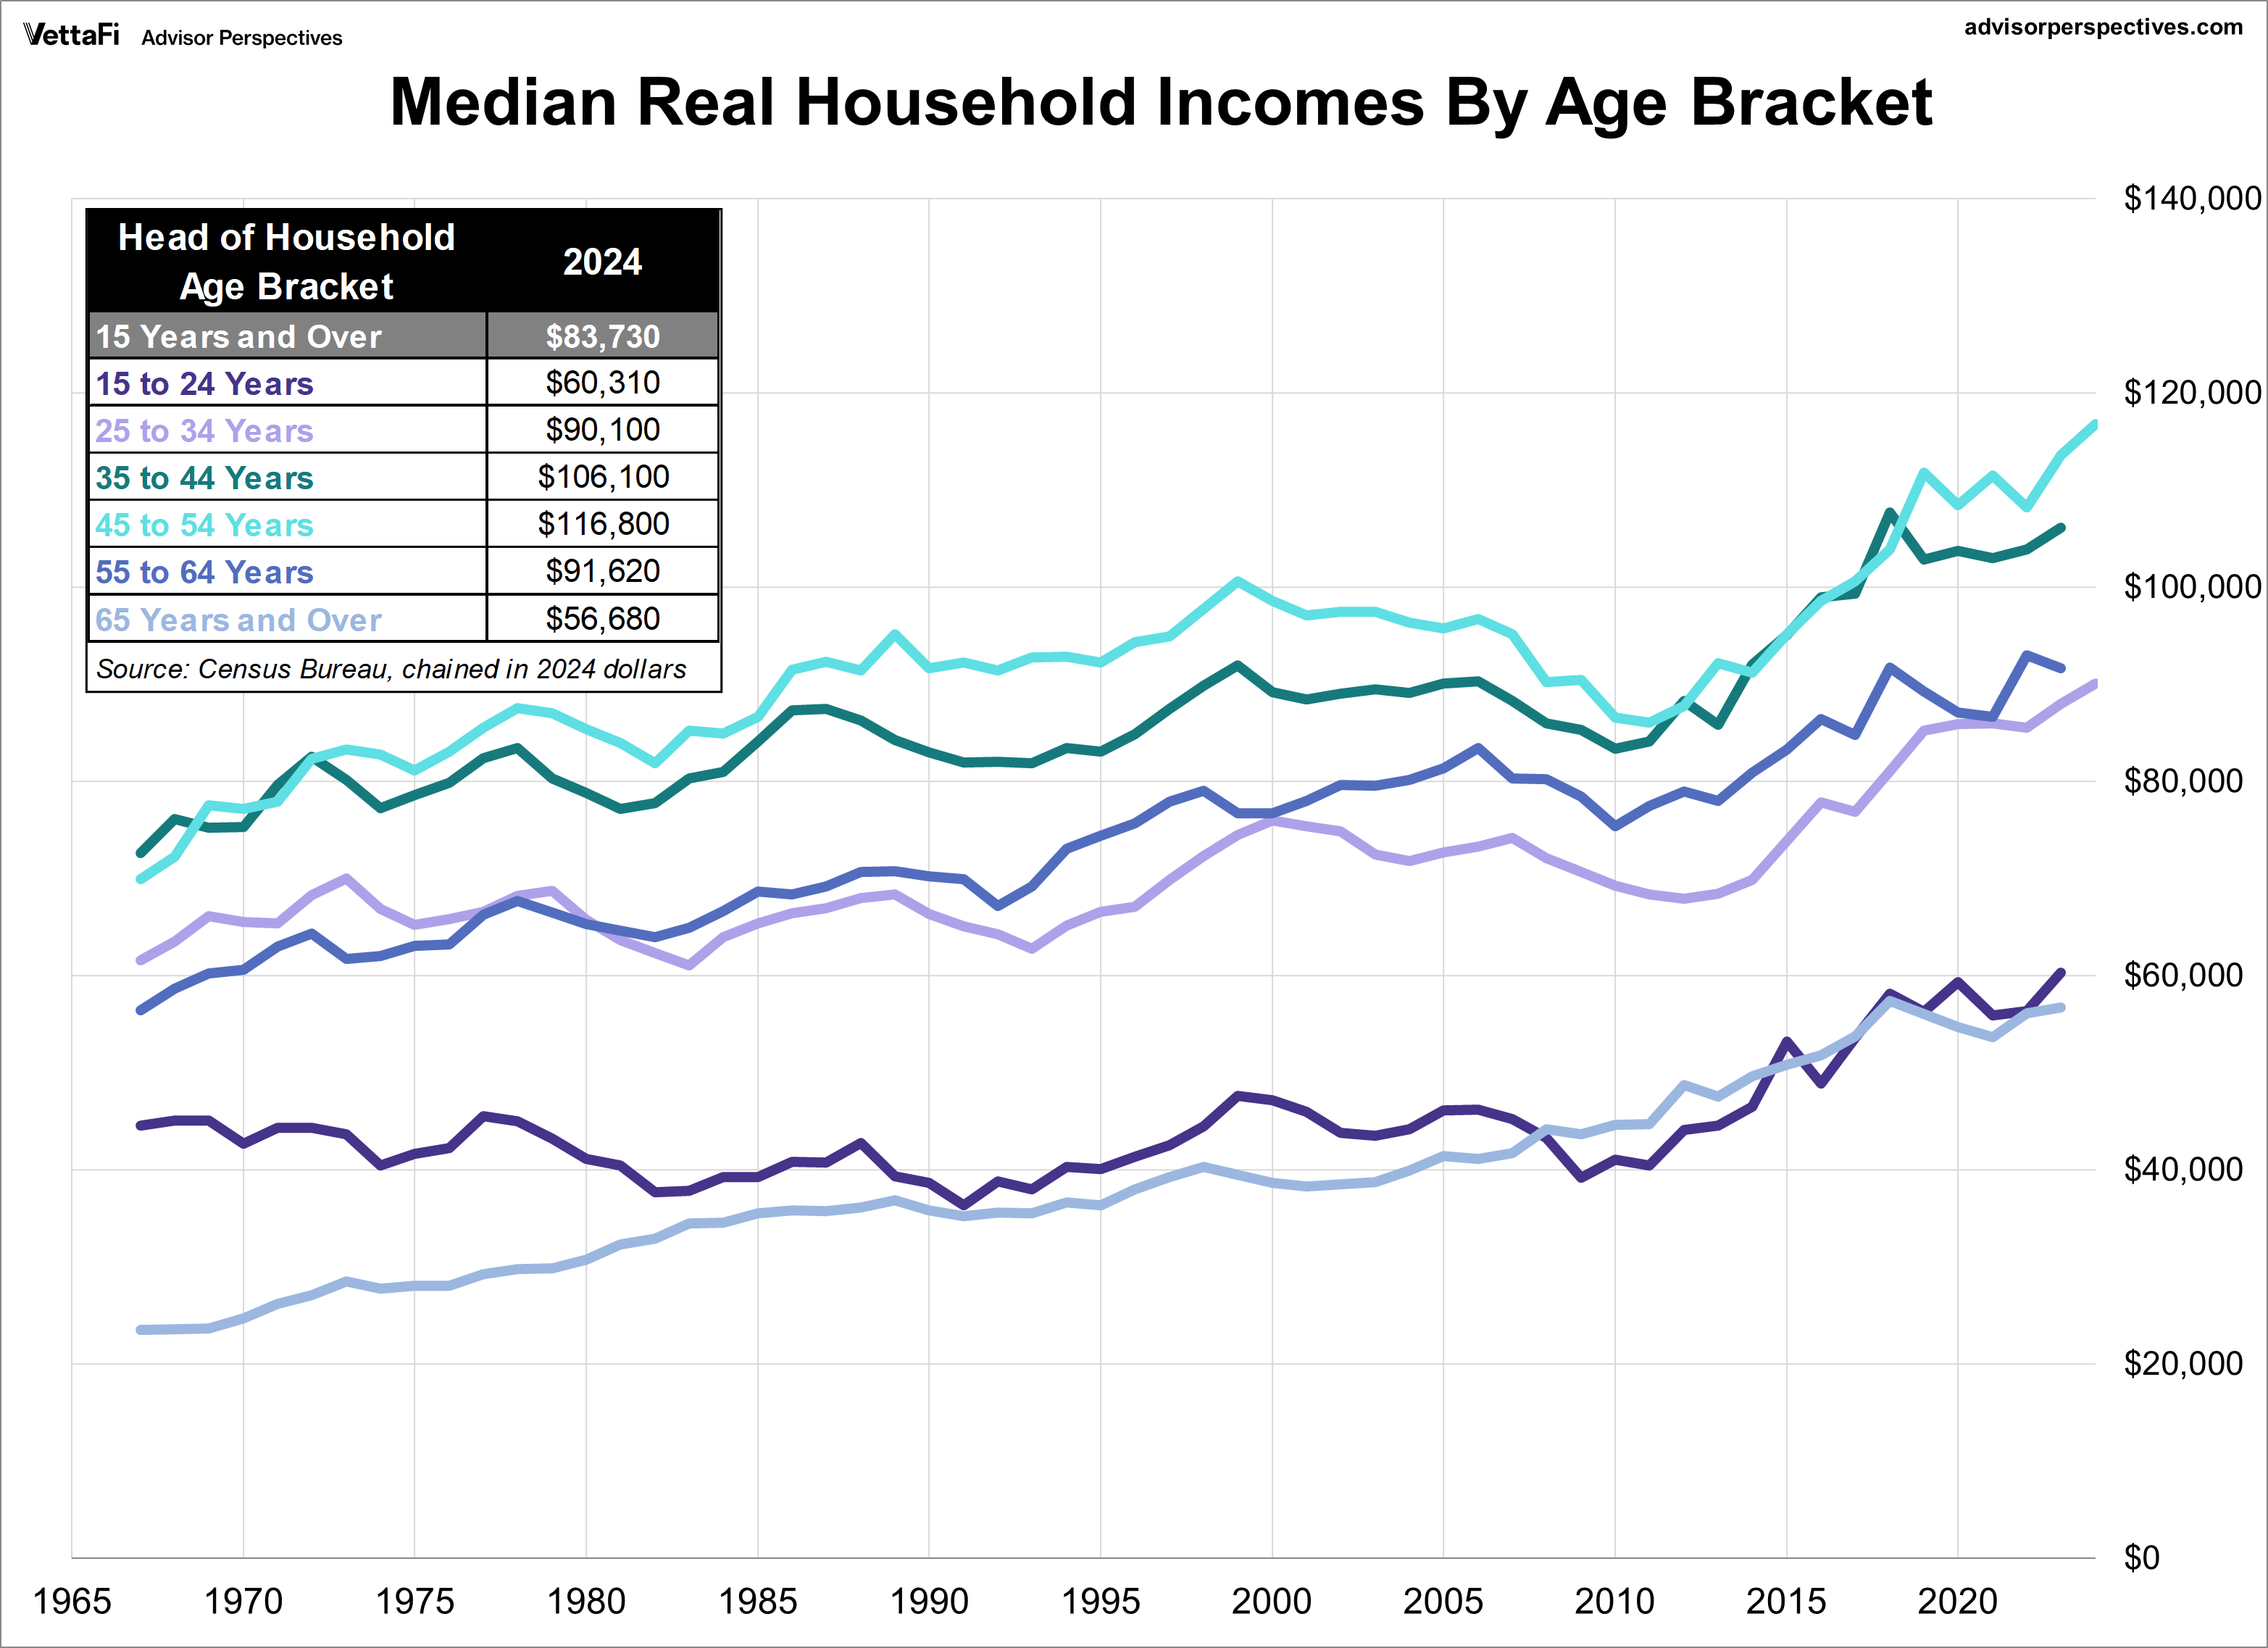
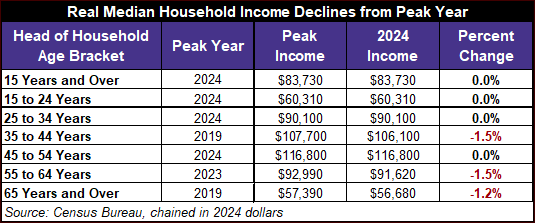
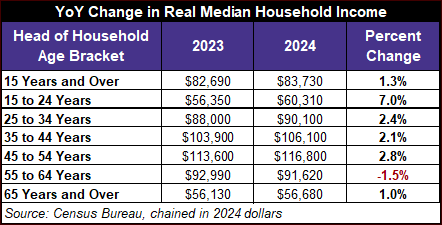
A more precise look at year-over-year changes from 2023 to 2024 reveals that the majority of cohorts saw growth. The youngest group (15-24 years) saw the largest increase at a remarkable 7.0%. In contrast, the 55-64 age bracket was the sole loser, experiencing a -1.5% decline.
Household Income Growth by Age
To give us a better idea of the underlying trends in household incomes, we've also prepared a chart of the real cumulative growth of median incomes for the six age brackets since 1967.
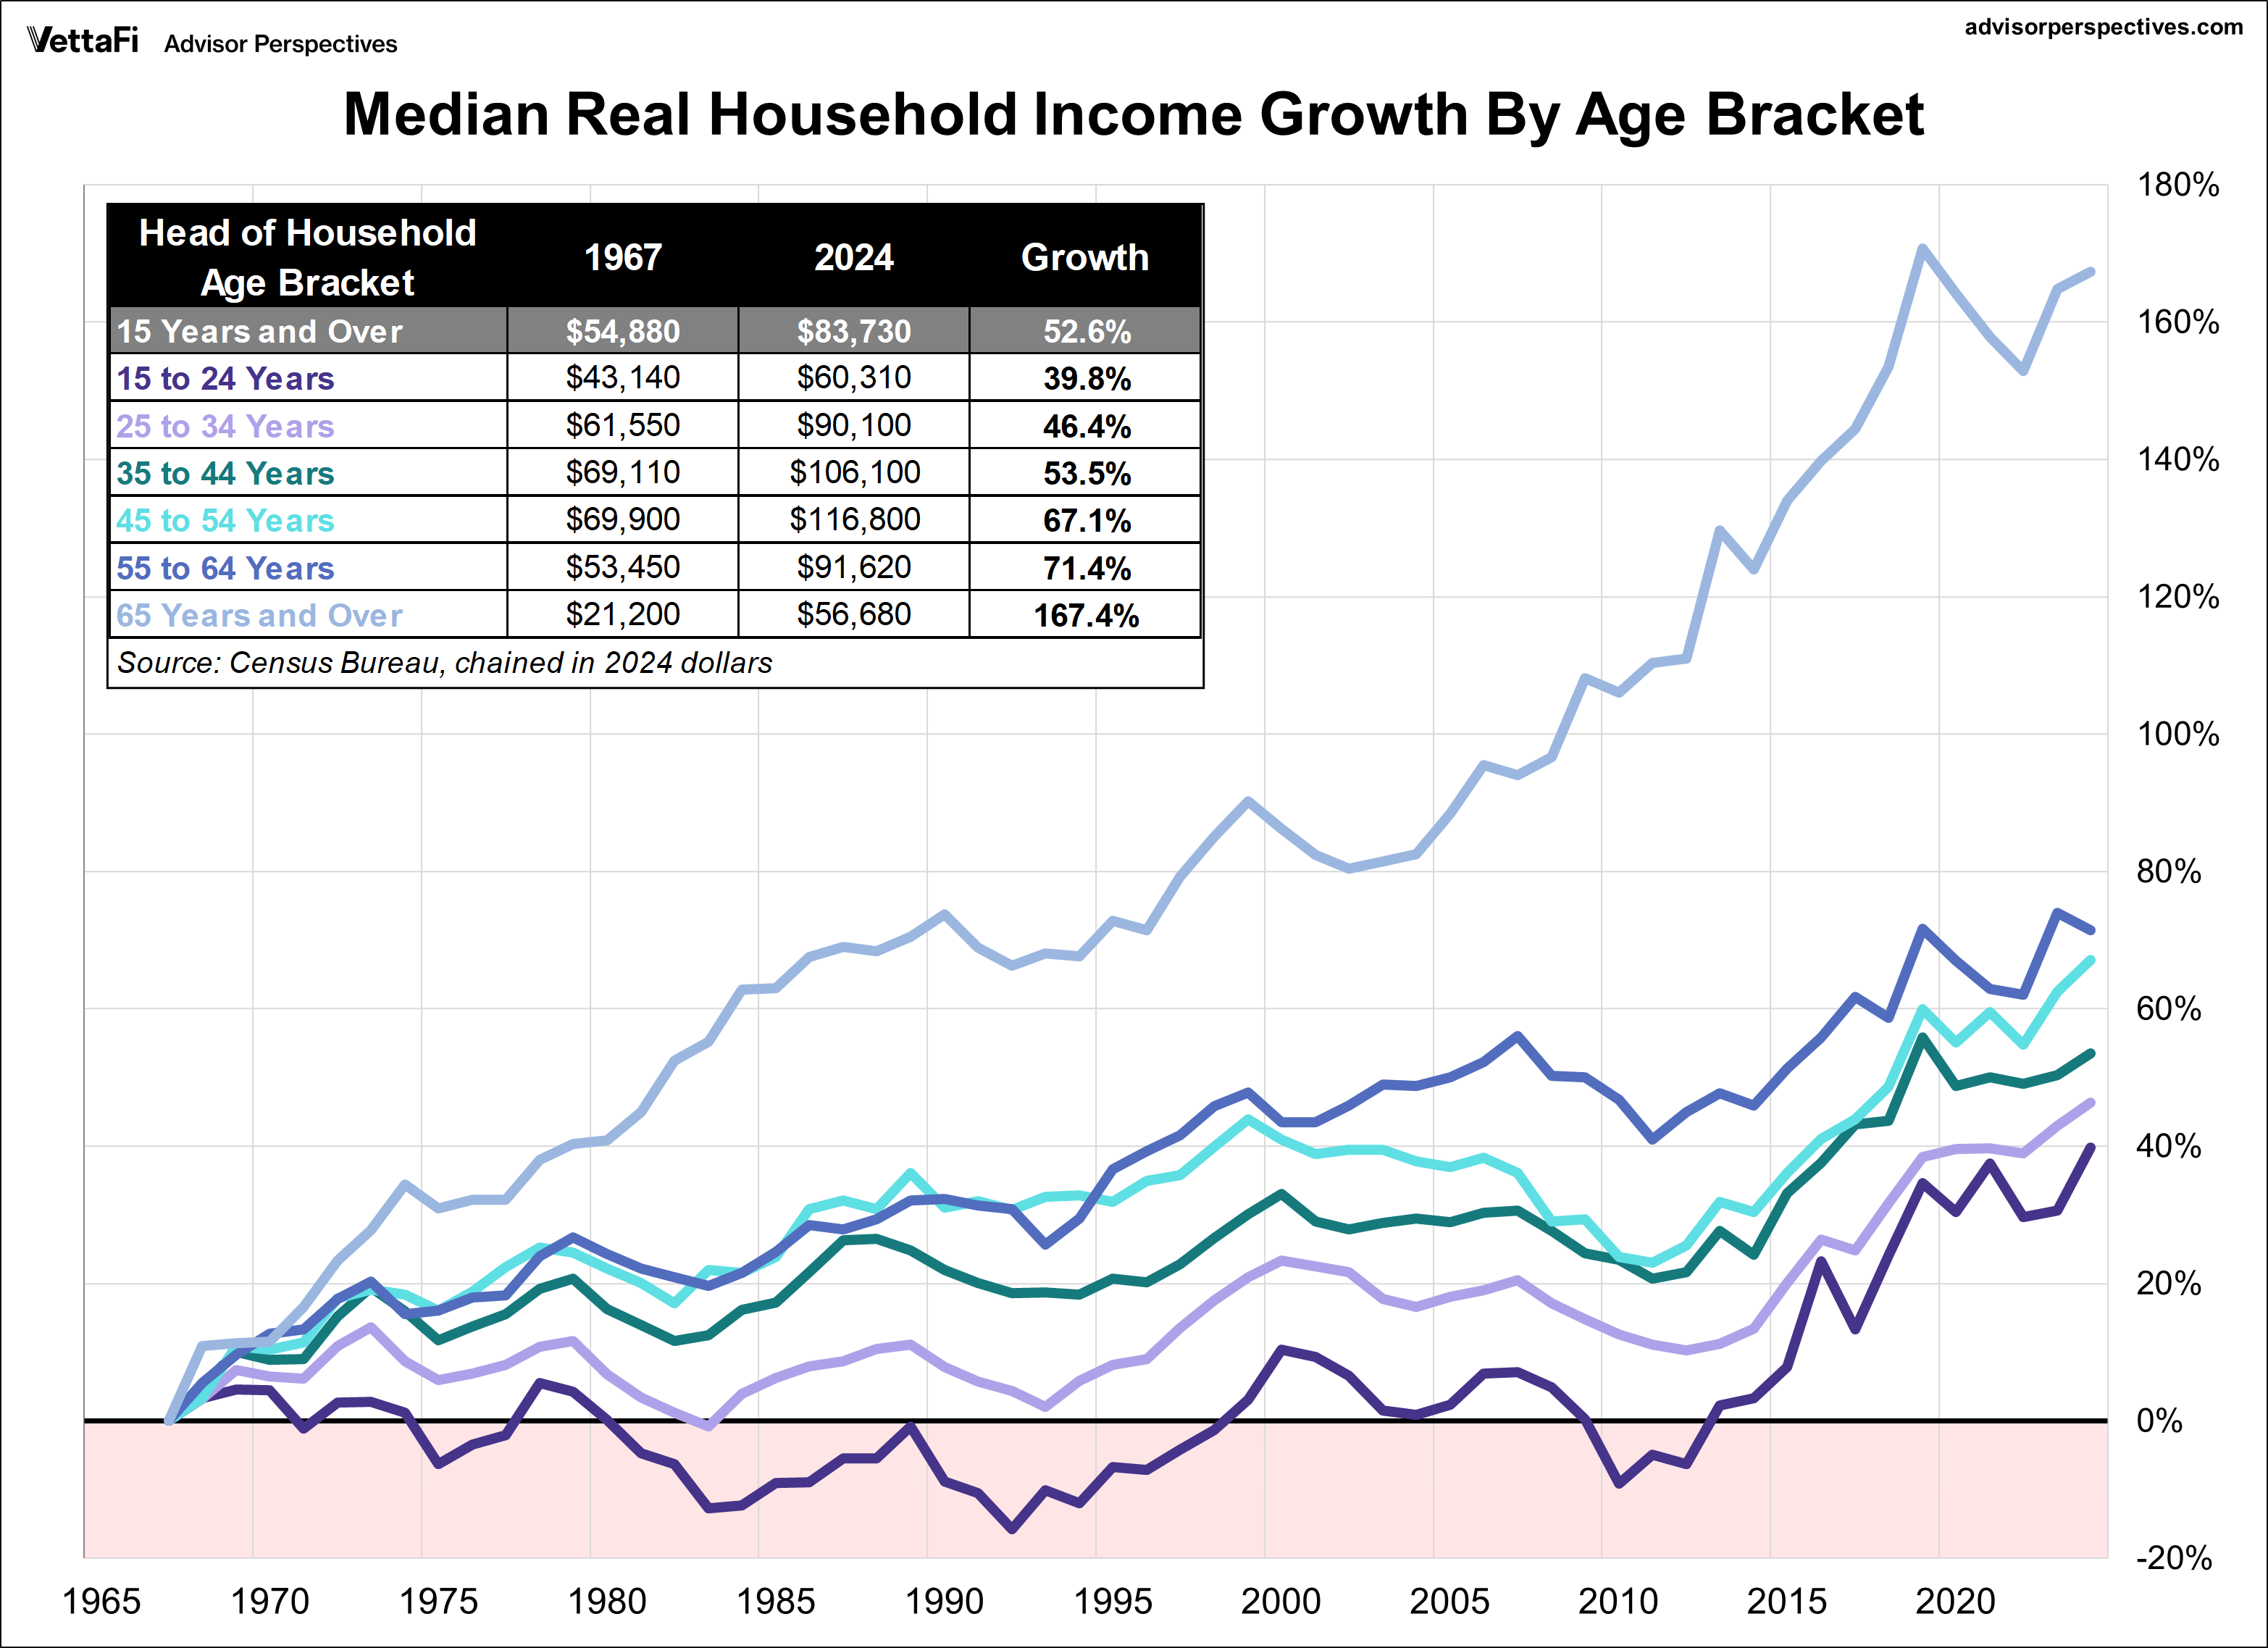
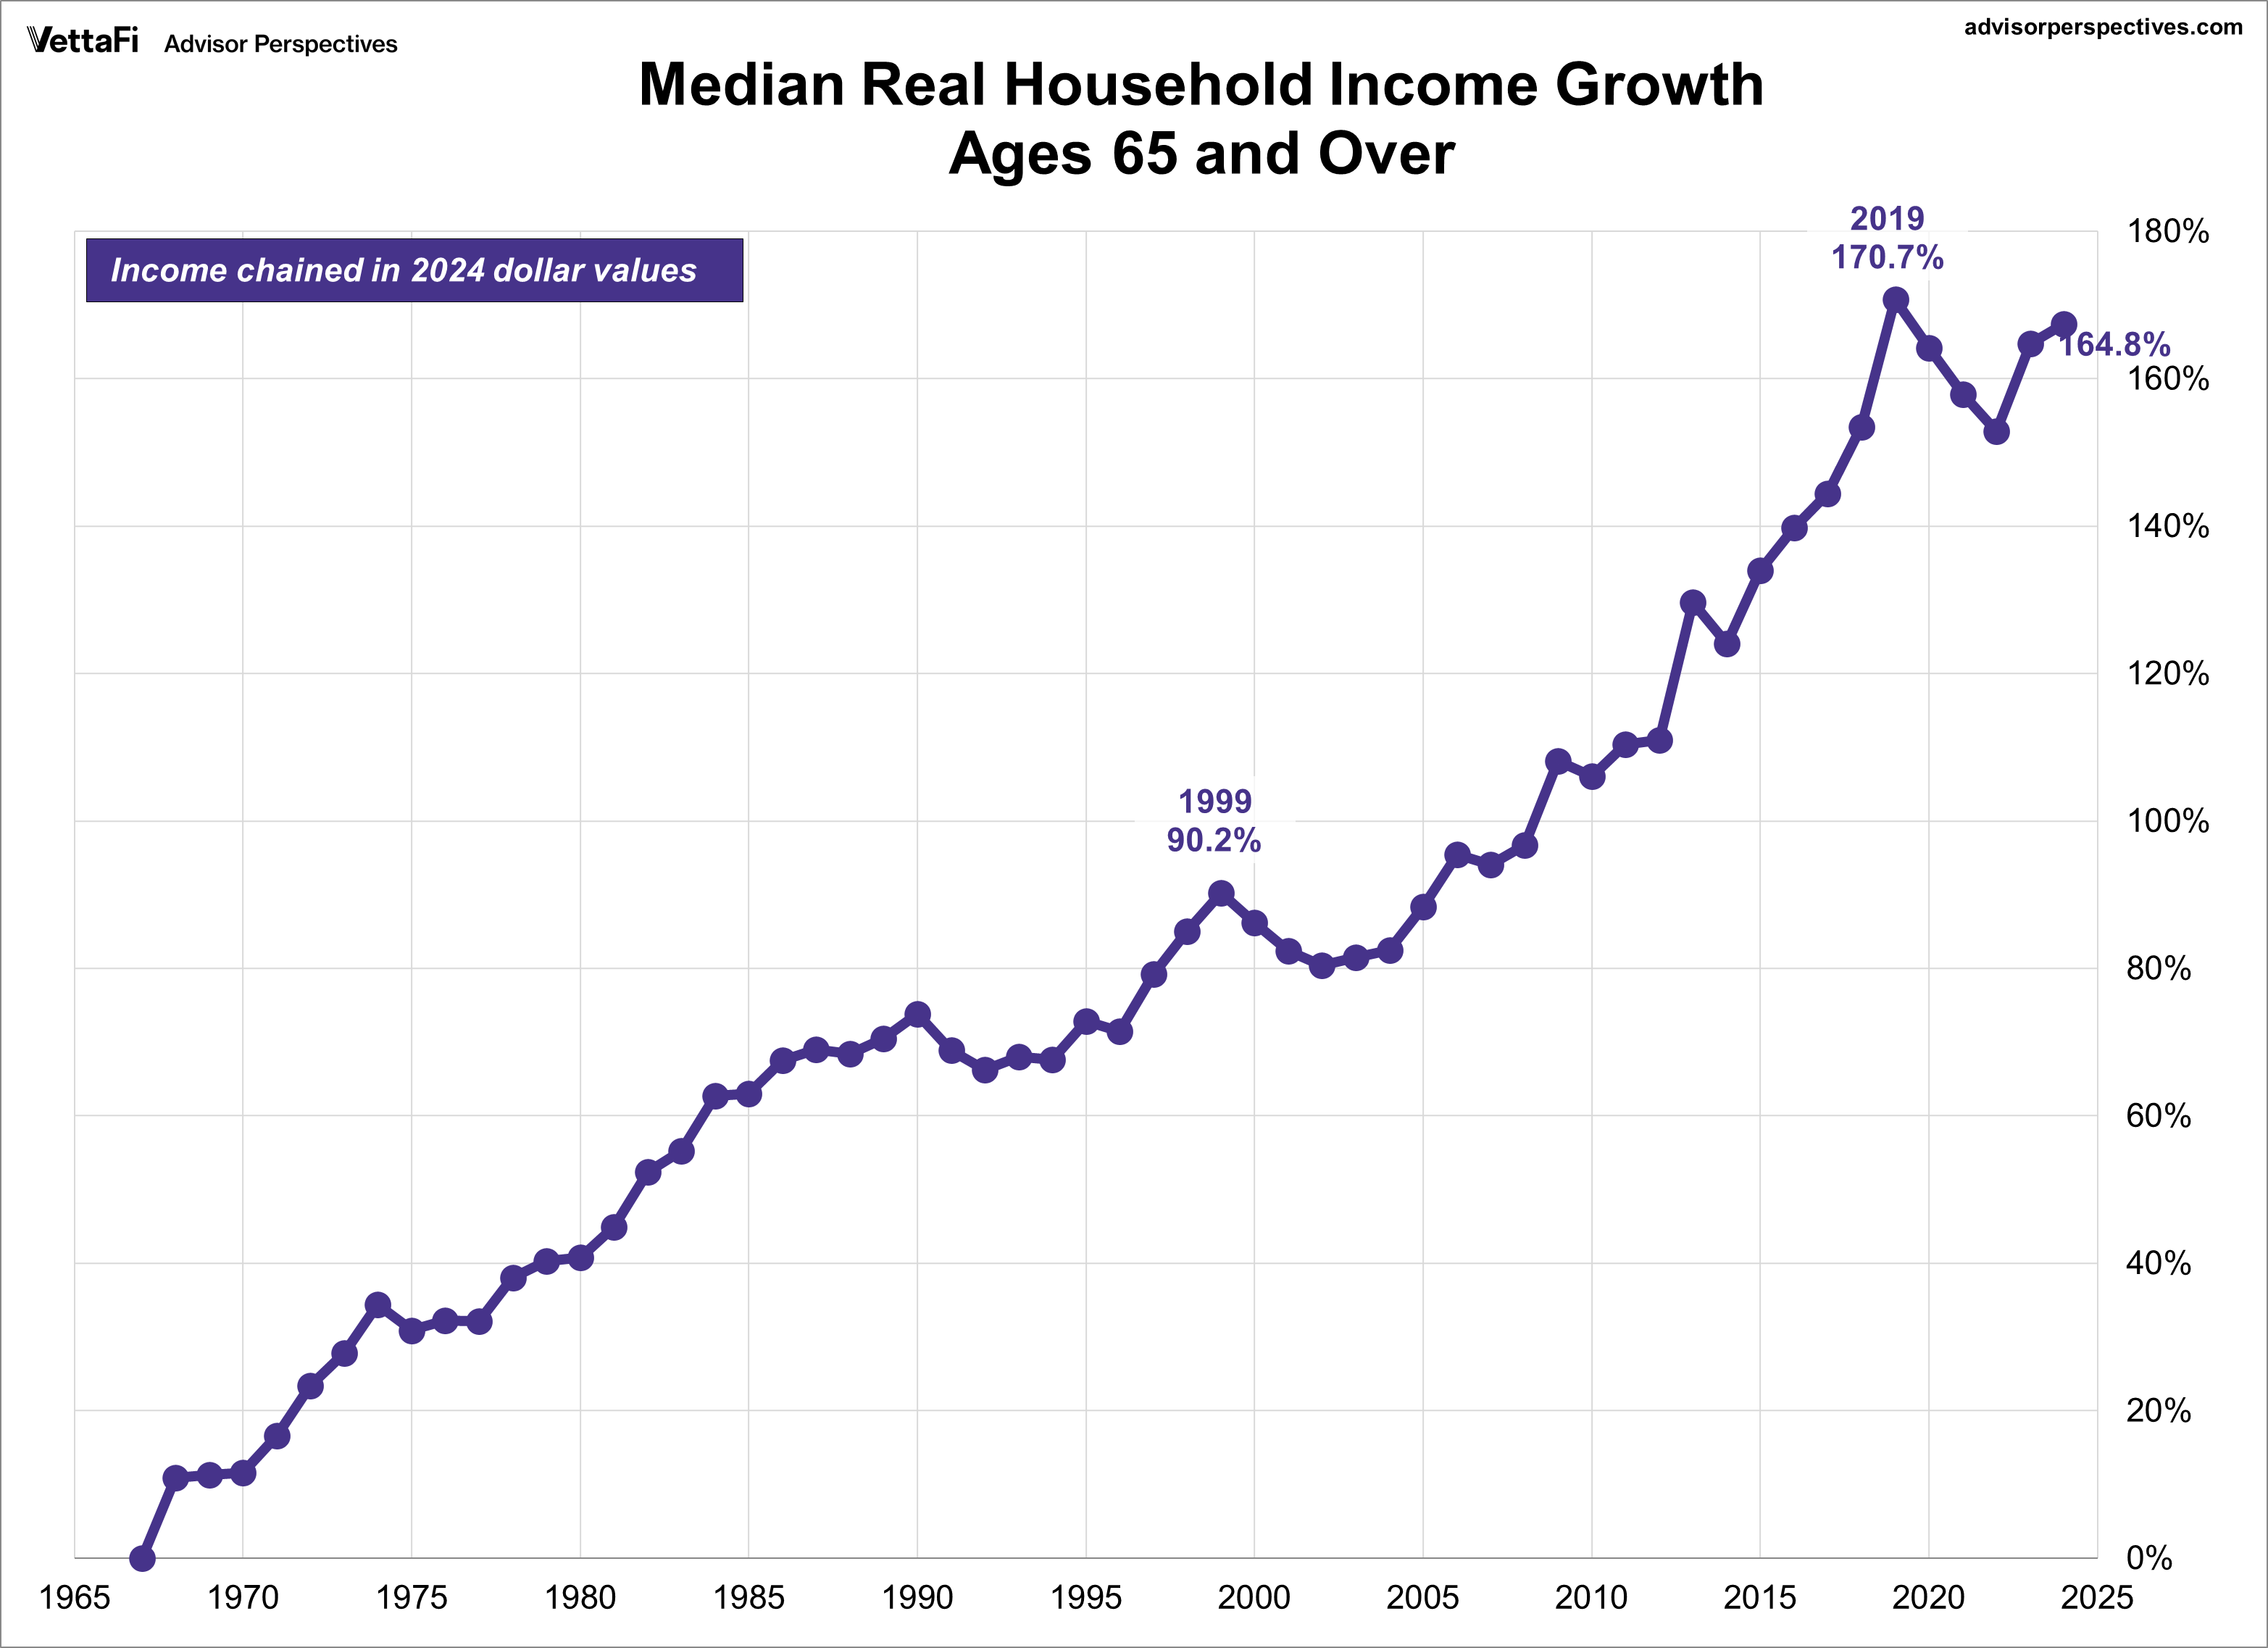
While the 65+ cohort has the smallest median household income in absolute terms, it has experienced the most income growth since 1967. The chart for this group shows an astounding 164.8% real income growth. This dramatic outperformance since the turn of the century can be attributed to several factors.
Social Security is a reliable income source with a cost-of-living adjustment, and private and government pensions have also contributed to the superior growth rate. Additionally, there has been surprising growth in the labor force participation rate of this cohort, as many individuals continue to work past traditional retirement age, a topic we track in our monthly review of long-term trends in the workforce.
Unsurprisingly, the youngest age bracket of 15-24 has one of the lowest median household incomes and the smallest median income growth since 1967. This is understandable, as this group includes teenagers, college students, and individuals just starting their careers in entry-level positions, which tend to offer lower pay.