In a week marked by renewed S&P 500 volatility stemming from reignited tariff talks and the ongoing challenge of a government shutdown that continues to delay crucial government reports, investors and analysts have increasingly turned to secondary economic indicators for a timely view of the U.S. economy. These reports, which have taken on a larger precedence in the absence of official federal data, offer a mixed but informative picture. This article highlights data from a handful of releases, including the NFIB Small Business Survey, regional gauges of manufacturing activity in Philadelphia and New York, the NAHB Housing Market Index, and the Zillow Home Value Index, to assess the state of small business sentiment, industrial health, and the evolving housing sector.
NFIB Small Business Survey
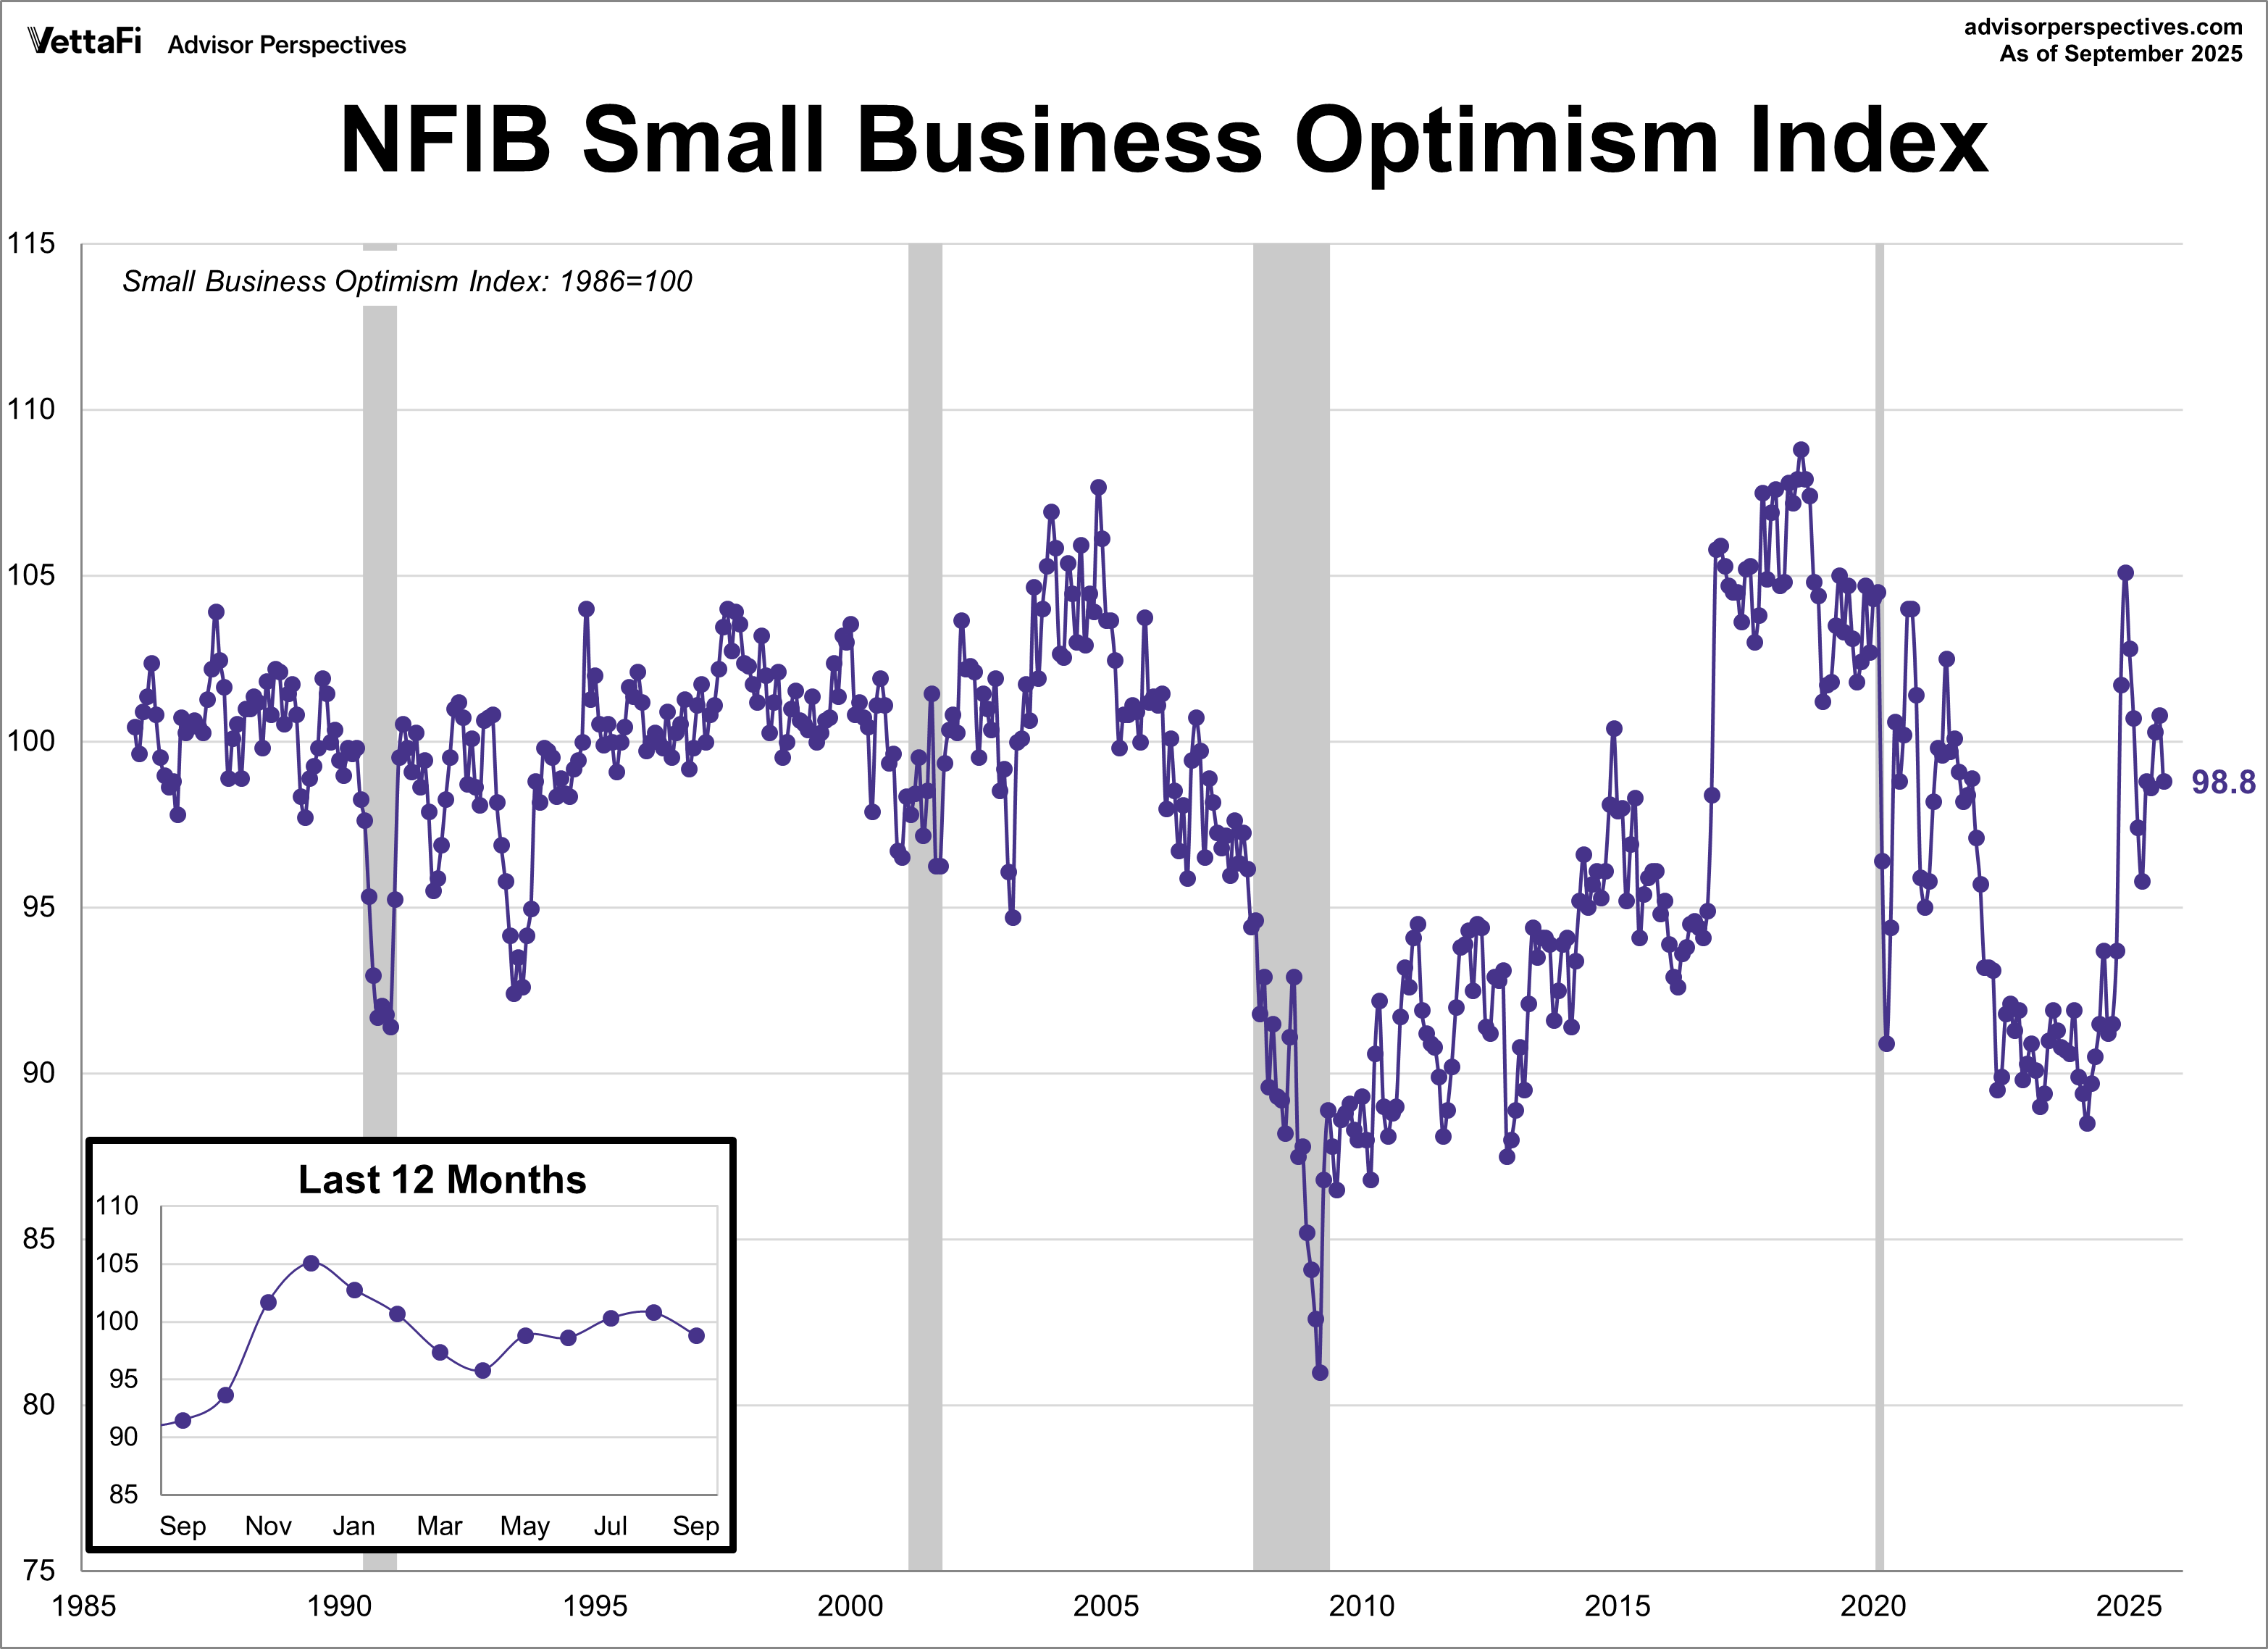
Optimism among small business owners wavered last month while uncertainty grew. The NFIB Small Business Optimism Index declined for the first time in three months, dropping 2.0 points to 98.8 in September. This figure came in lower than the forecast of 100.6. While the index remains above its historical average for a fifth straight month, uncertainty among small business owners has surged, reaching its fourth-highest level in over 51 years.
Small business owners continued to rank labor quality and taxes as their top concerns. Additionally, supply chain disruptions and inflation stood out as significant problems. Most notably, the number of owners who view current inventory levels as “too low” experienced its largest monthly decline in history. A bright spot from the survey, however, revealed that the net percent of owners reporting higher versus lower profits increased to its highest level in nearly four years. The survey results highlight the significant impact of the small business sector, which employs roughly 50% of the U.S. workforce and thus heavily influences the overall economy.
Regional Manufacturing: Philadelphia and New York
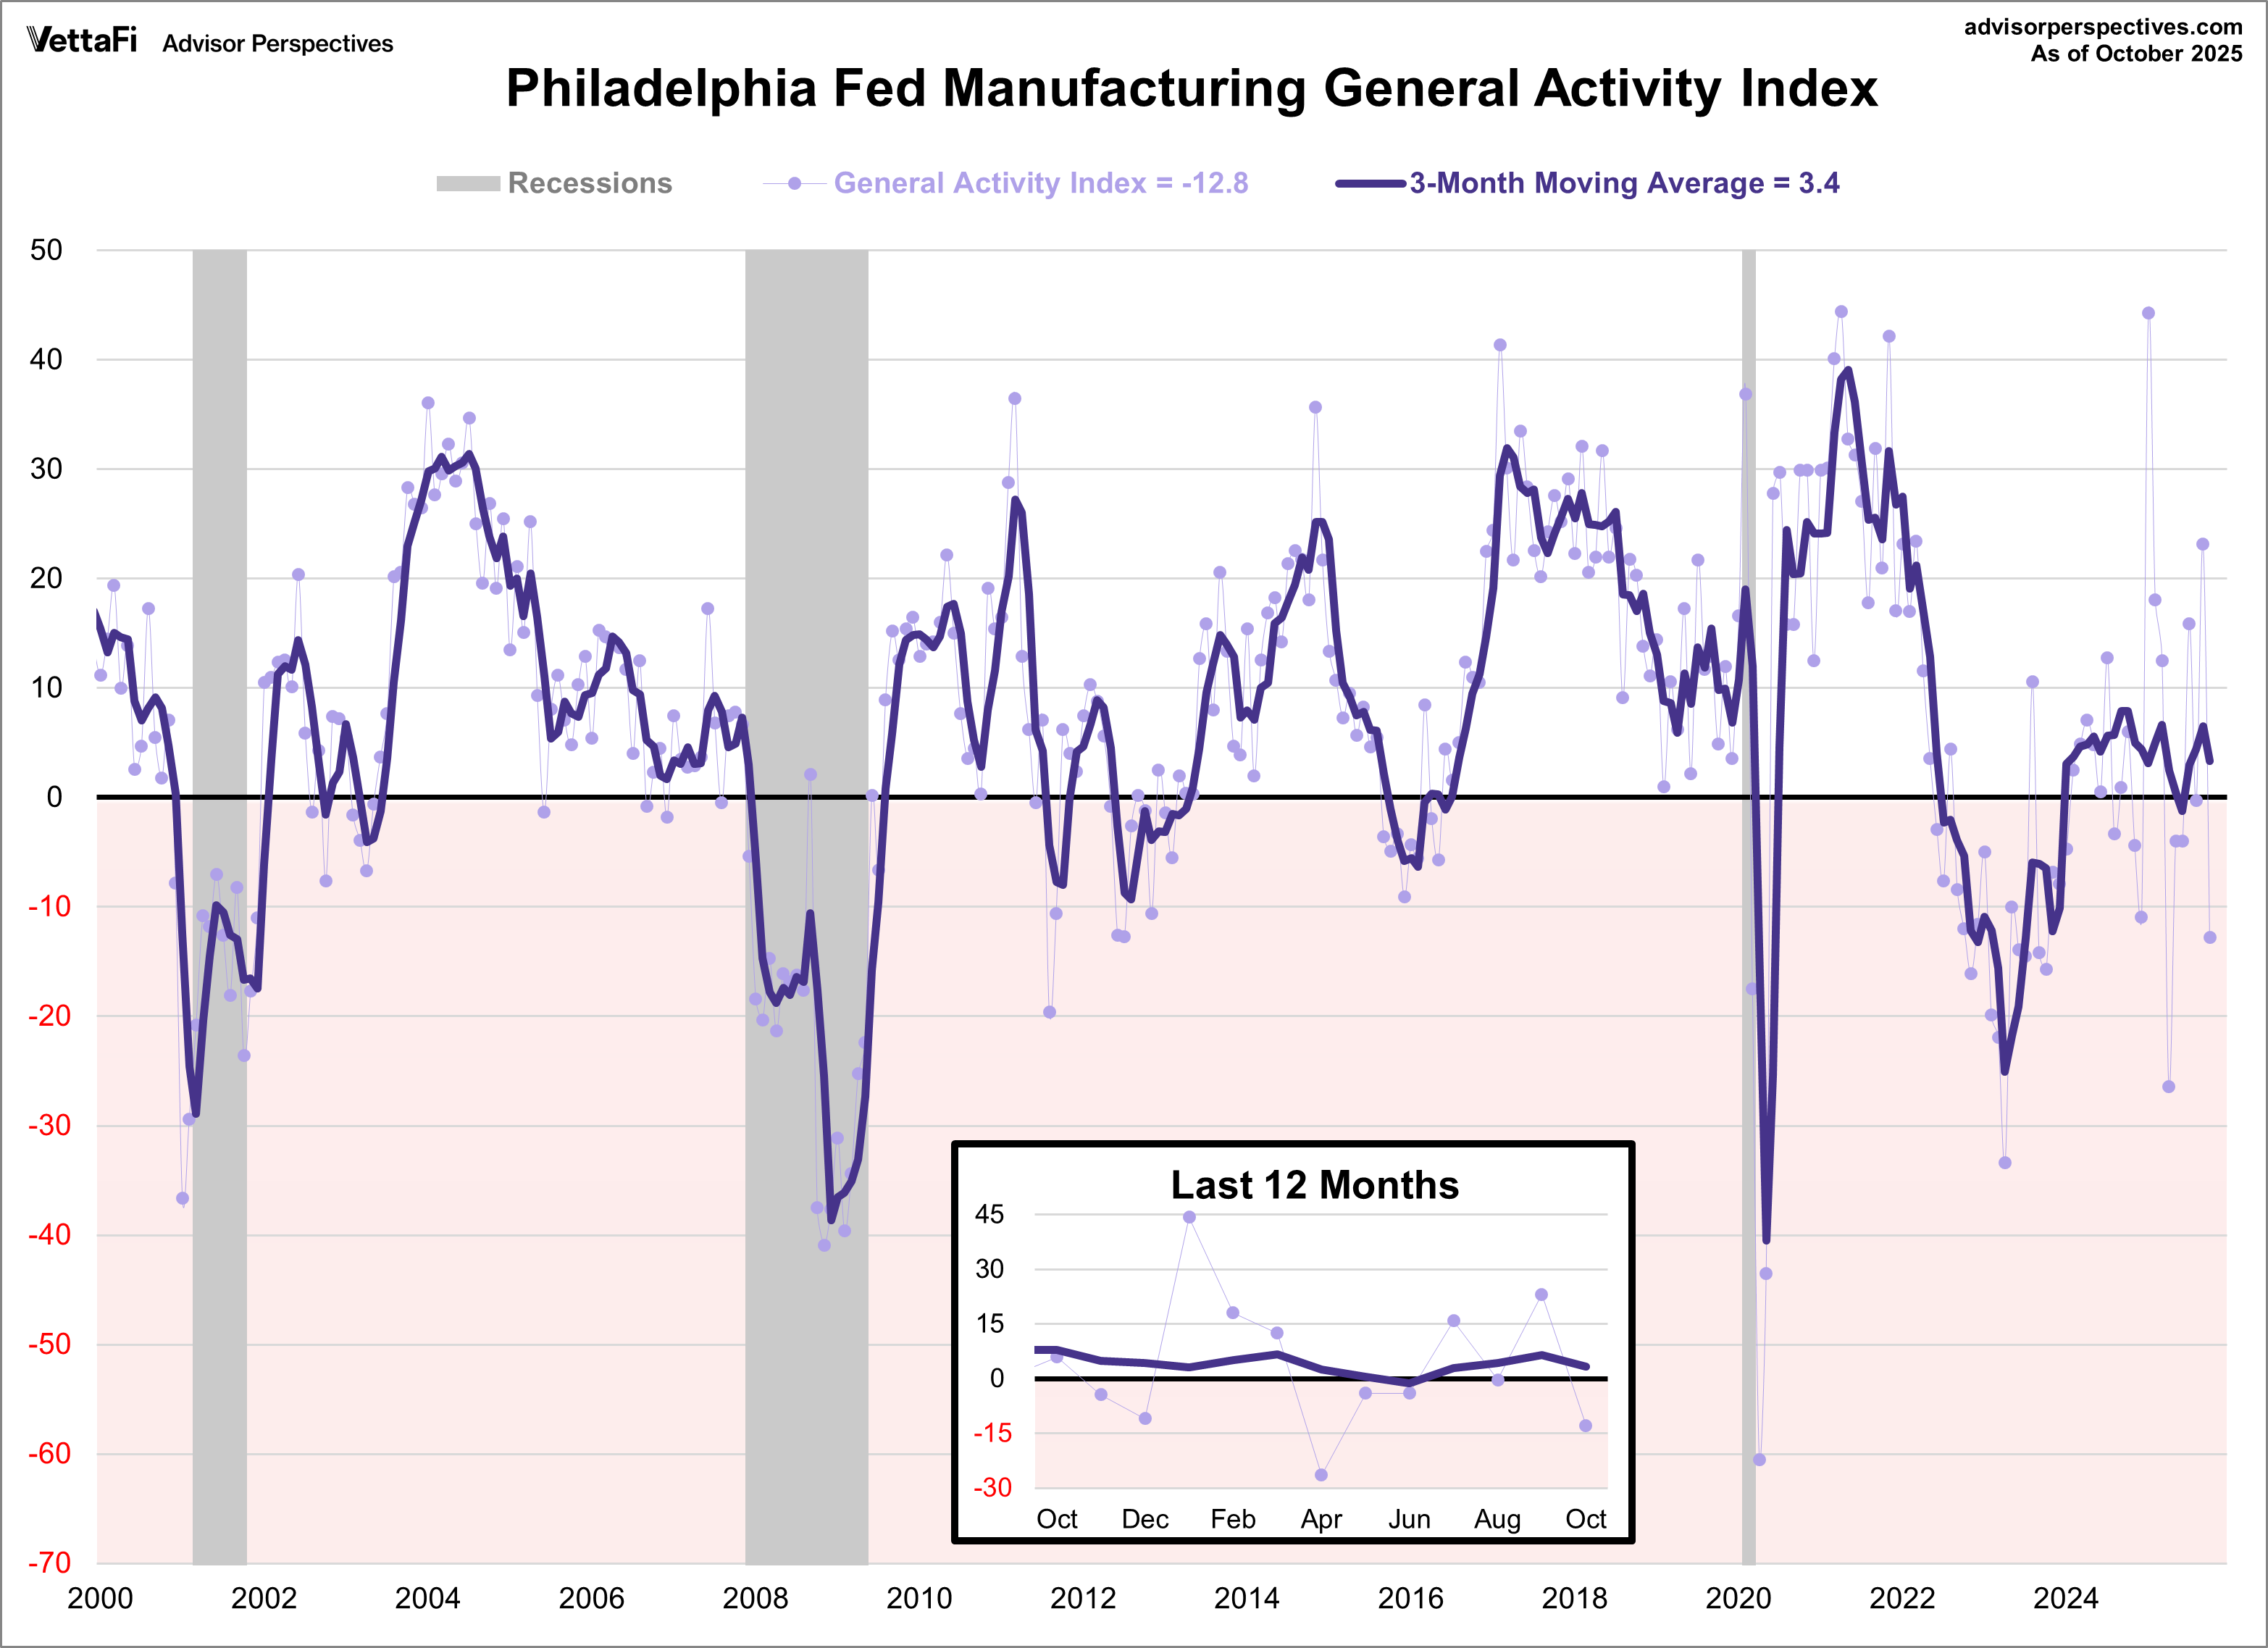
Manufacturing activity across the mid-Atlantic presented a mixed picture, though both regions showed intensifying price pressure and stronger future optimism. The Philadelphia Fed Manufacturing Index fell significantly, dropping 36 points to -12.8. This was the lowest level since April and was lower than the forecast of 8.6, signaling a sharp slowdown in regional activity. In contrast, the Empire State Manufacturing Survey for New York increased modestly, rebounding 19.4 points to 10.7. This was well above the forecast of -1.8. Despite the contradictory headline figures, both surveys reported that prices paid and received indexes remained elevated and moved higher, confirming persistent inflationary pressures across the sector. Additionally, firms in both regions expressed greater confidence in the next six months, with both future indexes reaching their highest level in several months.
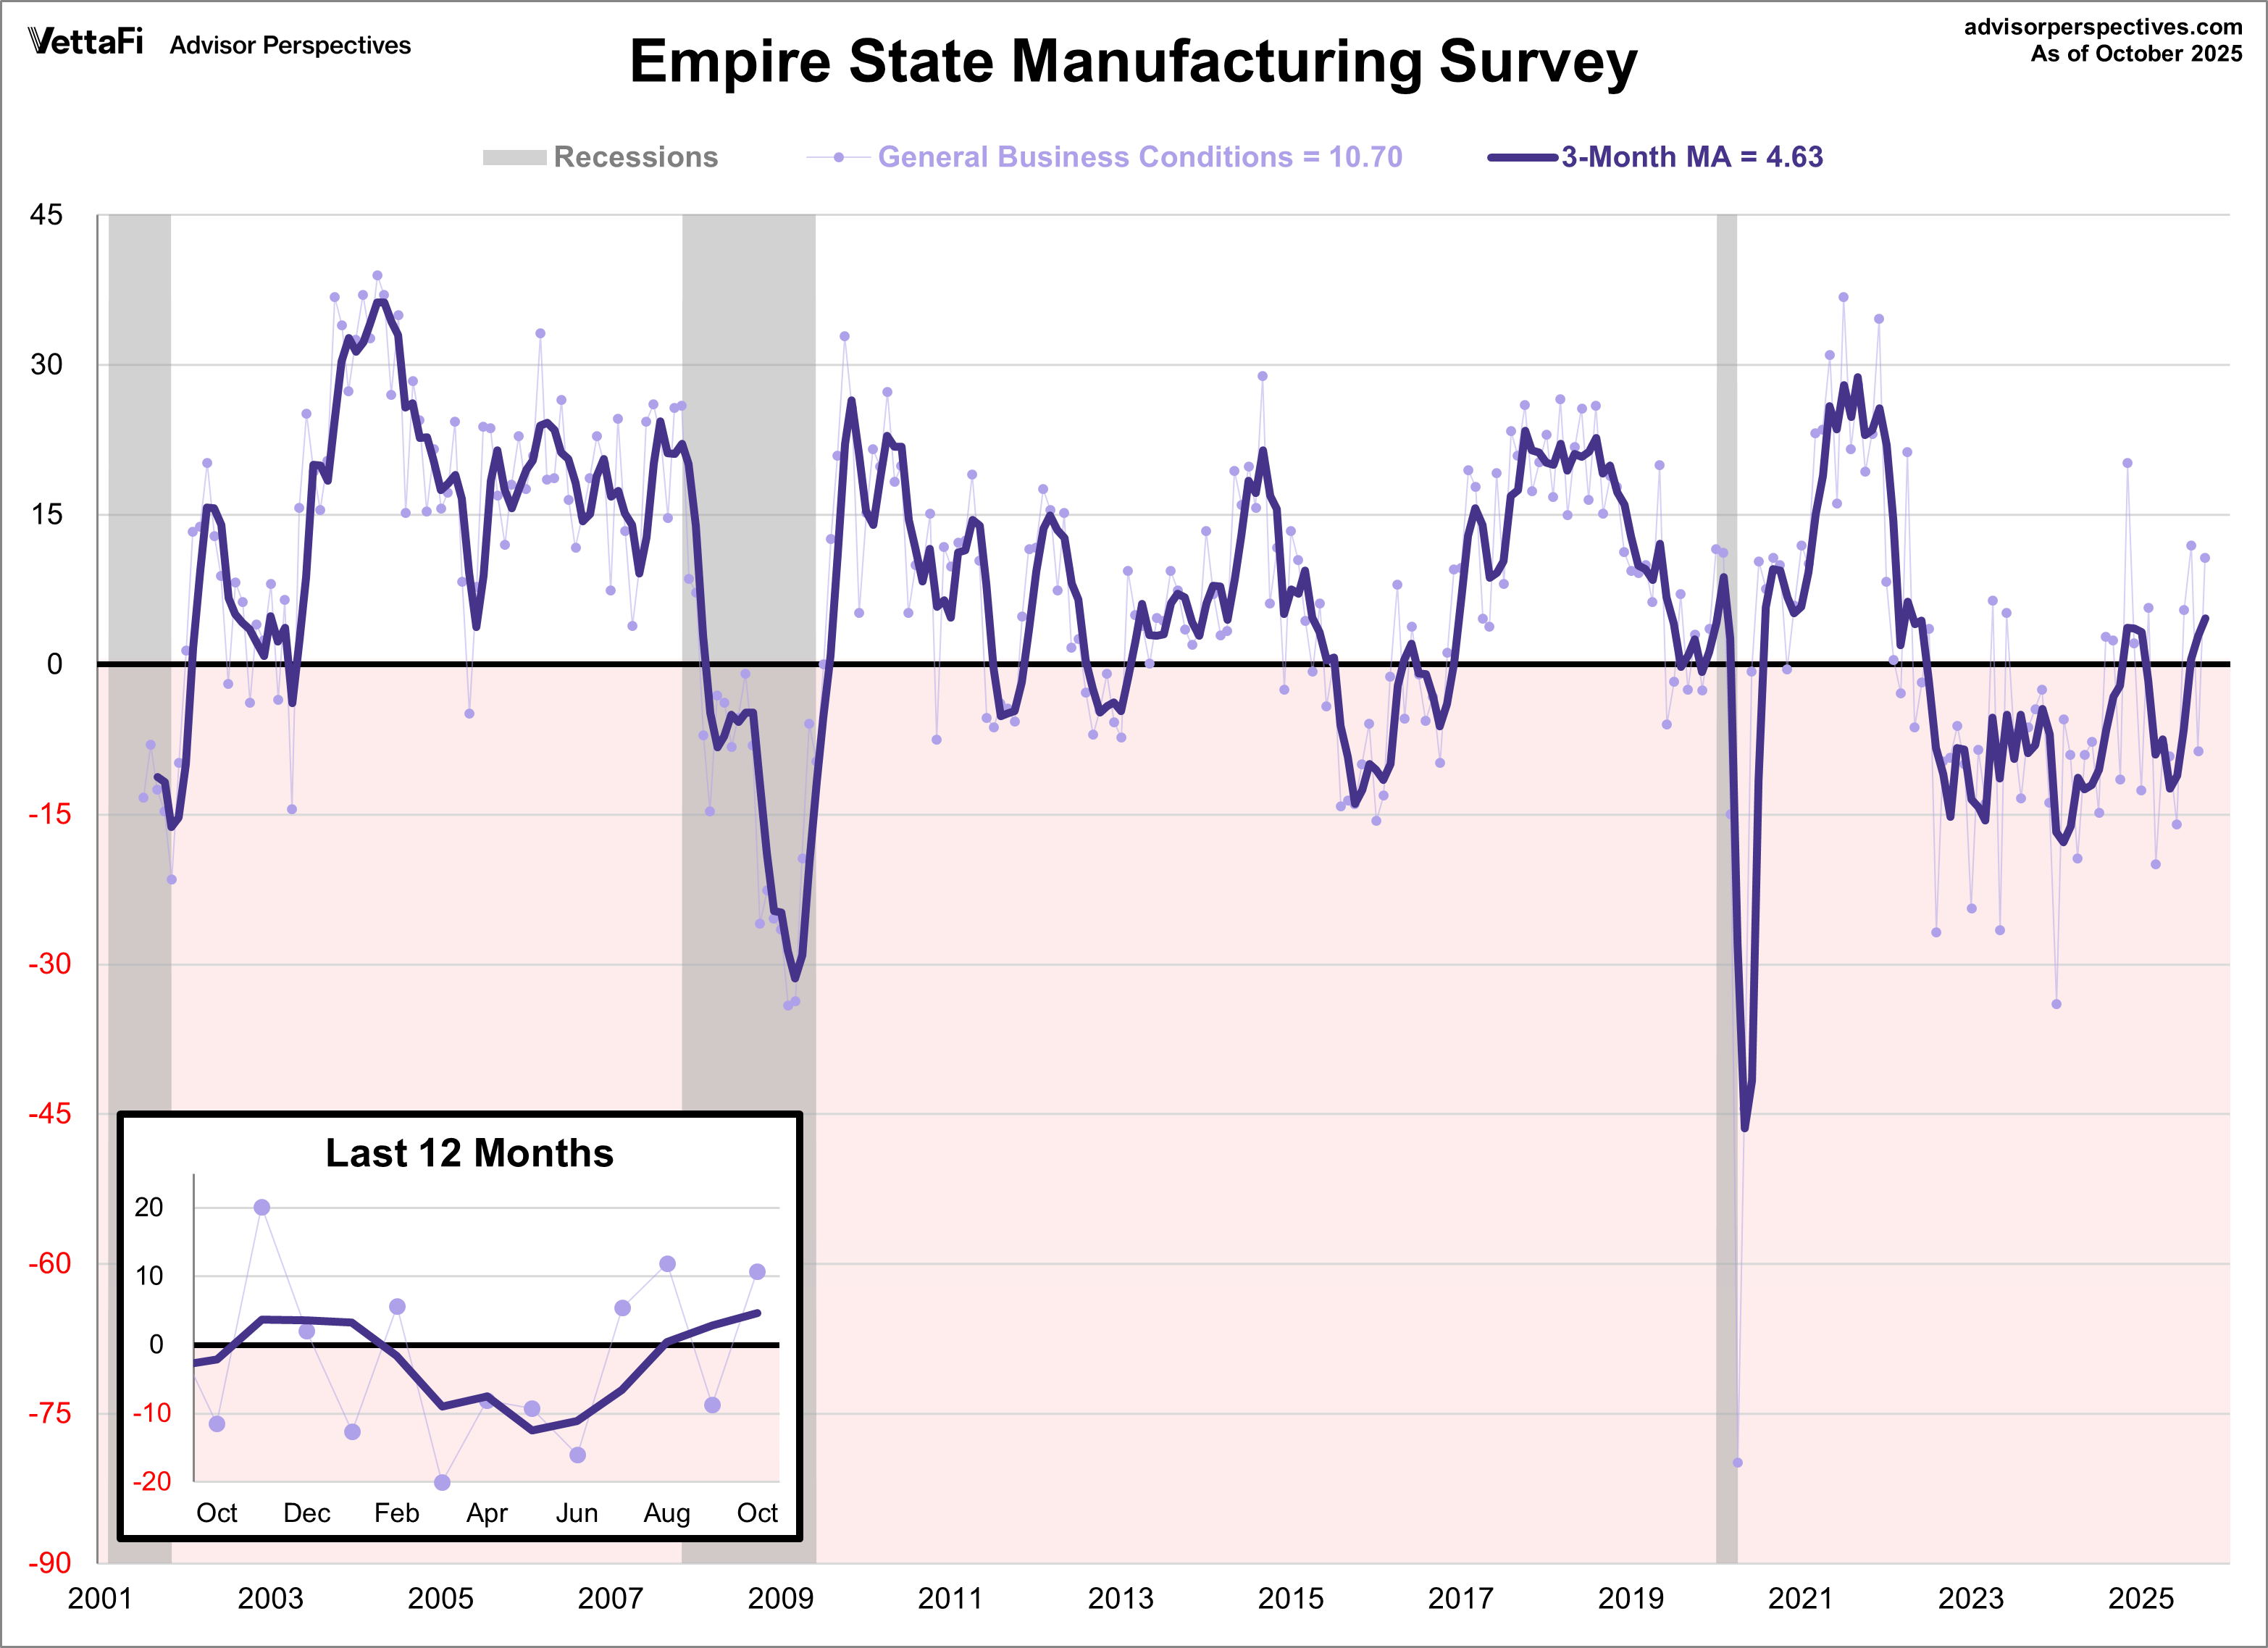
A detailed look at the components of each index revealed a split in regional activity. The Philadelphia report showed declines in shipments, though it remained positive, and an increase in new orders. Meanwhile, the Empire State report showed increases in shipments and new orders, although this was accompanied by longer delivery times and worsening supply availability. On the labor front, both indexes reported similar trends: the employment indexes expanded in both regions but this growth was tempered by a decline in the average workweek or hours worked.
NAHB Housing Market Index
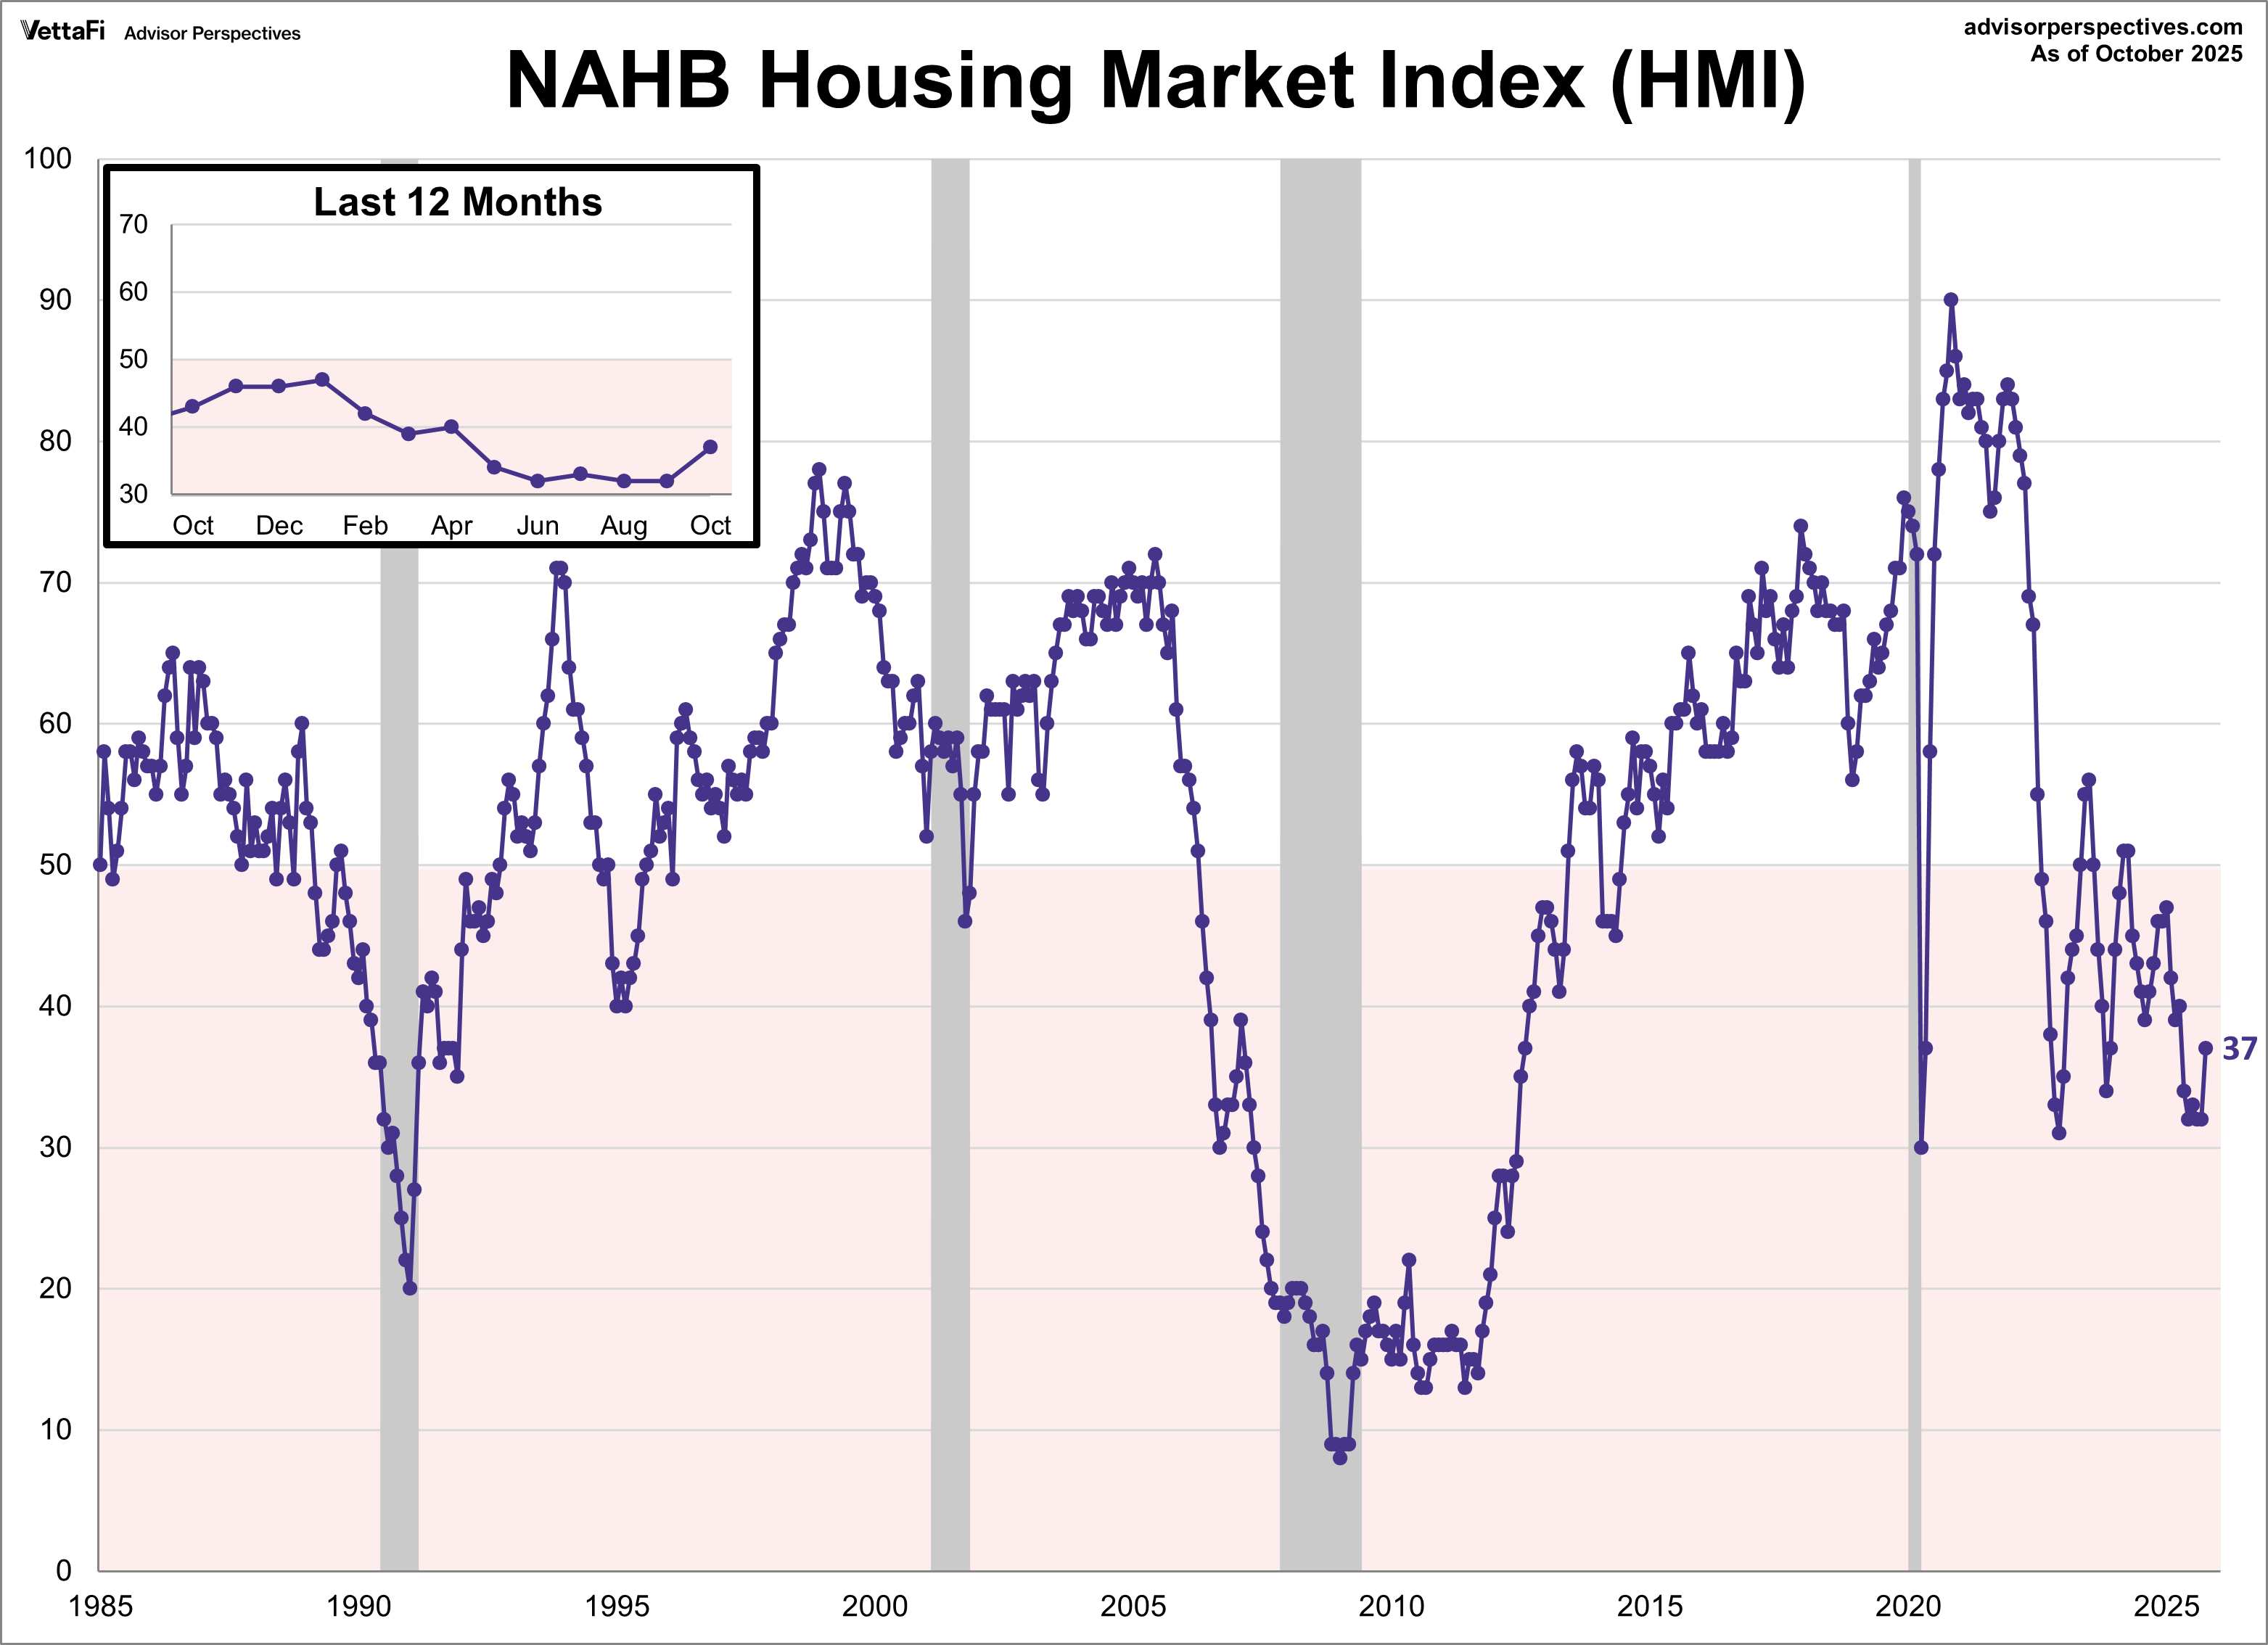
Builder confidence improved notably this month, though overall sentiment remains low. Reduced mortgage rates and the anticipated easing by the Fed boosted future sales expectations, ultimately improving builder sentiment. The NAHB Housing Market Index, which measures builder opinion on current and future home sales, jumped five points to 37. This reading was the highest since April and exceeded the expected reading of 33, marking the largest monthly increase since January of last year.
The index is calculated based on three components: current sales, expected sales over the next six months, and prospective buyer traffic. All three improved in October, with each component experiencing its largest monthly increase since early 2024. Current sales rose to their highest level since April, while both future sales expectations and buyer traffic reached their highest levels since January.
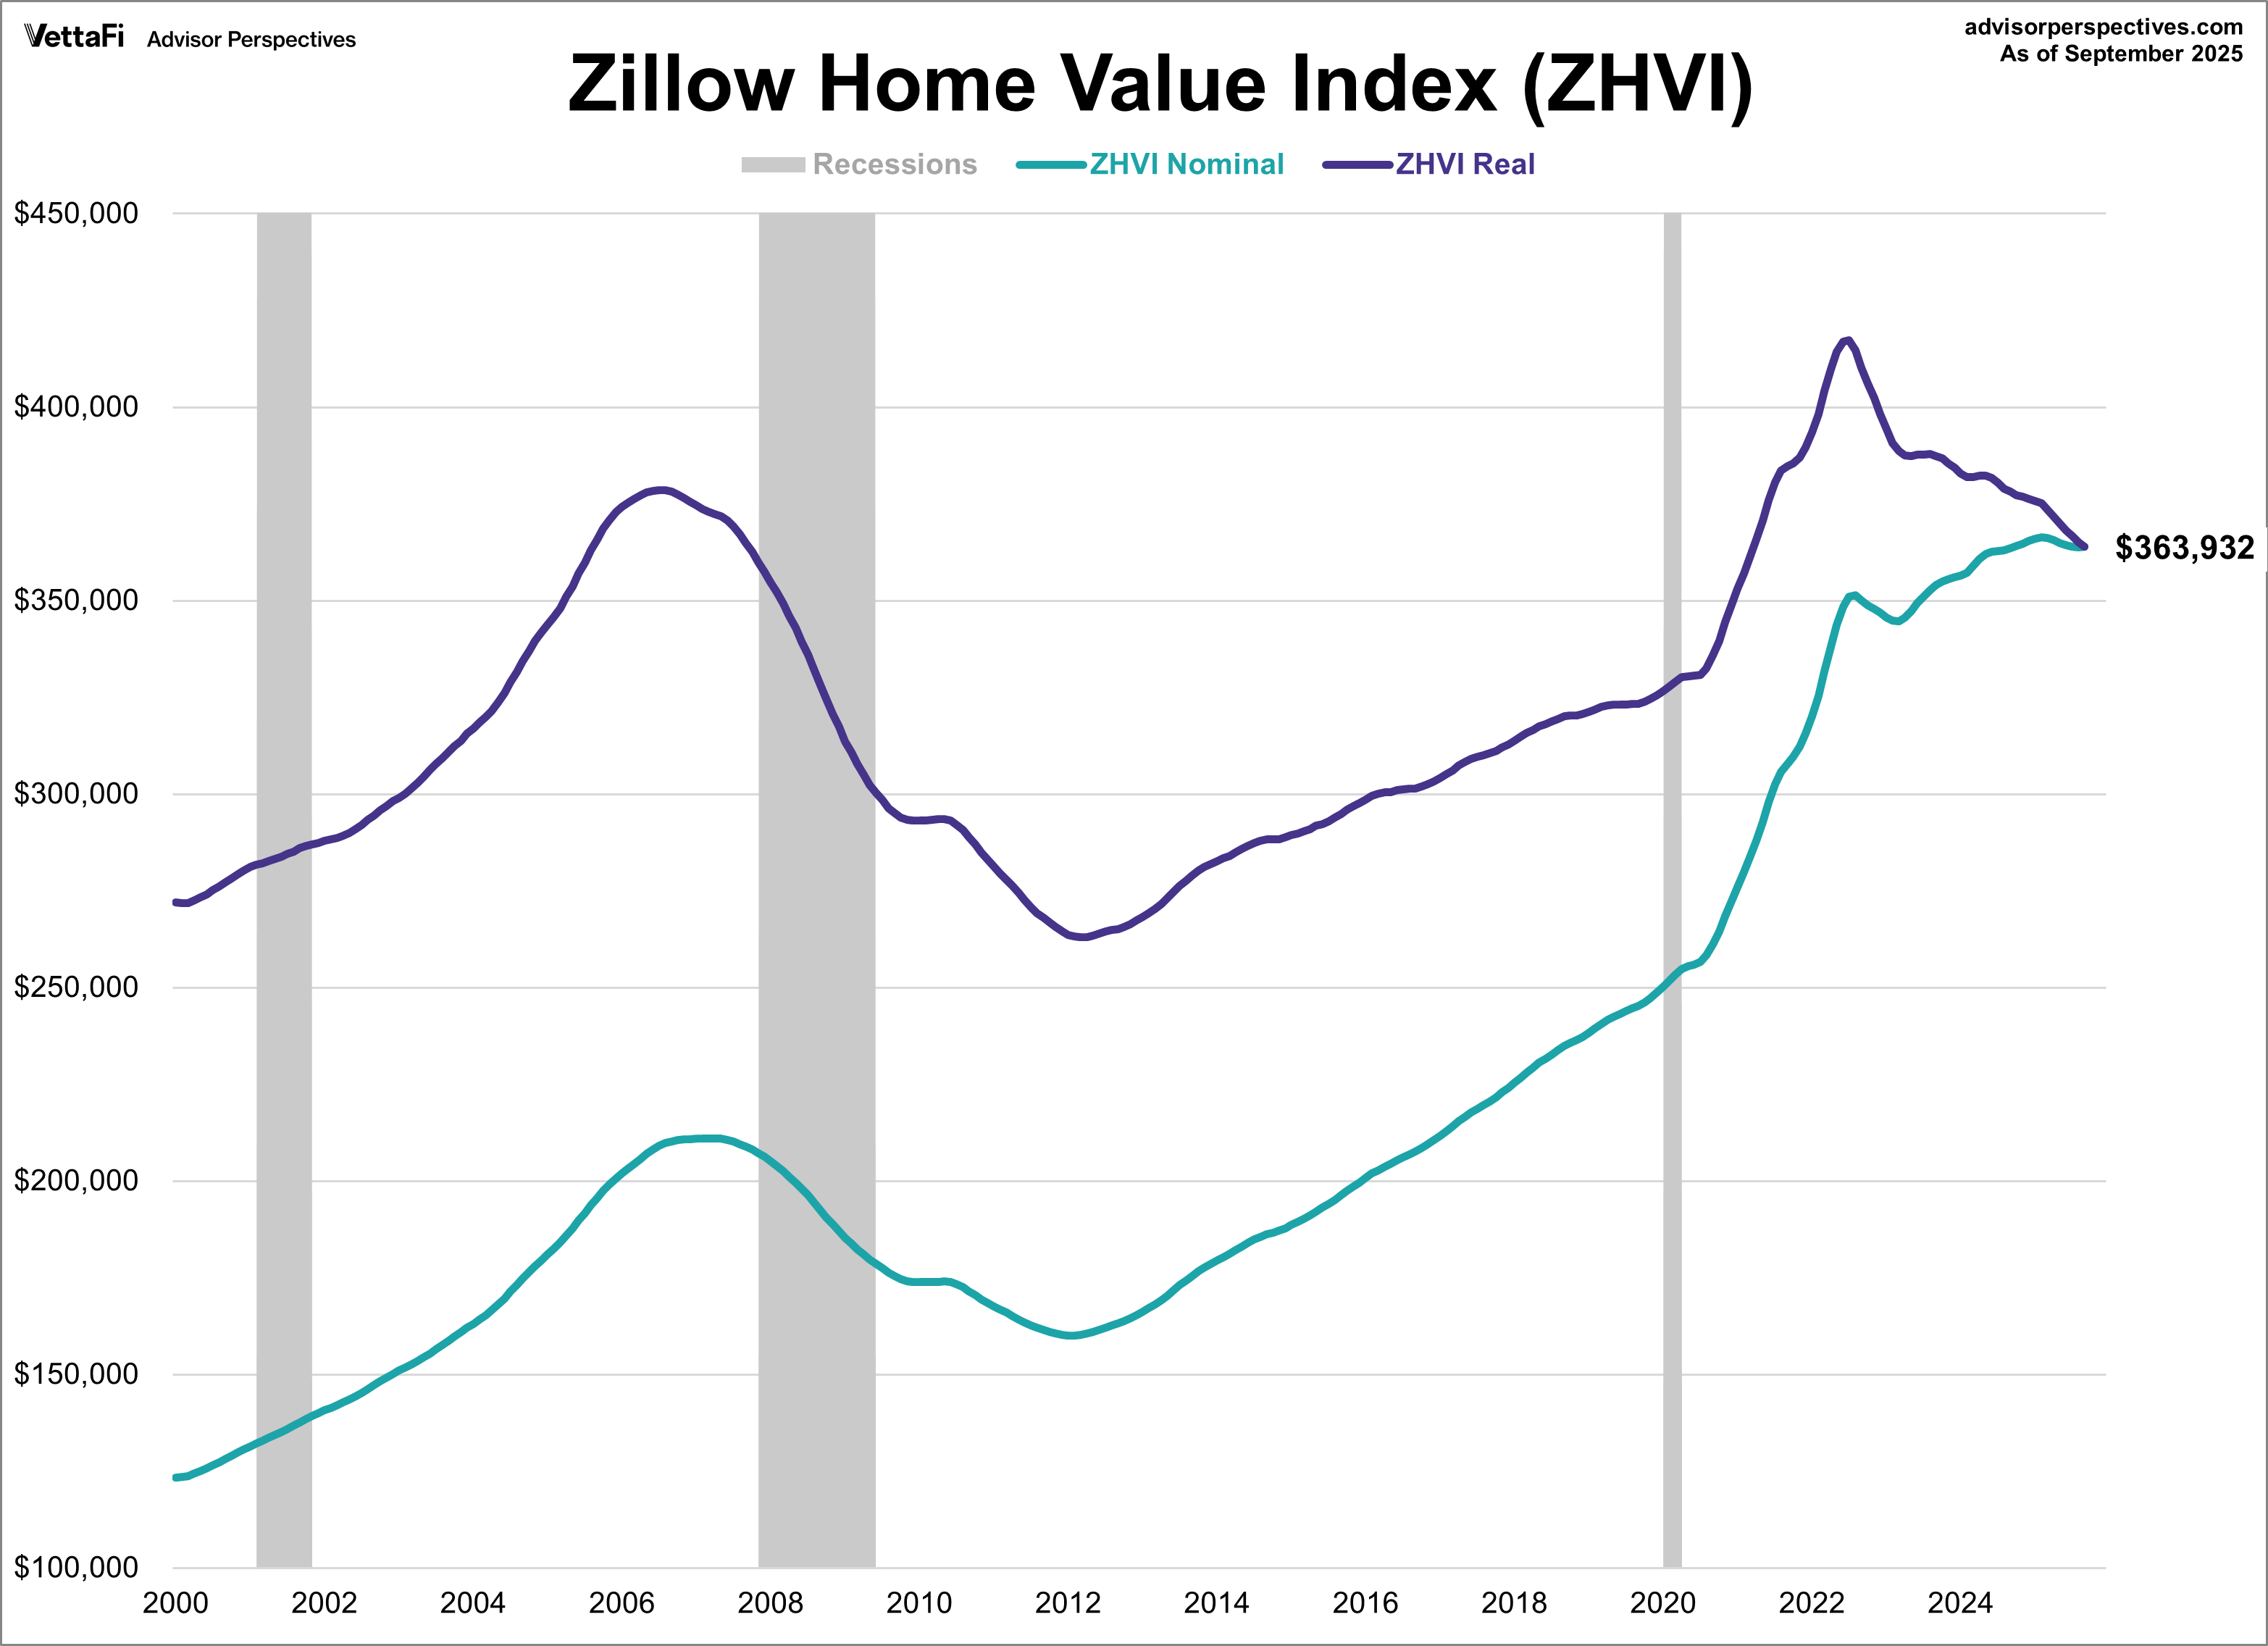
Zillow Home Value Index
U.S. home values increased for the first time in seven months in September, according to the Zillow Home Value Index (ZHVI). The index, which tracks the typical U.S. home value, rose to $363,932 last month. This figure represents a nominal increase of 0.1% from August and a slight increase of 0.1% from one year ago.
However, the picture changes dramatically when adjusting for inflation using the latest Consumer Price Index. "Real" (inflation-adjusted) home values fell for a seventeenth straight month, remaining at their lowest level since March 2021. The inflation-adjusted index declined 0.3% from August and is down 3.8% from one year ago. While the ZHVI is a lesser-known measure, it is designed to be a timely, comprehensive, and transparent alternative to other home value metrics.
Market Reactions
The S&P 500 started last week strong, posting its largest daily gain in over four months on Monday. The index then see-sawed through the rest of the week, ultimately finishing up 1.7% from the previous week. As a result, the SPDR S&P 500 ETF Trust (SPY) rose 1.7% last week. Meanwhile, the S&P Equal Weight Index was up 1.6% from the previous week and the Invesco S&P 500® Equal Weight ETF (RSP) rose 1.6%.
The 10-year note crossed below 4.00% for the first time in over a year this week while the 2-year note hit its lowest level since September 2022. The yield on the 10-year note finished last week at 4.02% while the 2-year note ended at 3.46%.
The CME FedWatch Tool currently shows a 99% likelihood that the Fed will cut rates by 25 basis points at their next meeting. Markets are also pricing in another 25 basis point cut at the December meeting and three additional cuts in 2026.
Economic Data in the Week Ahead
Due to the ongoing government shutdown, the economic calendar remains sparse. As official government data releases are delayed, the reports we do receive take on added importance. This week, we’ll get a further look at the U.S. housing market with the latest Existing Home Sales figures and a continued look at regional manufacturing activity with the release of the Kansas City Fed Manufacturing Index. Additionally, the Chicago Fed National Activity Index will give a broader view of the economy by aggregating data across various sectors to determine if economic growth is tracking above or below its long-term trend. Finally, the release of the Michigan Consumer Sentiment report will be particularly important, as it offers timely feedback on how consumers are currently feeling about the economy.


