The economic mover and shaker this week is Friday's employment report from the Bureau of Labor Statistics. This monthly report contains a wealth of data for economists, the most publicized being the month-over-month change in Total Nonfarm Employment. However, each month a few days before we receive the highly anticipated jobs report, ADP releases their data on new nonfarm private jobs.
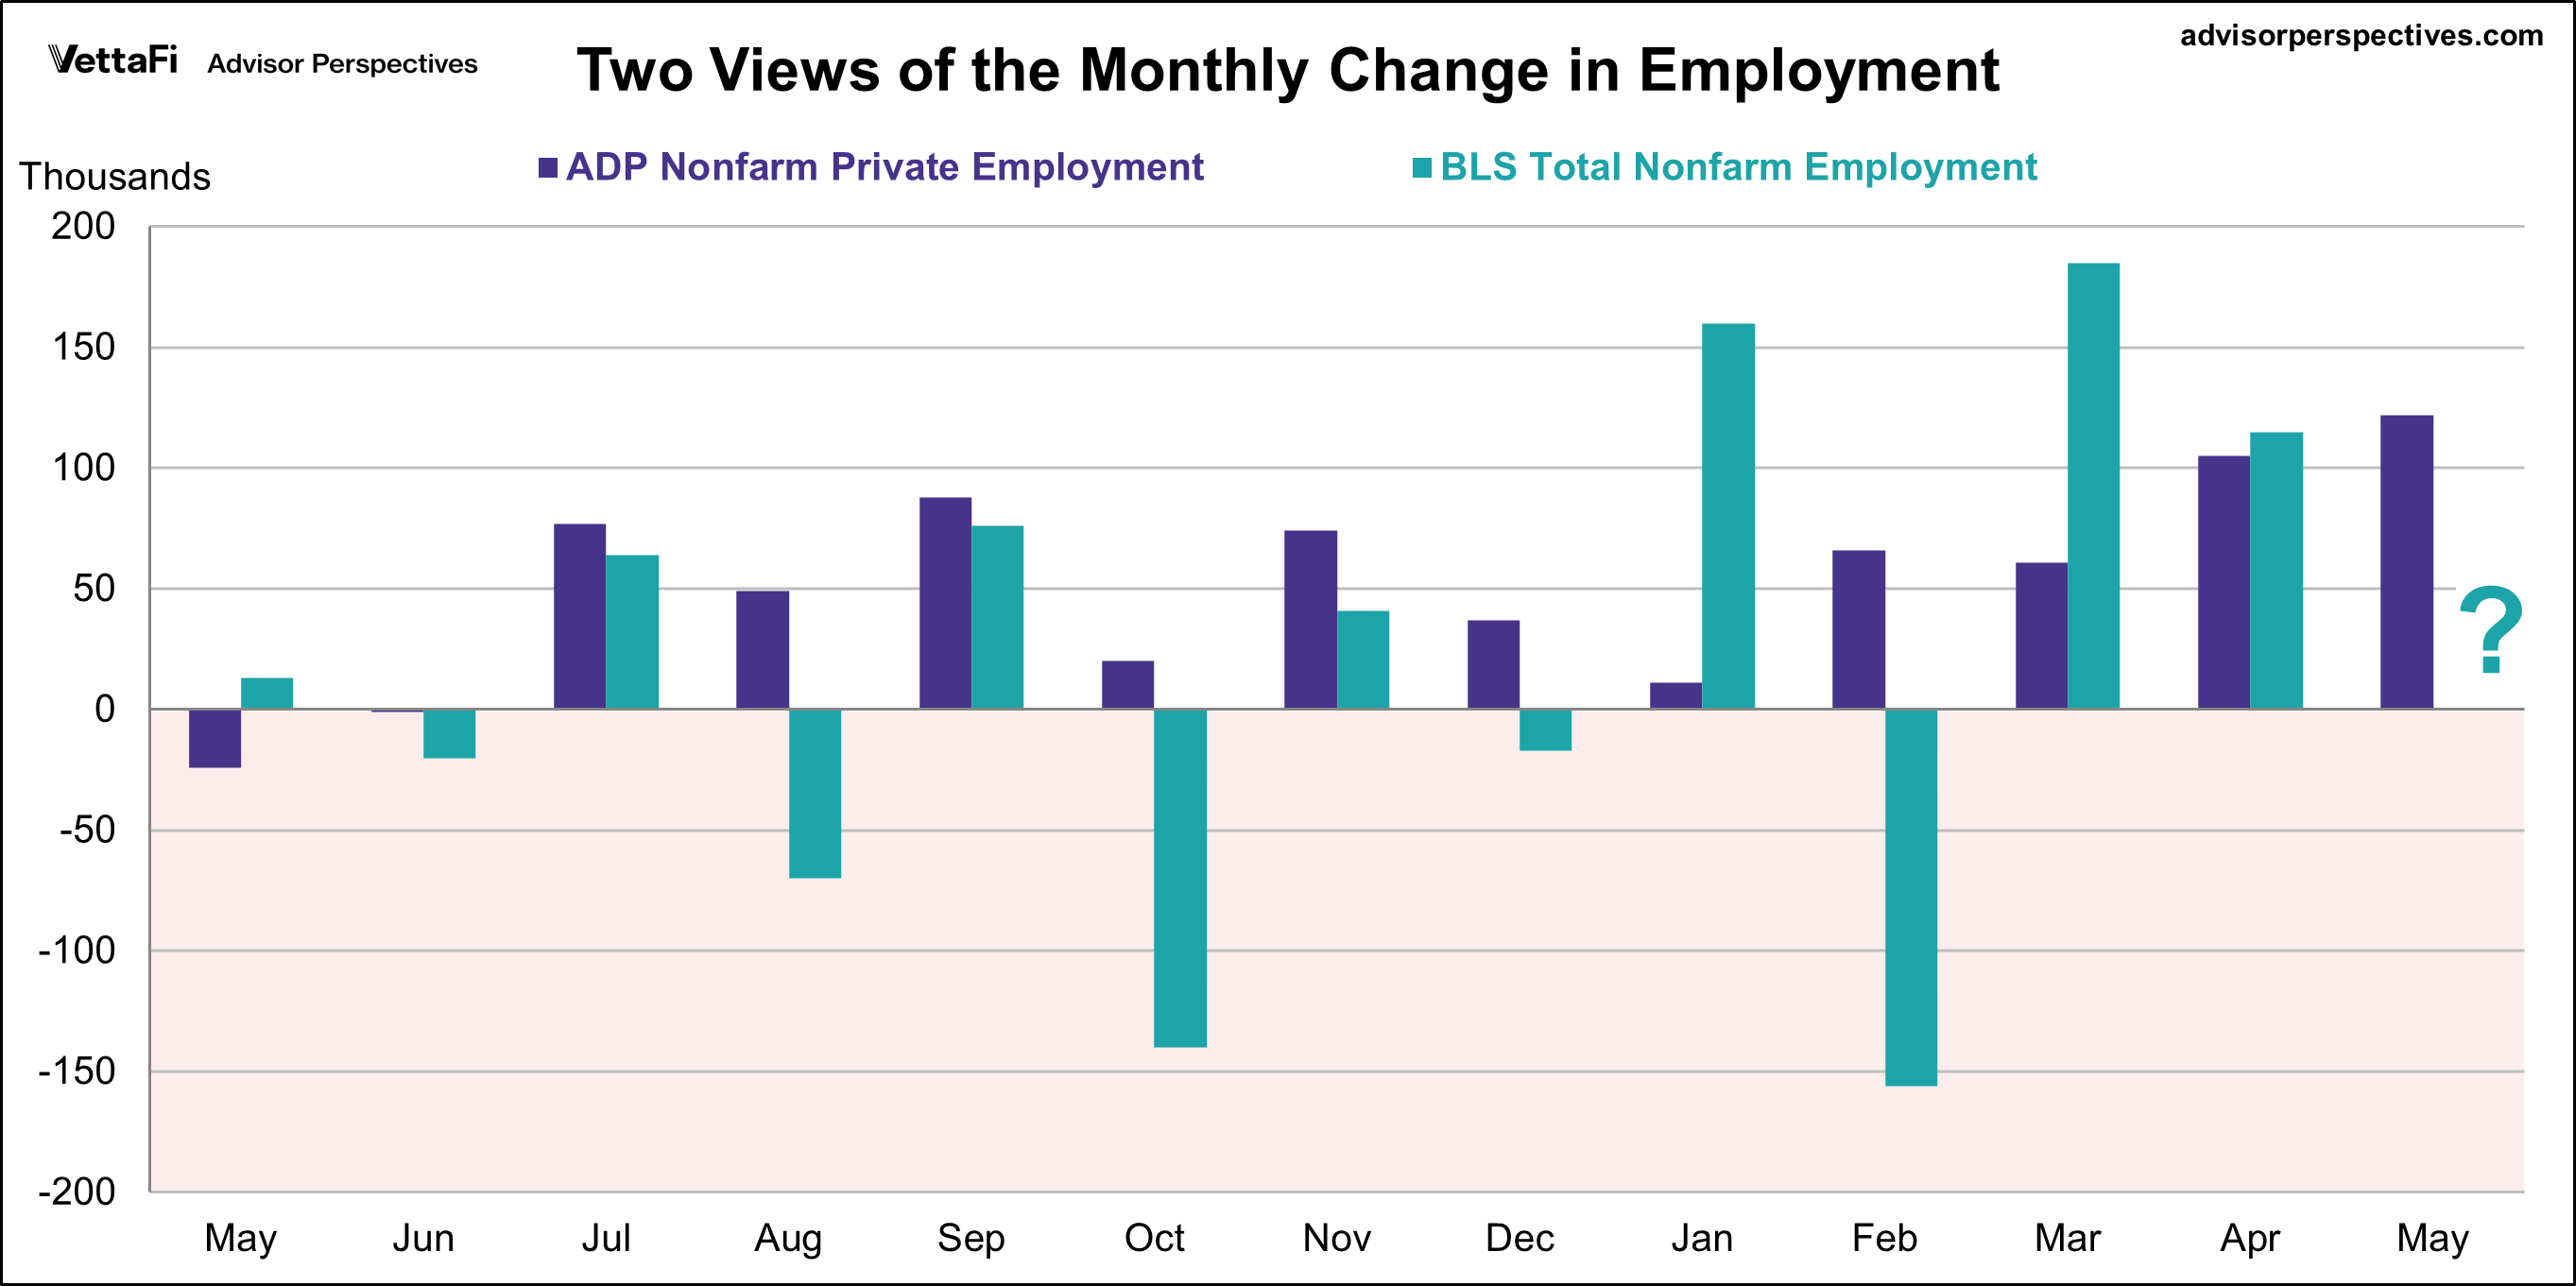
The ADP employment report revealed that 122,000 nonfarm private jobs were added in May, the largest monthly growth since January 2025. The latest figure was just above the projected 118,000 addition.
Here is a visualization of the two series over the past twelve months. There is no correlation between the ADP and BLS employment report.

Here is an excerpt from today's ADP report press release:
"Hiring was more broad-based in May than we've seen in the last few years. The labor market continues to show sustained momentum going into the summer hiring season."
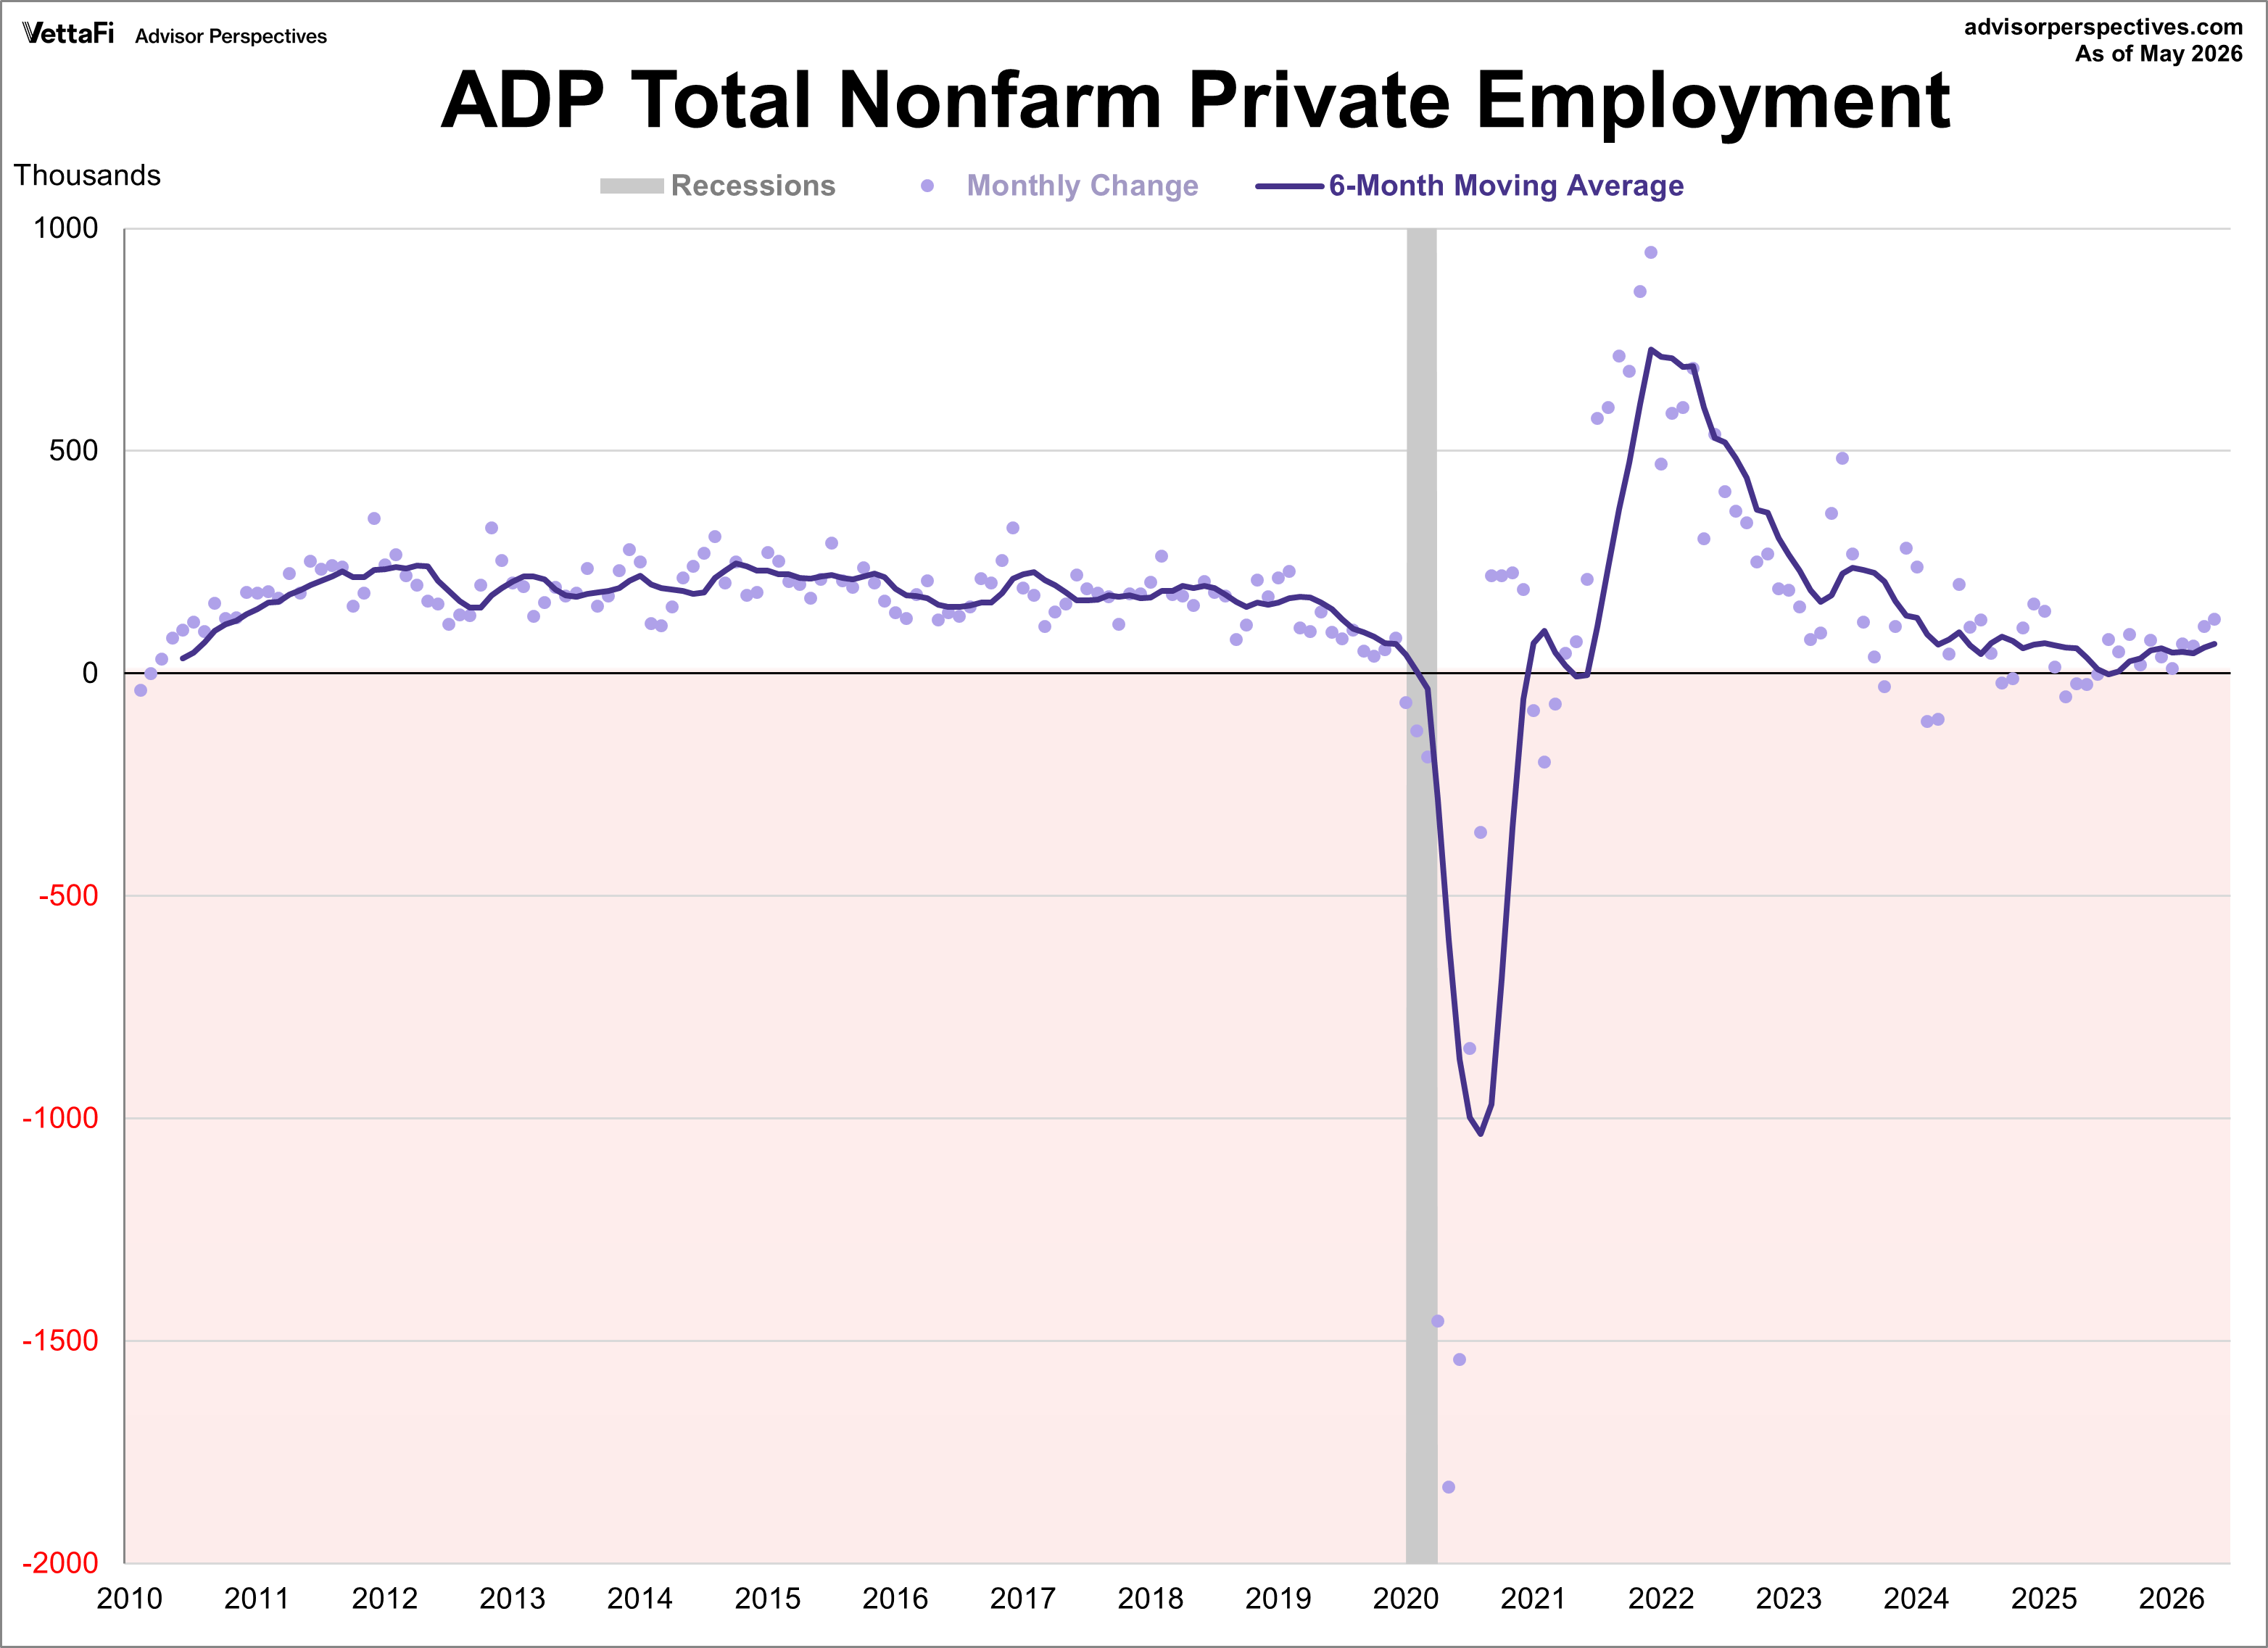
Here is a snapshot of the monthly change in the ADP headline number since the company's earliest published data with the new methodology in 2010. This is quite a volatile series, so we've plotted the monthly data points as dots along with a six-month moving average, which gives us a clearer sense of the trend. The six-month moving average currently sits at 67,000, the highest level since early 2025.
As we see in the chart above, the trend peaked in September 2015 and then went negative for the first time in late 2019, just before the NBER declared a recession start. The COVID-19 pandemic has brought employment numbers down to levels we have never seen this century. The trend reached a new high in 2021 at 728,000 but has dropped below pre-pandemic levels over the last few years.
ADP Employment: Industry
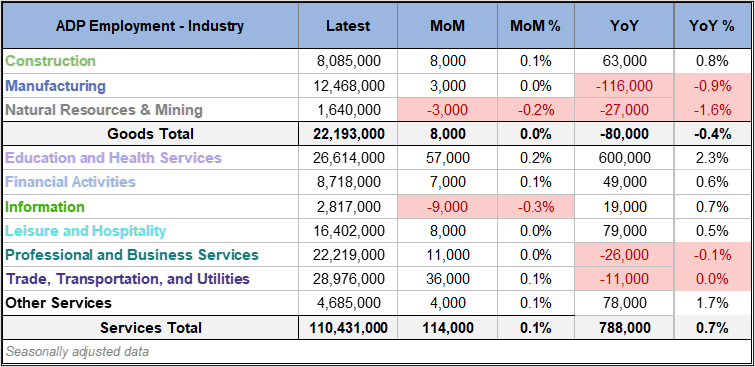
The ADP report divides Total Nonfarm Private Employment into two categories: Goods-Producing and Service-Providing. Given that the US is primarily a services economy, it's no surprise that Services employment has historically driven job growth. This reliance also explains why the sector was hit hardest when the pandemic brought many service-producing jobs to a halt.
In May, goods-producing jobs rose by 8,000 while service-providing jobs increased by 114,000. The sector with the largest growth last month was Education and Health Services with a gain of 57,000 while the biggest loser last month was Information with a loss of 9,000 jobs.
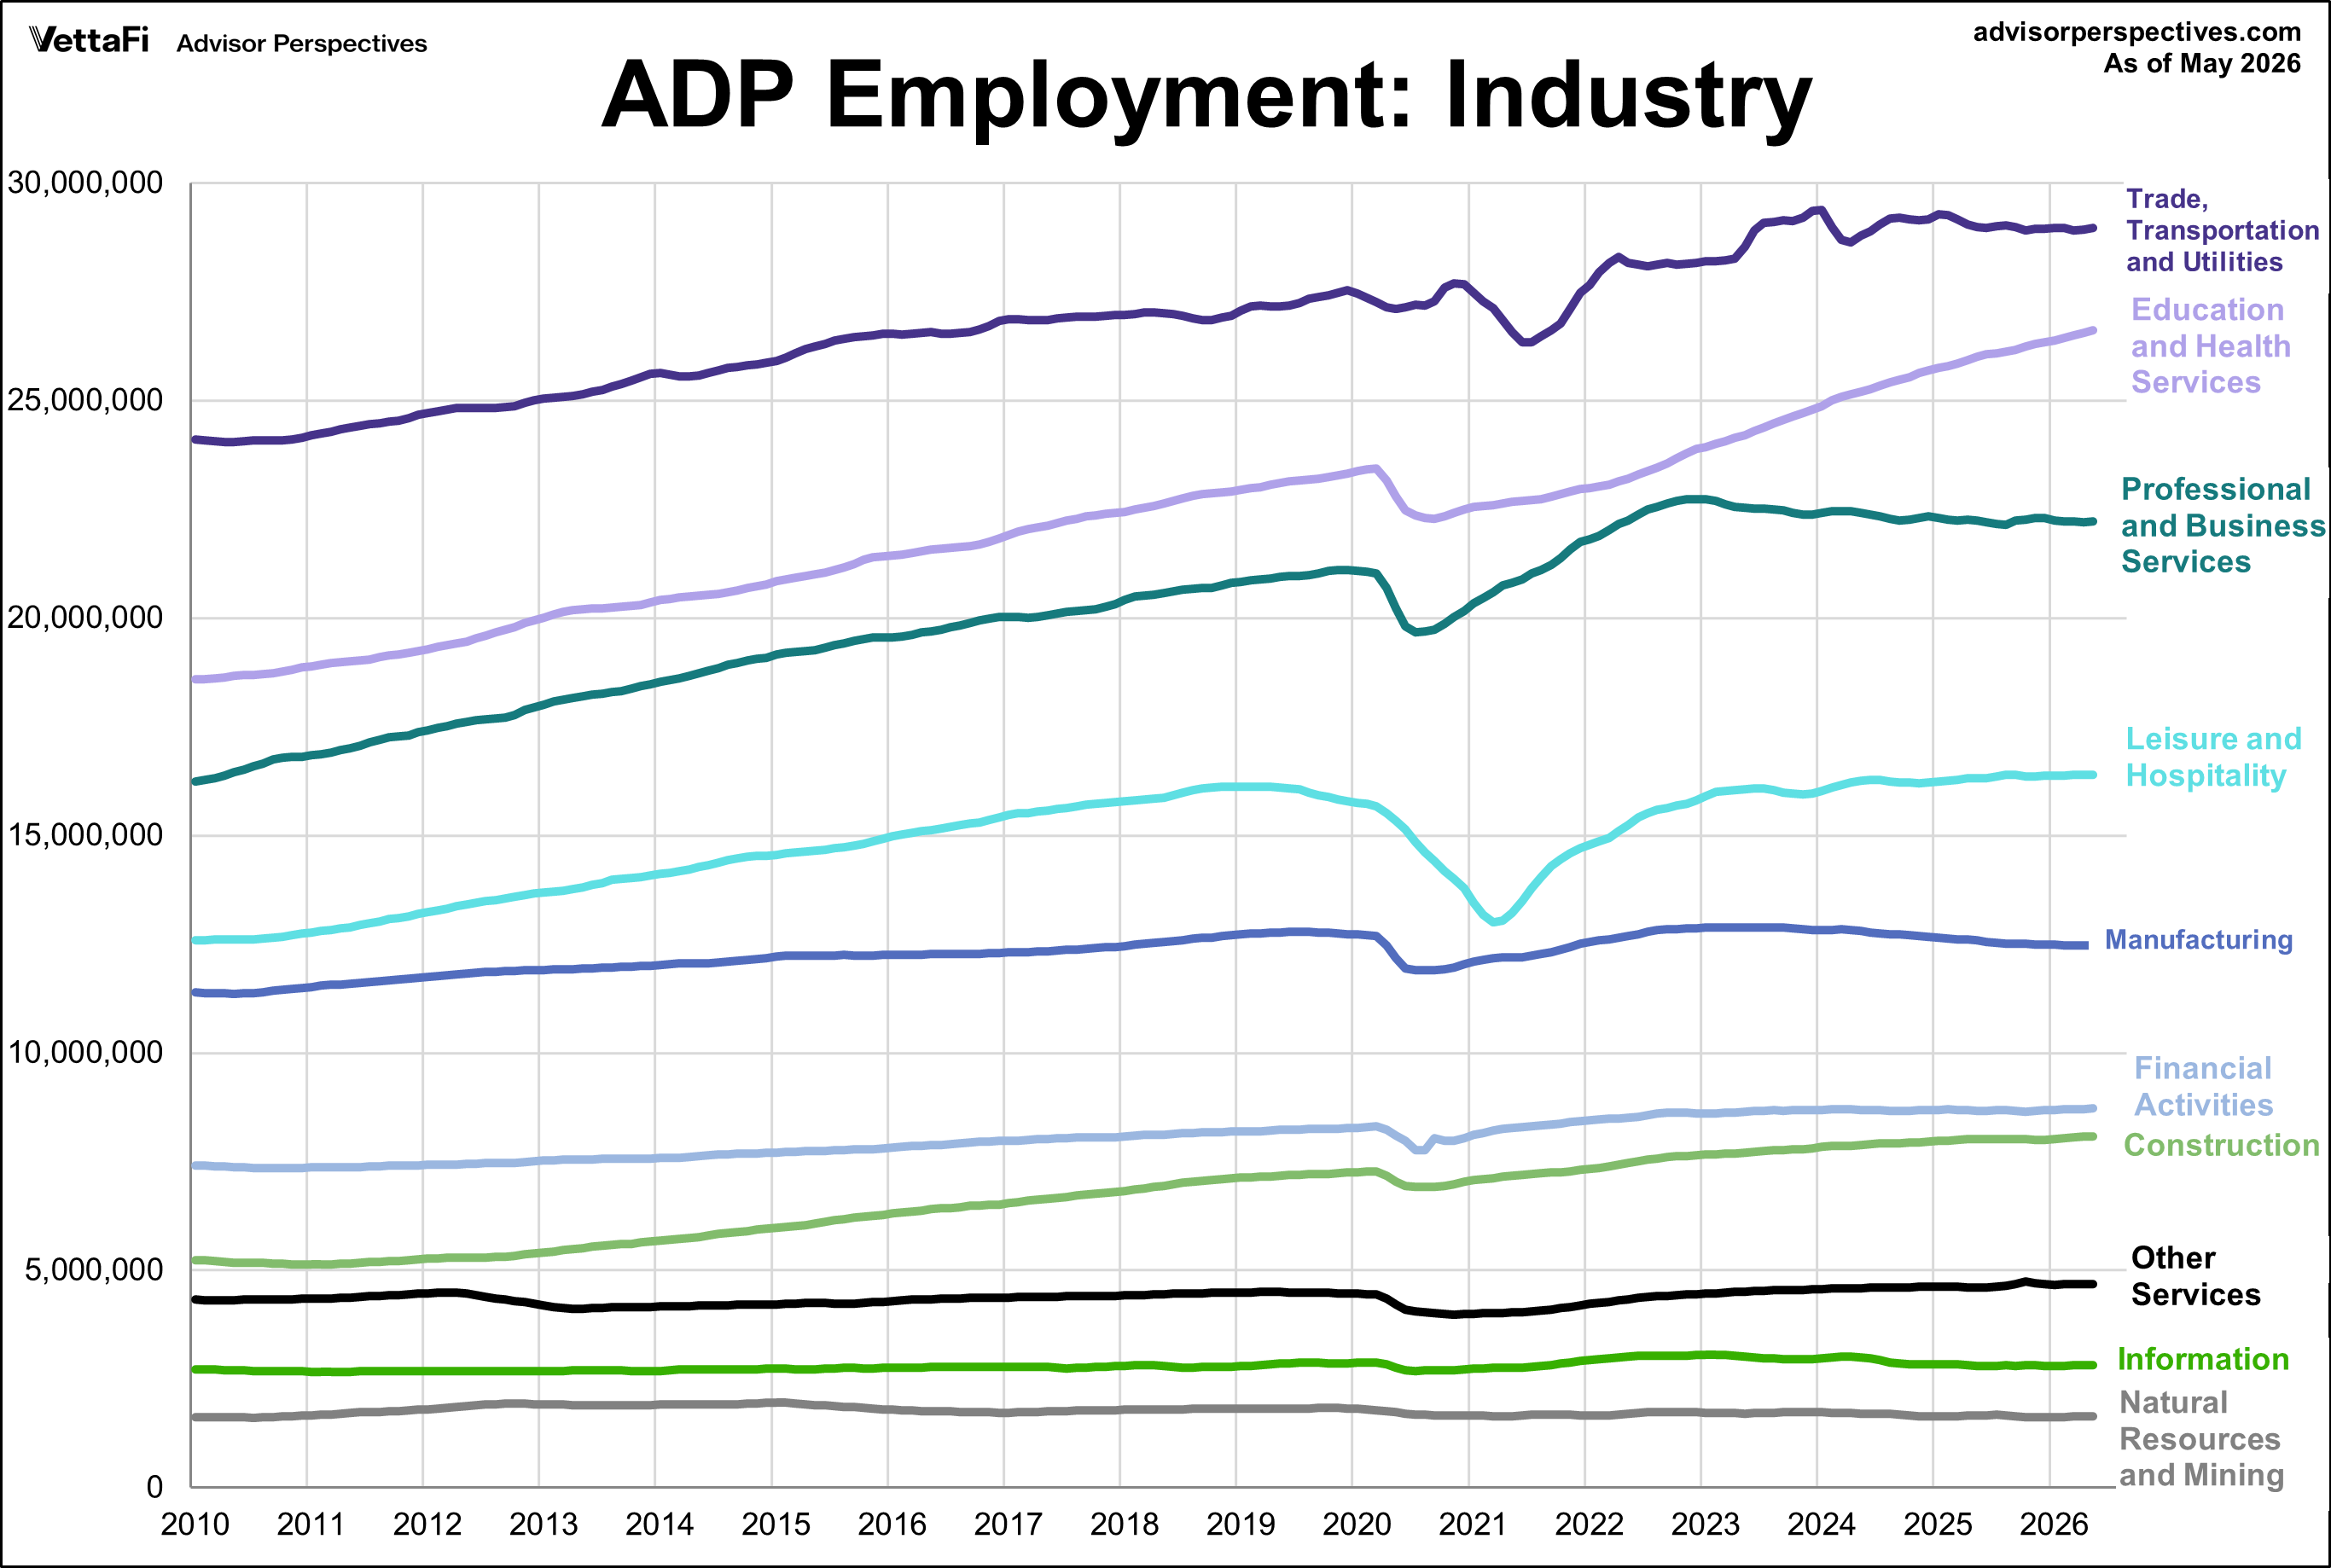
The next chart is a linear representation of each industry's contribution to overall employment from the start of the series.
ADP Employment: Region
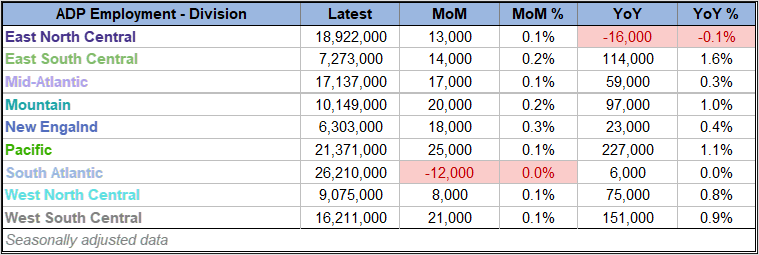
ADP also gives us a breakdown of Total Nonfarm Private Employment into nine regions (census divisions). The Pacific region added the most jobs last month, with a gain of 25,000. Meanwhile the South Atlantic region experienced the only loss, dropping by 12,000.
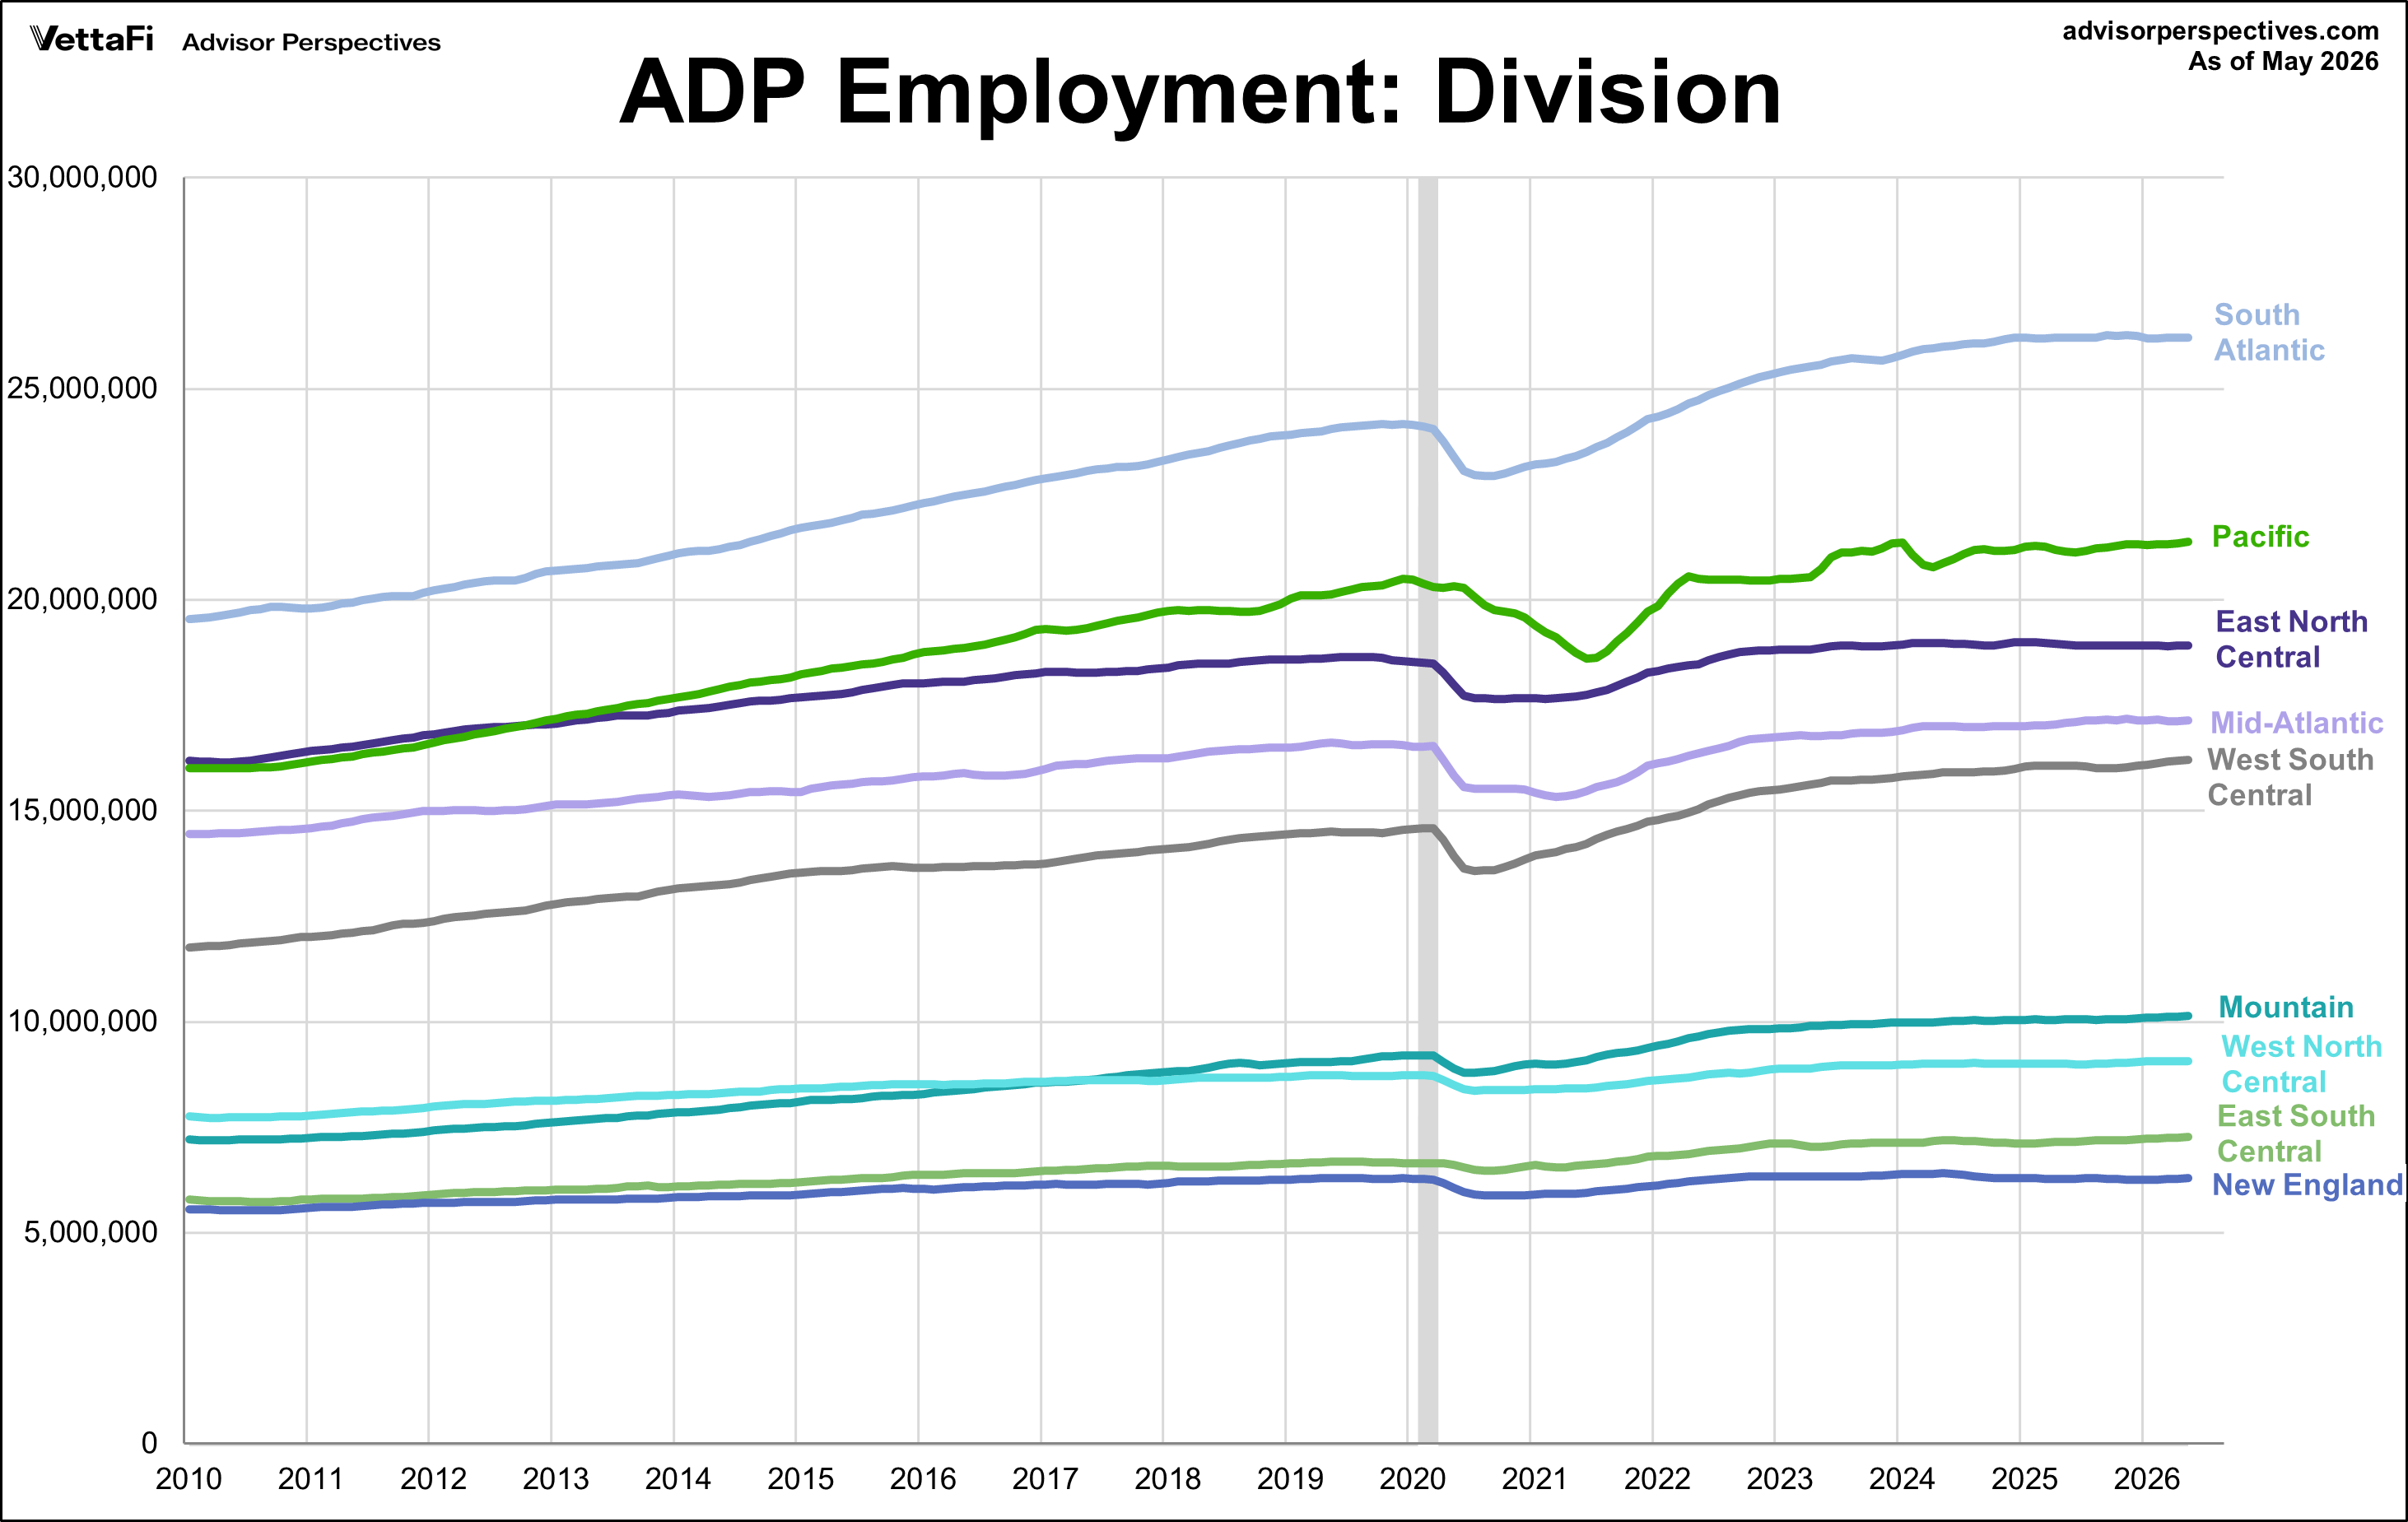
The next chart is a linear representation of each region's contribution to overall employment from the start of the series.
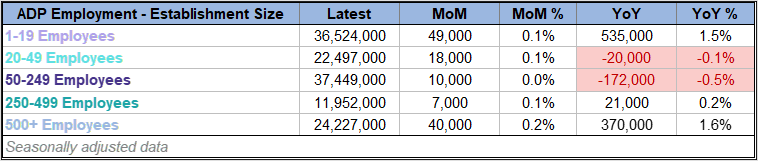
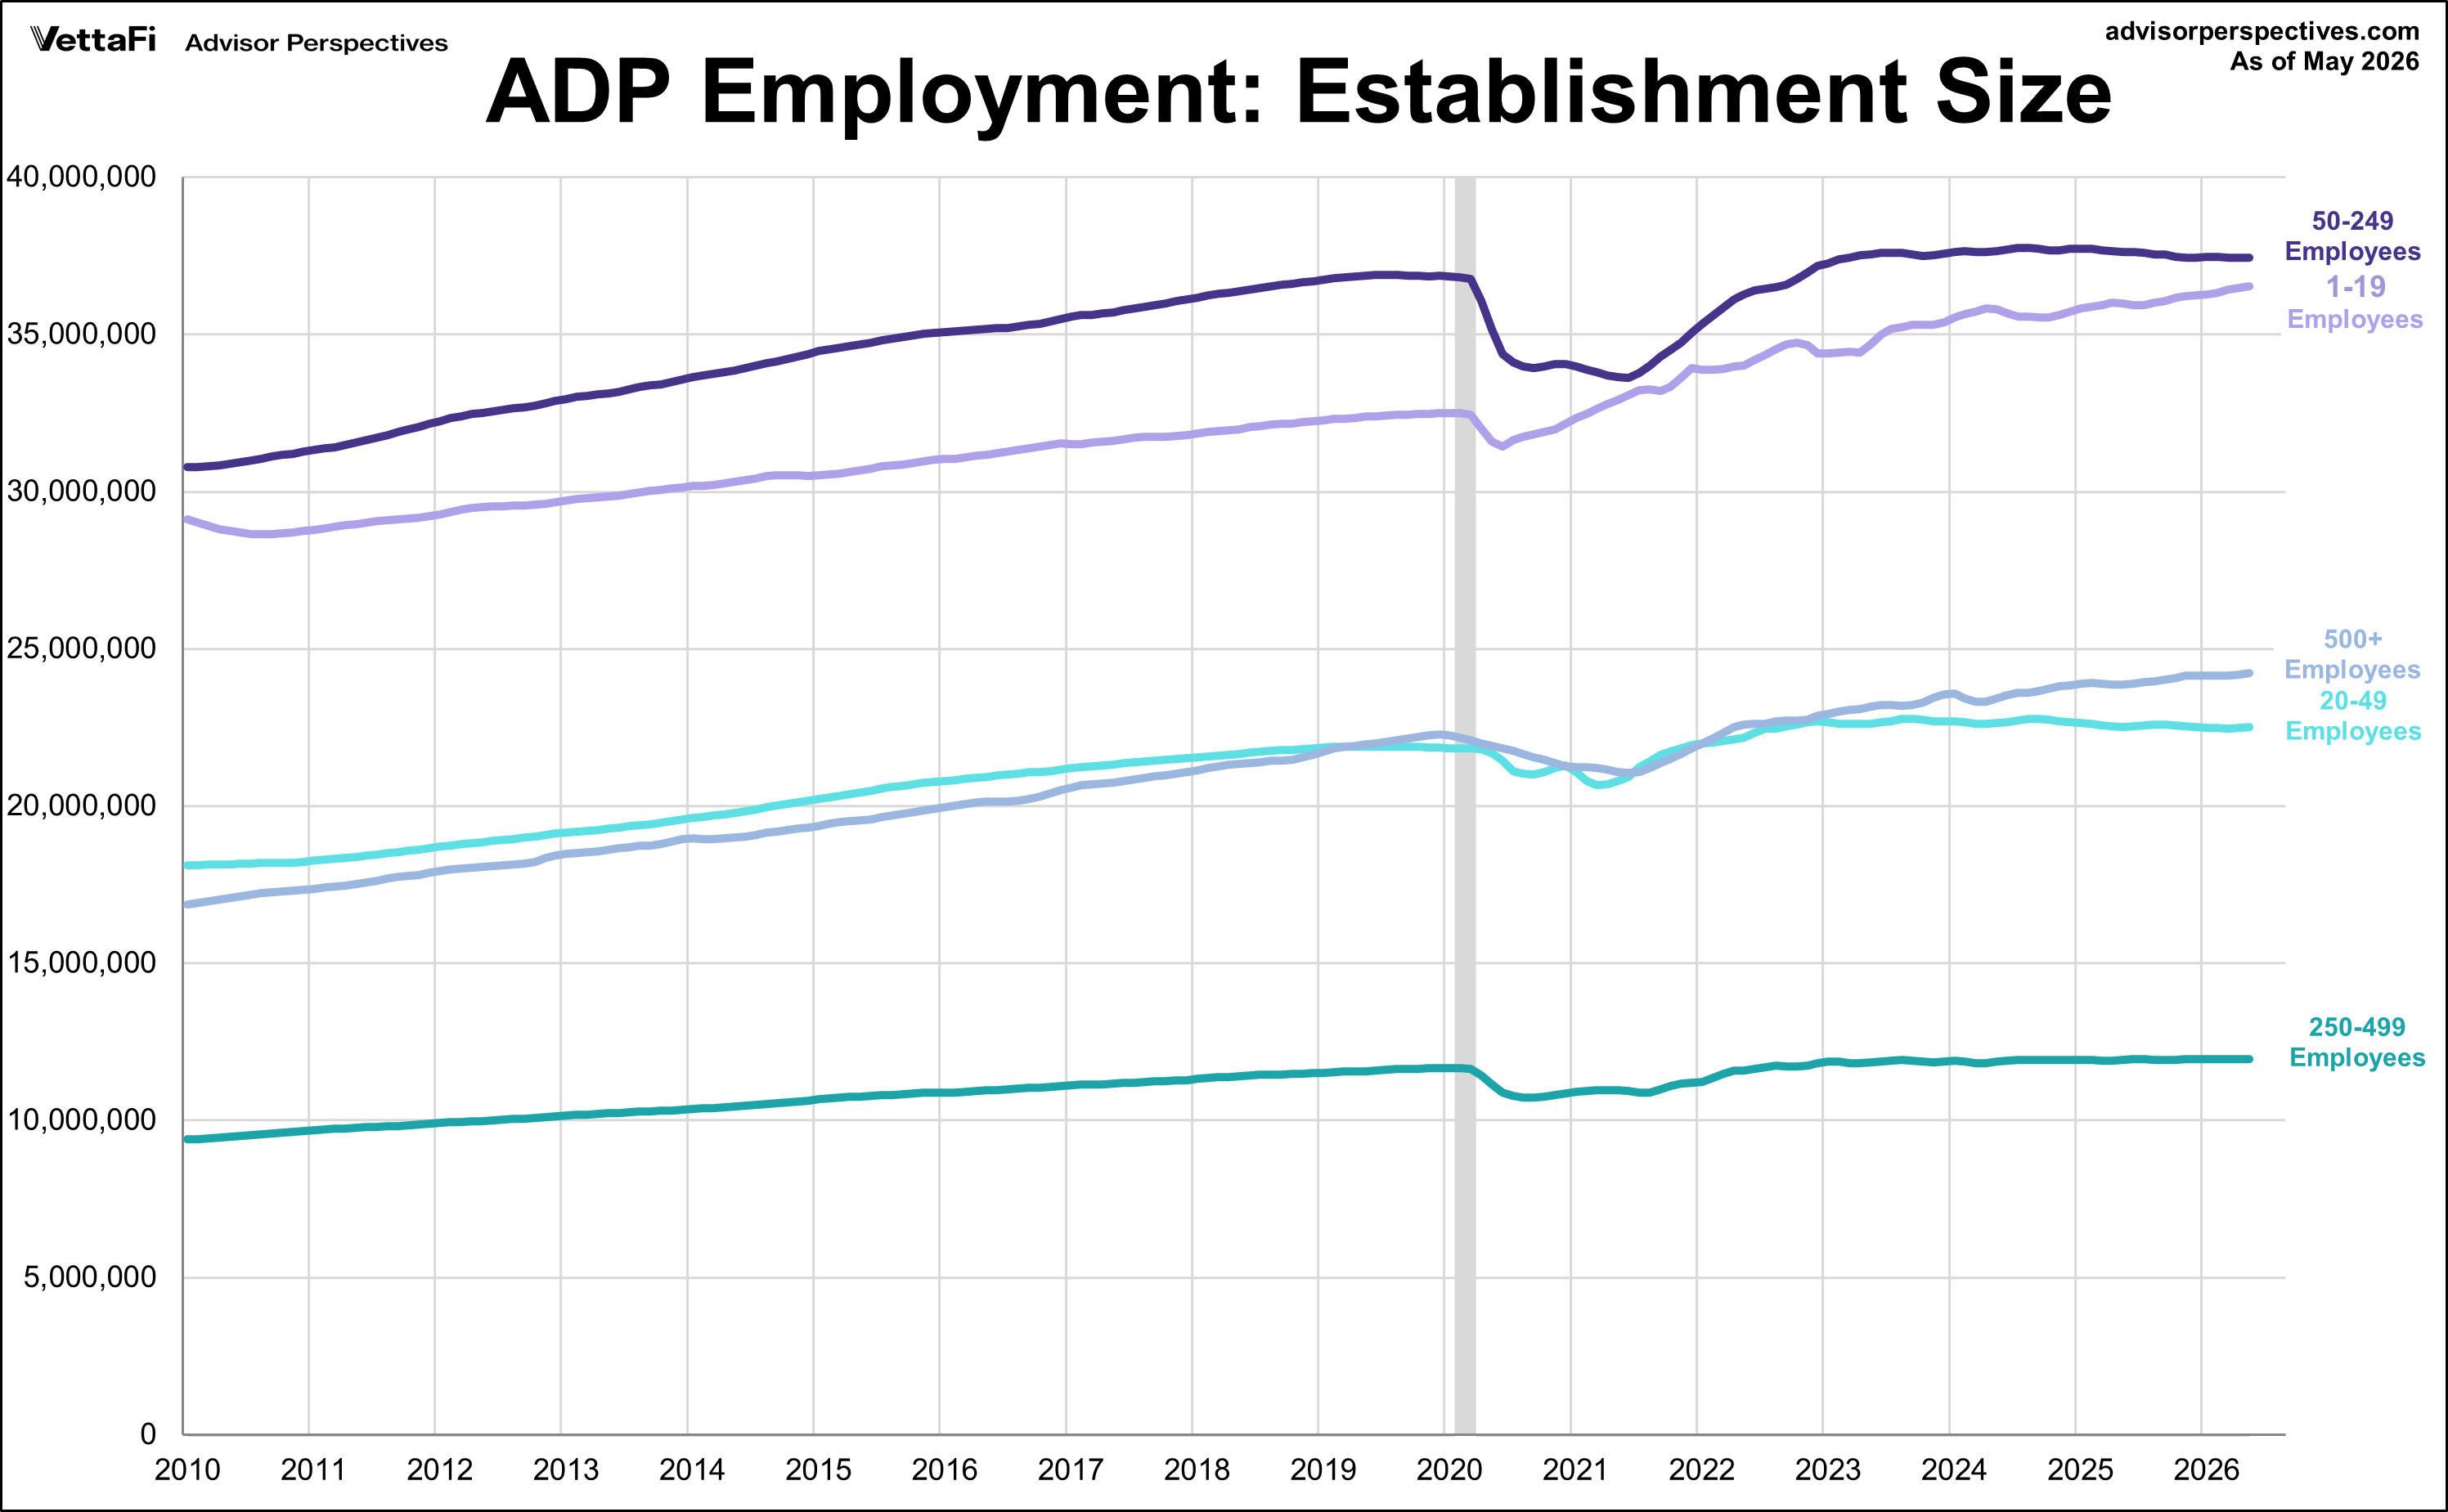
ADP Employment: Establishment Size
ADP also gives us a breakdown of Total Nonfarm Private Employment into five sizes. All establishment sizes experienced job growth last month with the companies of 1-19 employees experiencing the largest gain, adding 49,000 private jobs.
The next chart is a linear representation of each establishment size's contribution to overall employment from the start of the series.
Here's our list of monthly employment updates:
Employment Situation Report
Unemployment Claims
Civilian Labor Force, Unemployment Claims, and the Business Cycle
Ratio of Part-Time and Full-Time Employment
Multiple Jobholders
Read more updates by Jen Nash
 As we see in the chart above, the trend peaked in September 2015 and then went negative for the first time in late 2019, just before the NBER declared a recession start. The COVID-19 pandemic has brought employment numbers down to levels we have never seen this century. The trend reached a new high in 2021 at 728,000 but has dropped below pre-pandemic levels over the last few years.