Now that we're more than halfway through 2025, let's take a look at the top 10 most-read charts so far for the year. From market updates and valuations to consumer attitudes and gas prices, these charts have provided crucial insights into the economic landscape that has shaped the first six months.
-
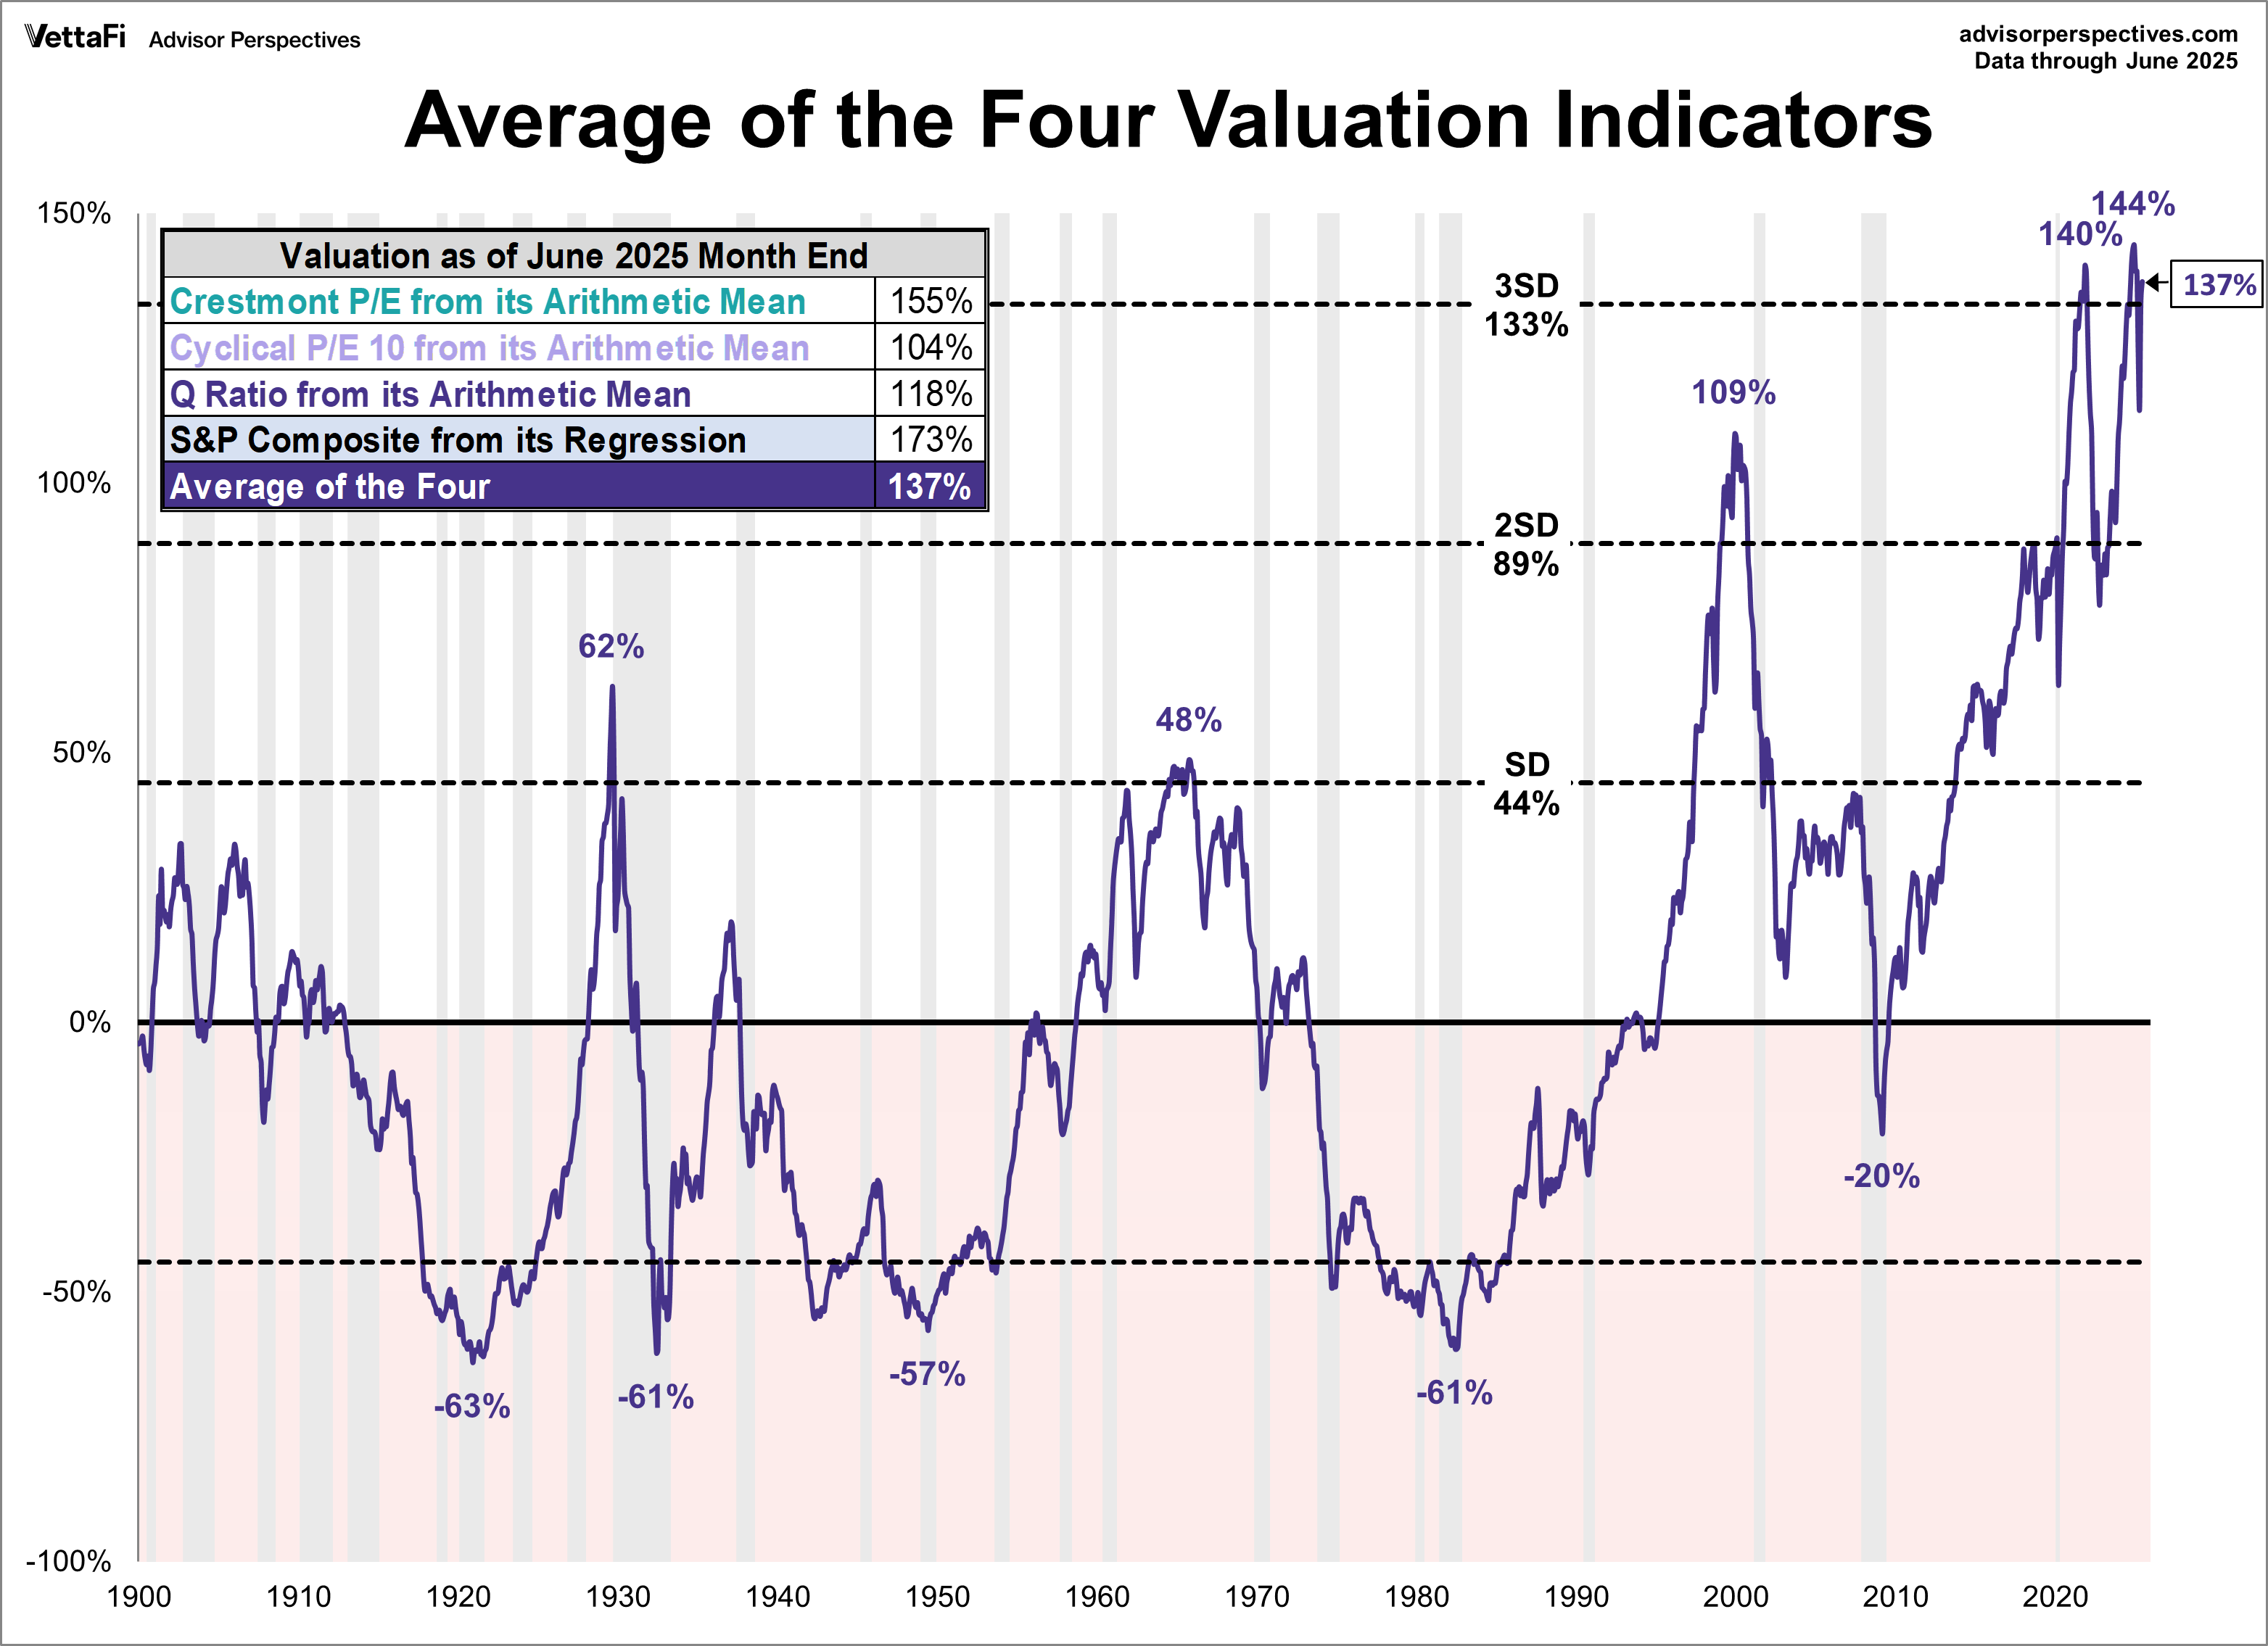
A comparative analysis of four valuation indicators (Regression to Trend, Crestmont P/E, Q-Ratio, and P/E 10). Based on June’s S&P 500 monthly data, the market is OVERVALUED somewhere in the range of 104% to 137%, depending on the indicator.

-
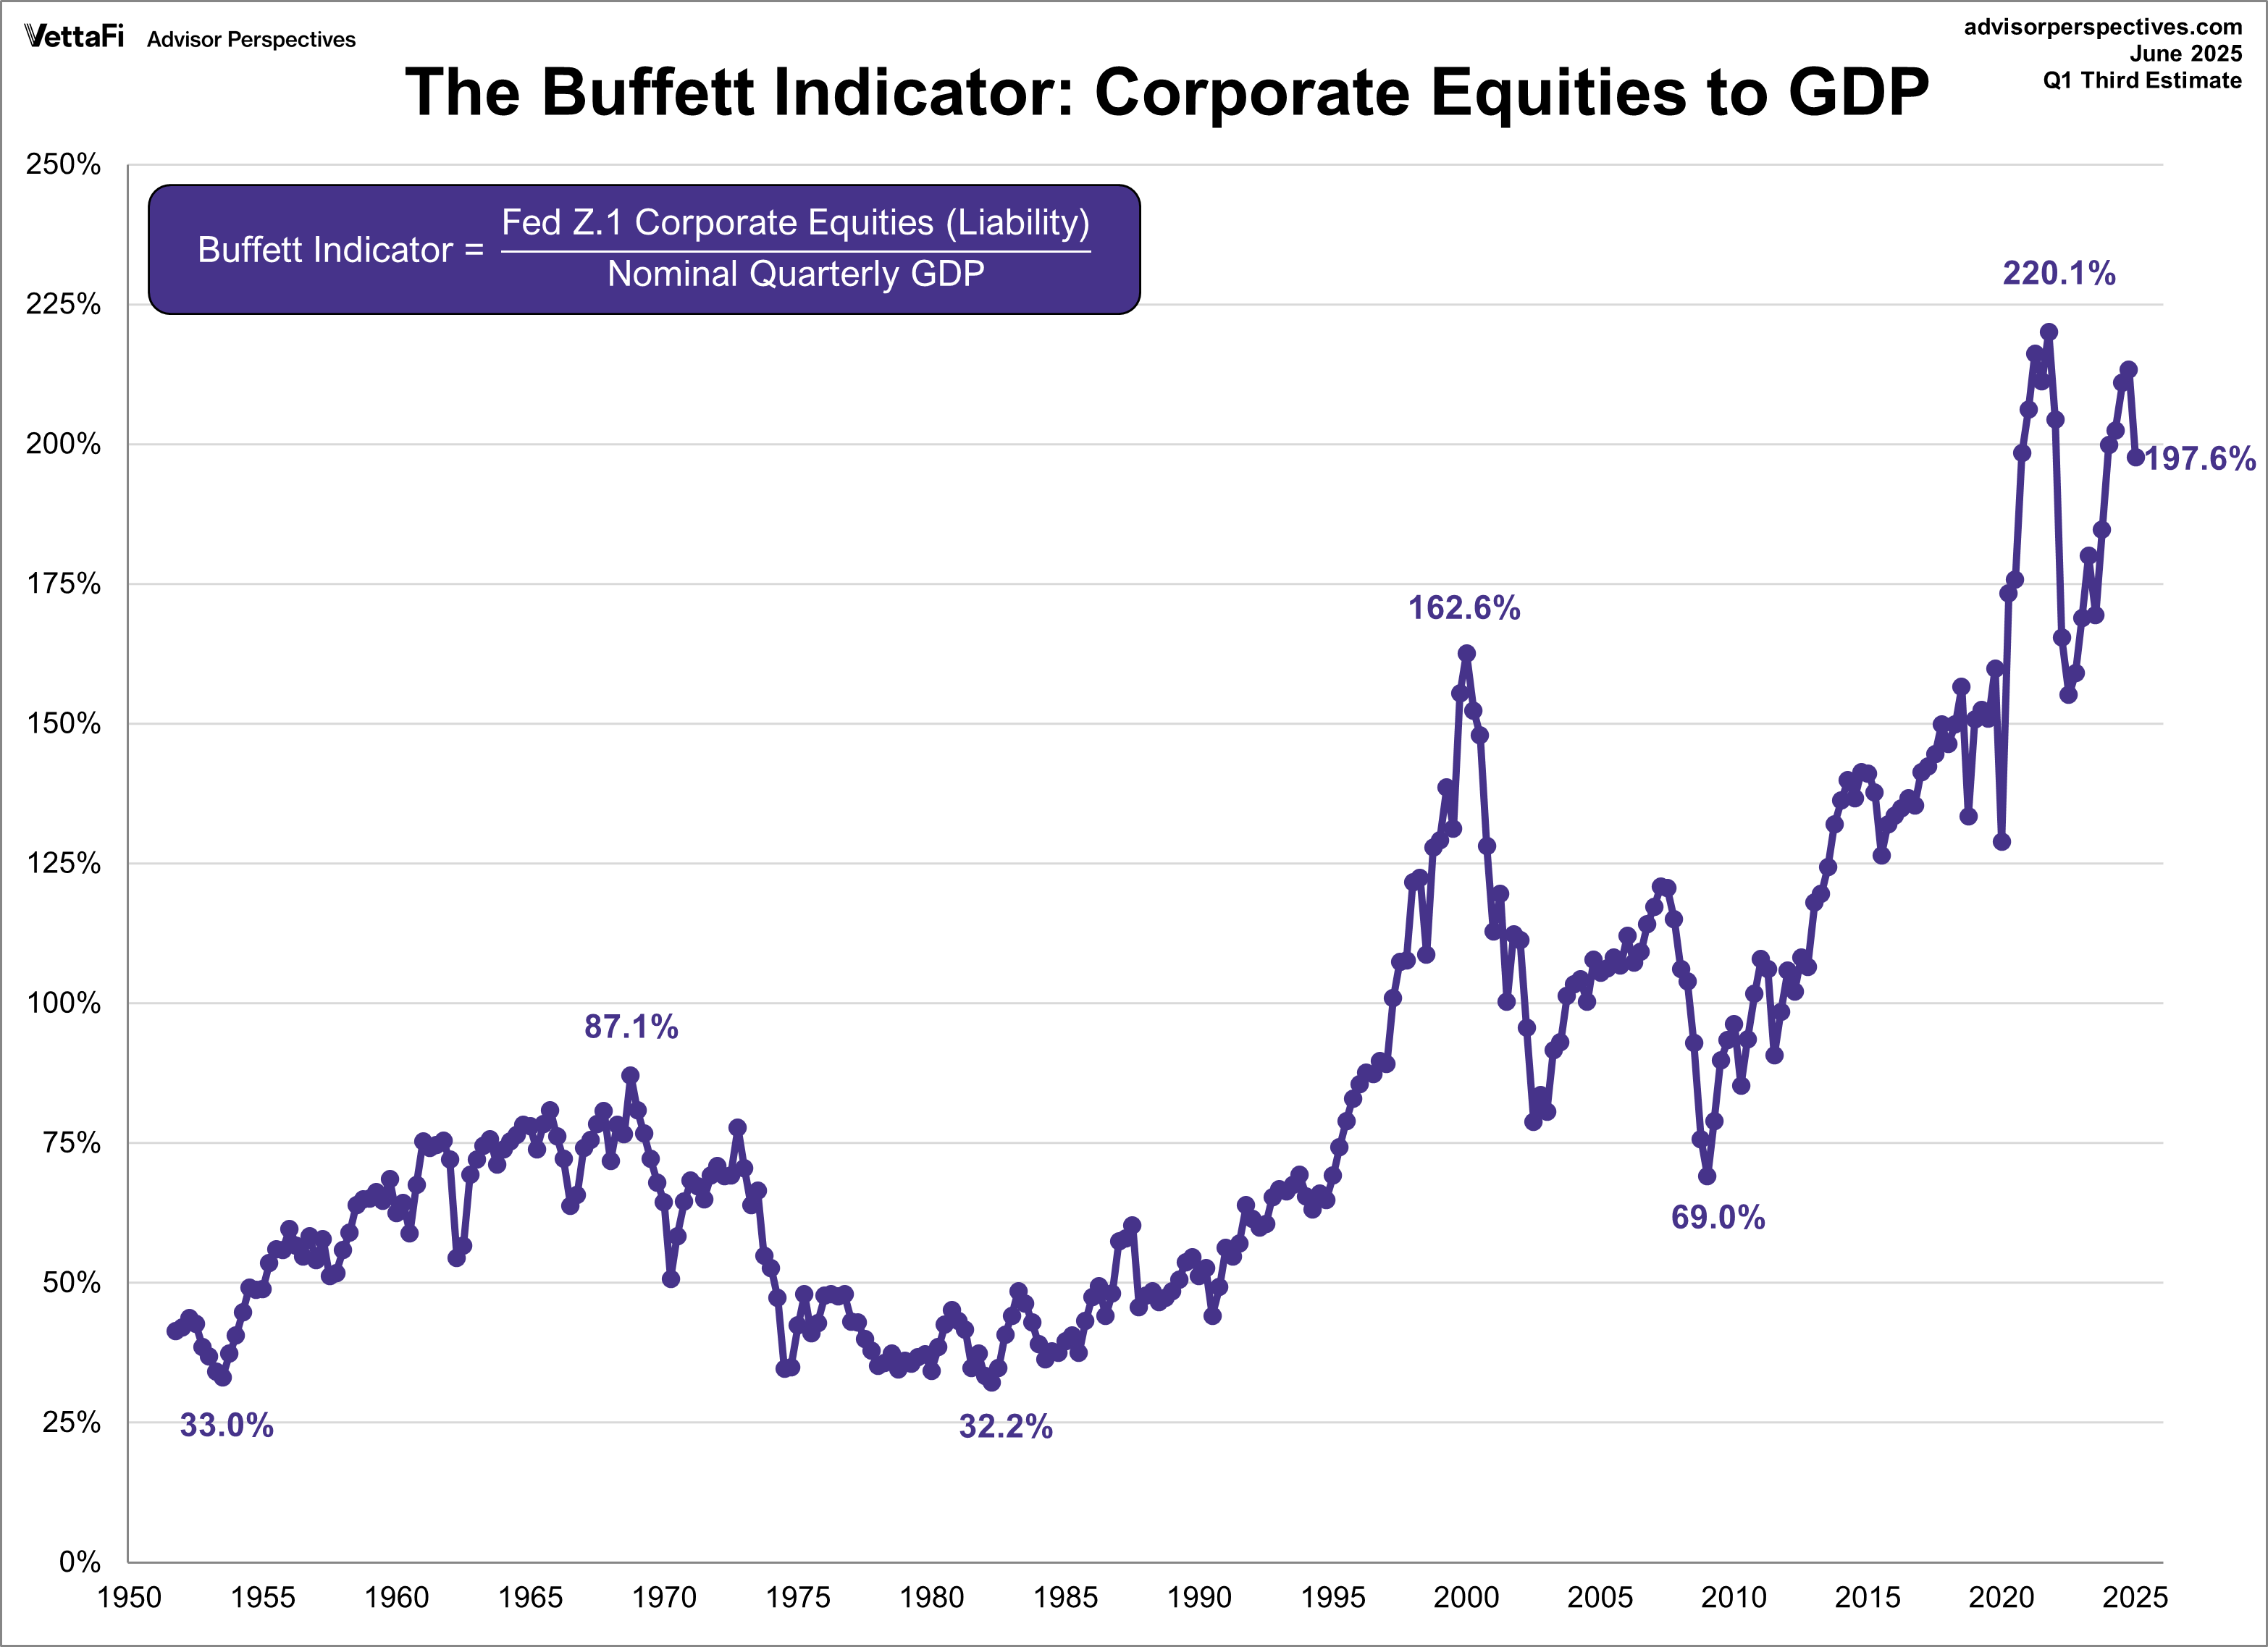
A long-term valuation metric comparing the total market value of publicly traded stocks to the country’s GDP. Using the Q1 GDP third estimate and June S&P 500 close data, the latest reading is 197.6%. That signals an overvalued market.
-
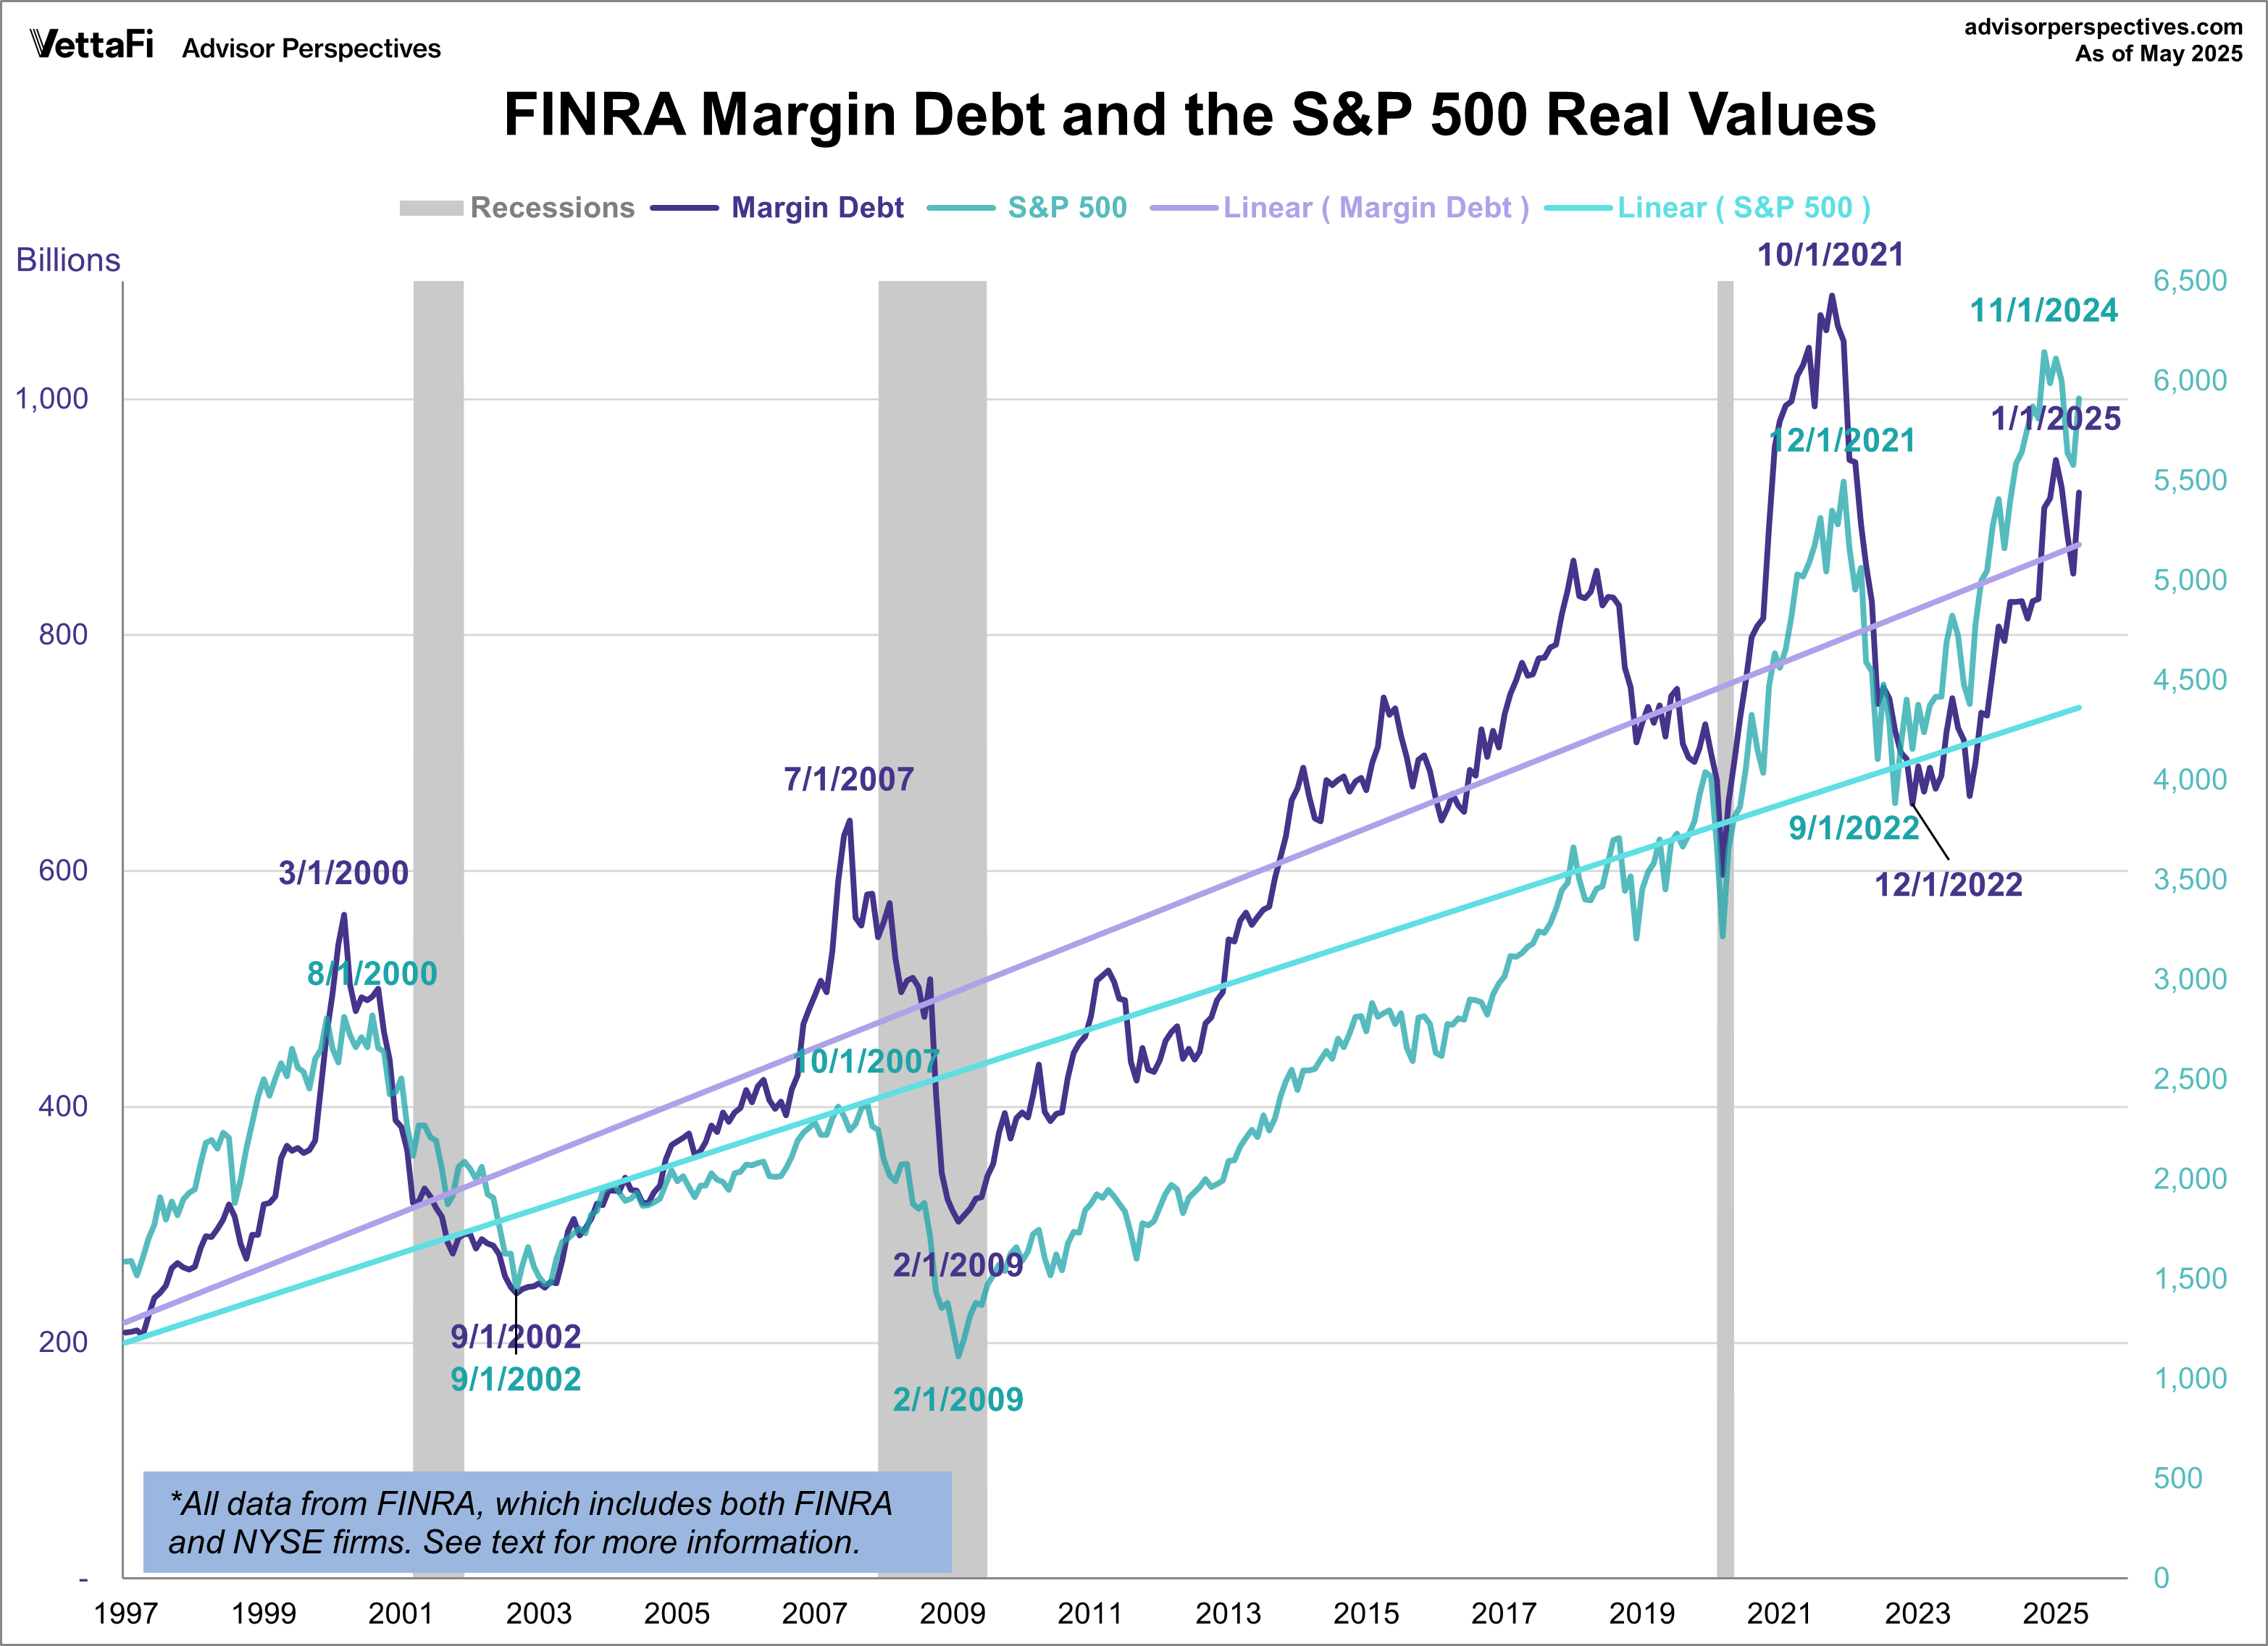
A depiction of the money investors borrowed from brokers via margin accounts, offering insights into investor sentiment and risk appetite. As of June 2025, the latest margin debt level is at $1007.96 billion, the highest on record.
-
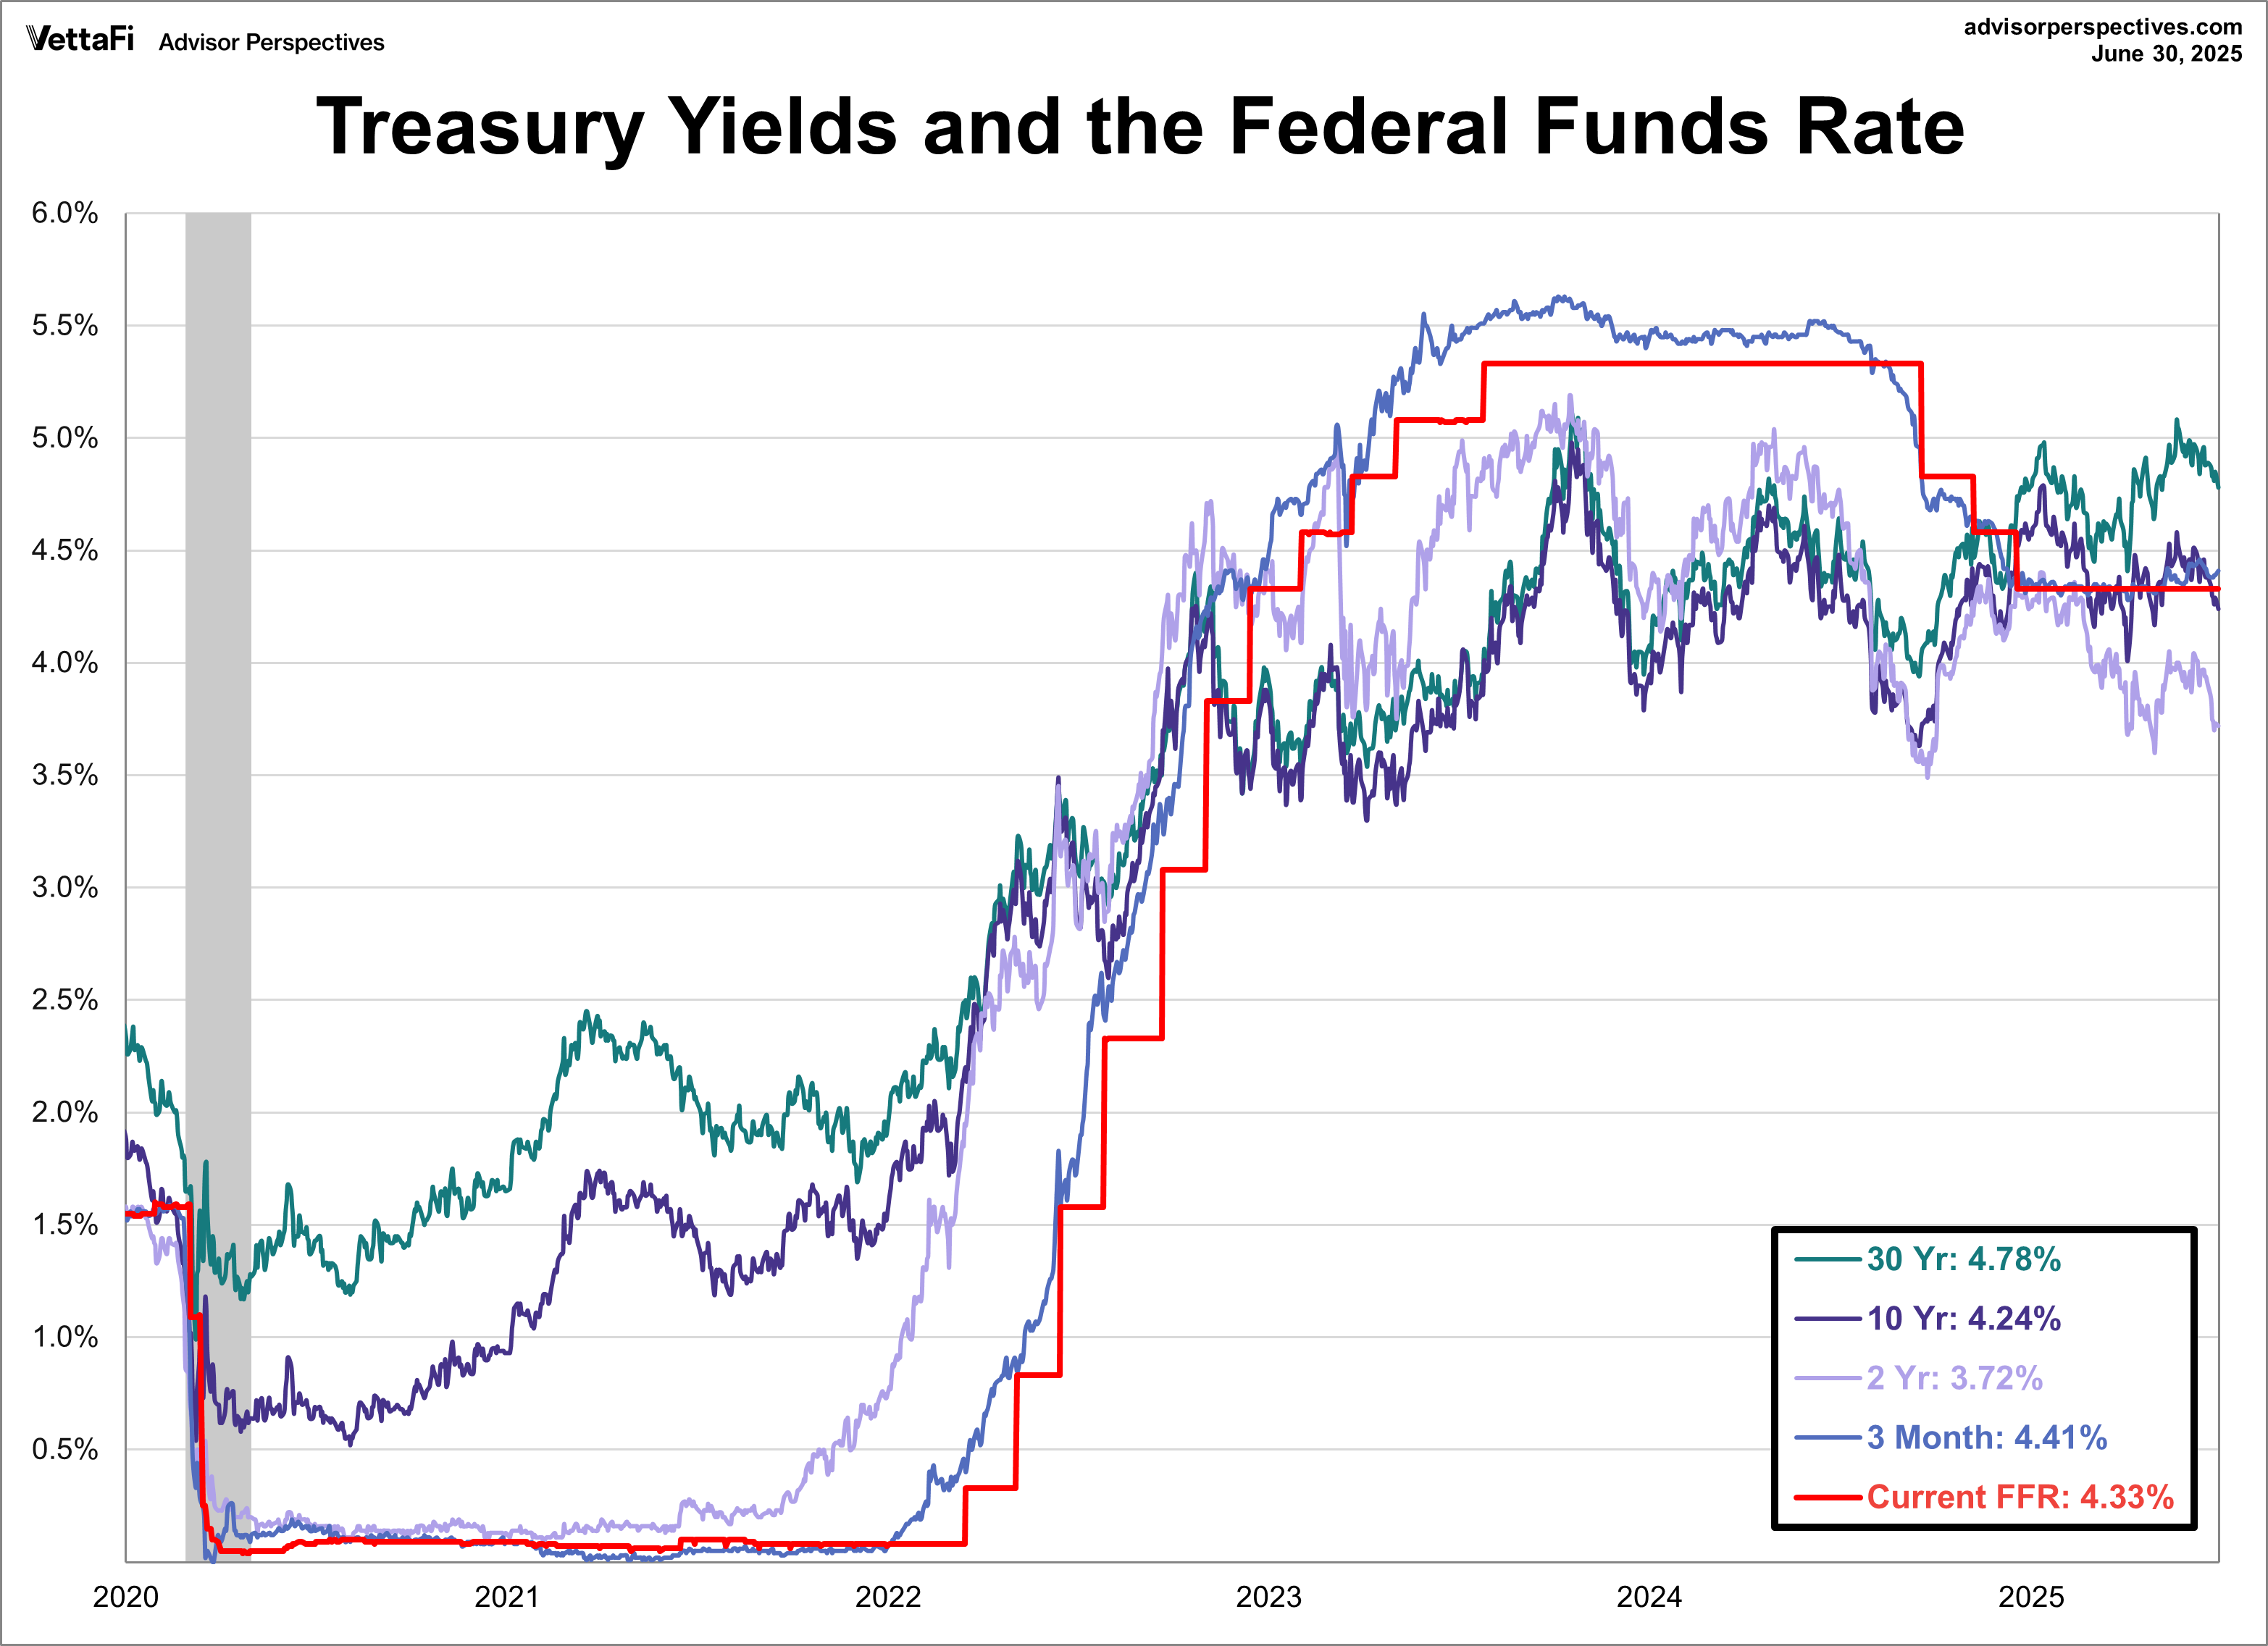
A weekly update that highlights the performance of several Treasury bonds. The yield on the 10-year note ended the first half of the year at 4.24%. The yield on the two-year note ended at 3.72%.
-
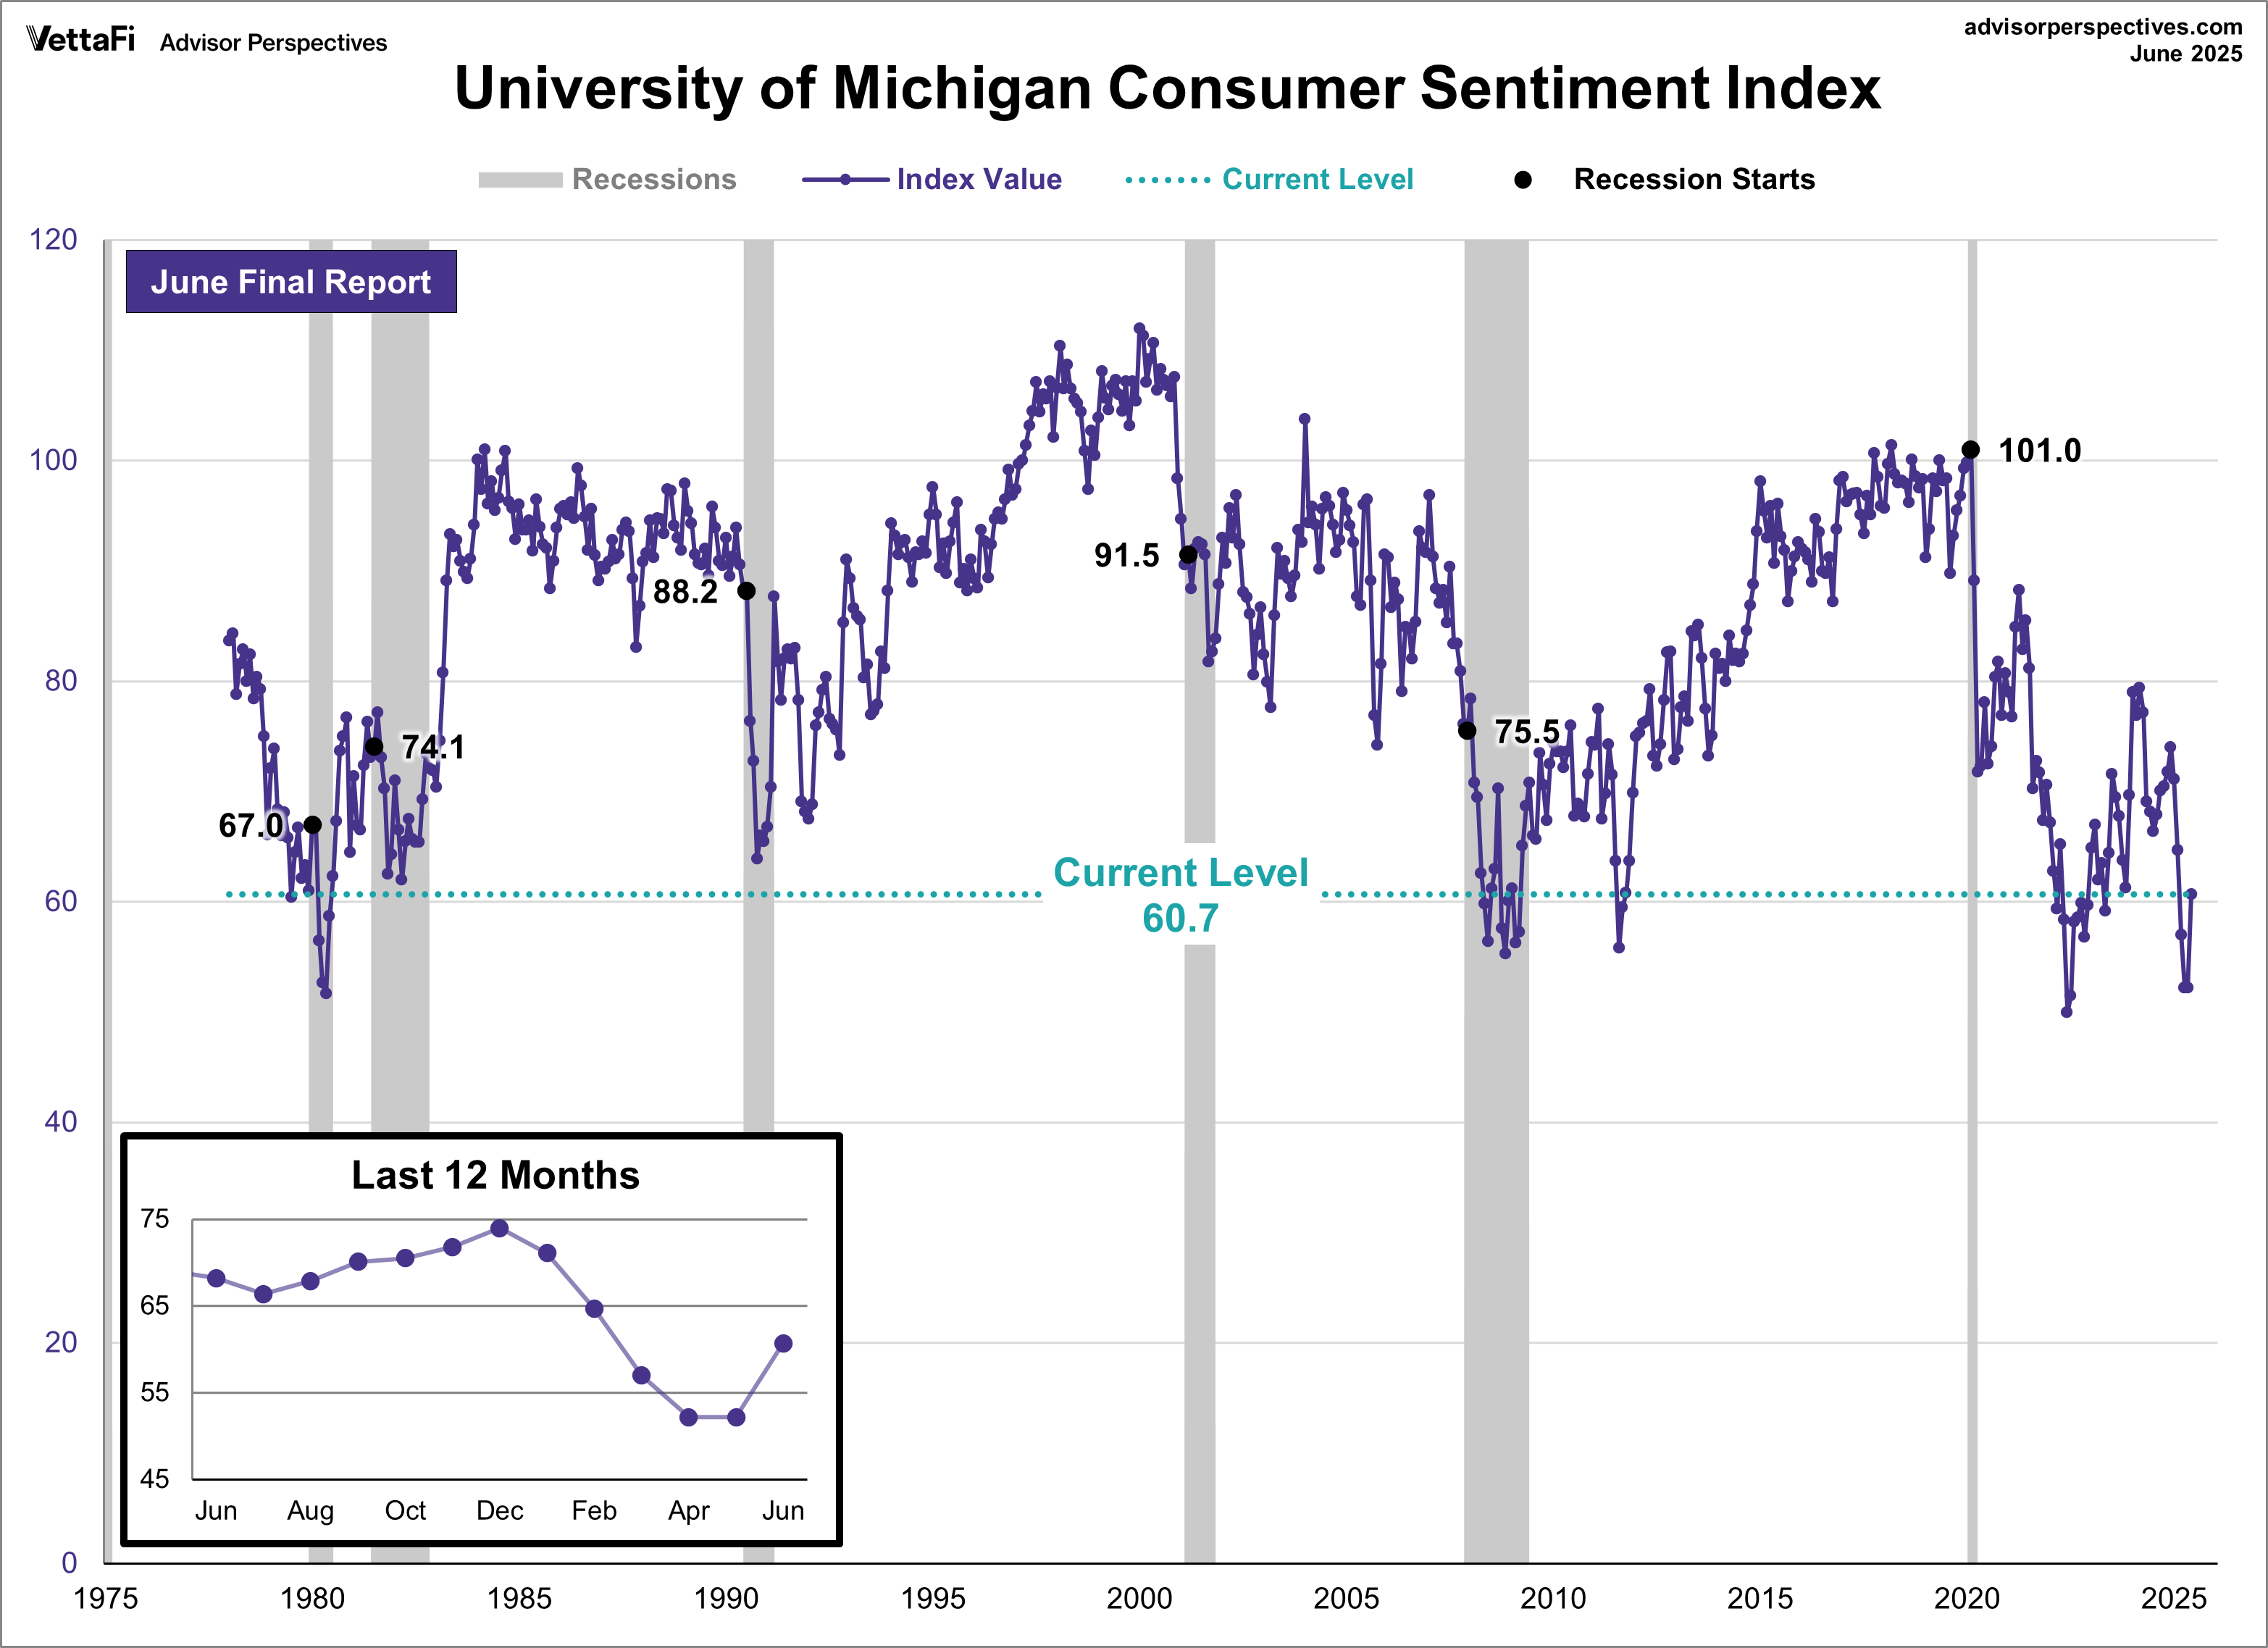
A monthly survey of consumer confidence levels regarding the economy, personal finances, business conditions, and buying conditions. The index closed out the first half of the year by increasing for the first time in six months, rising to 60.7 at the end of June.
-
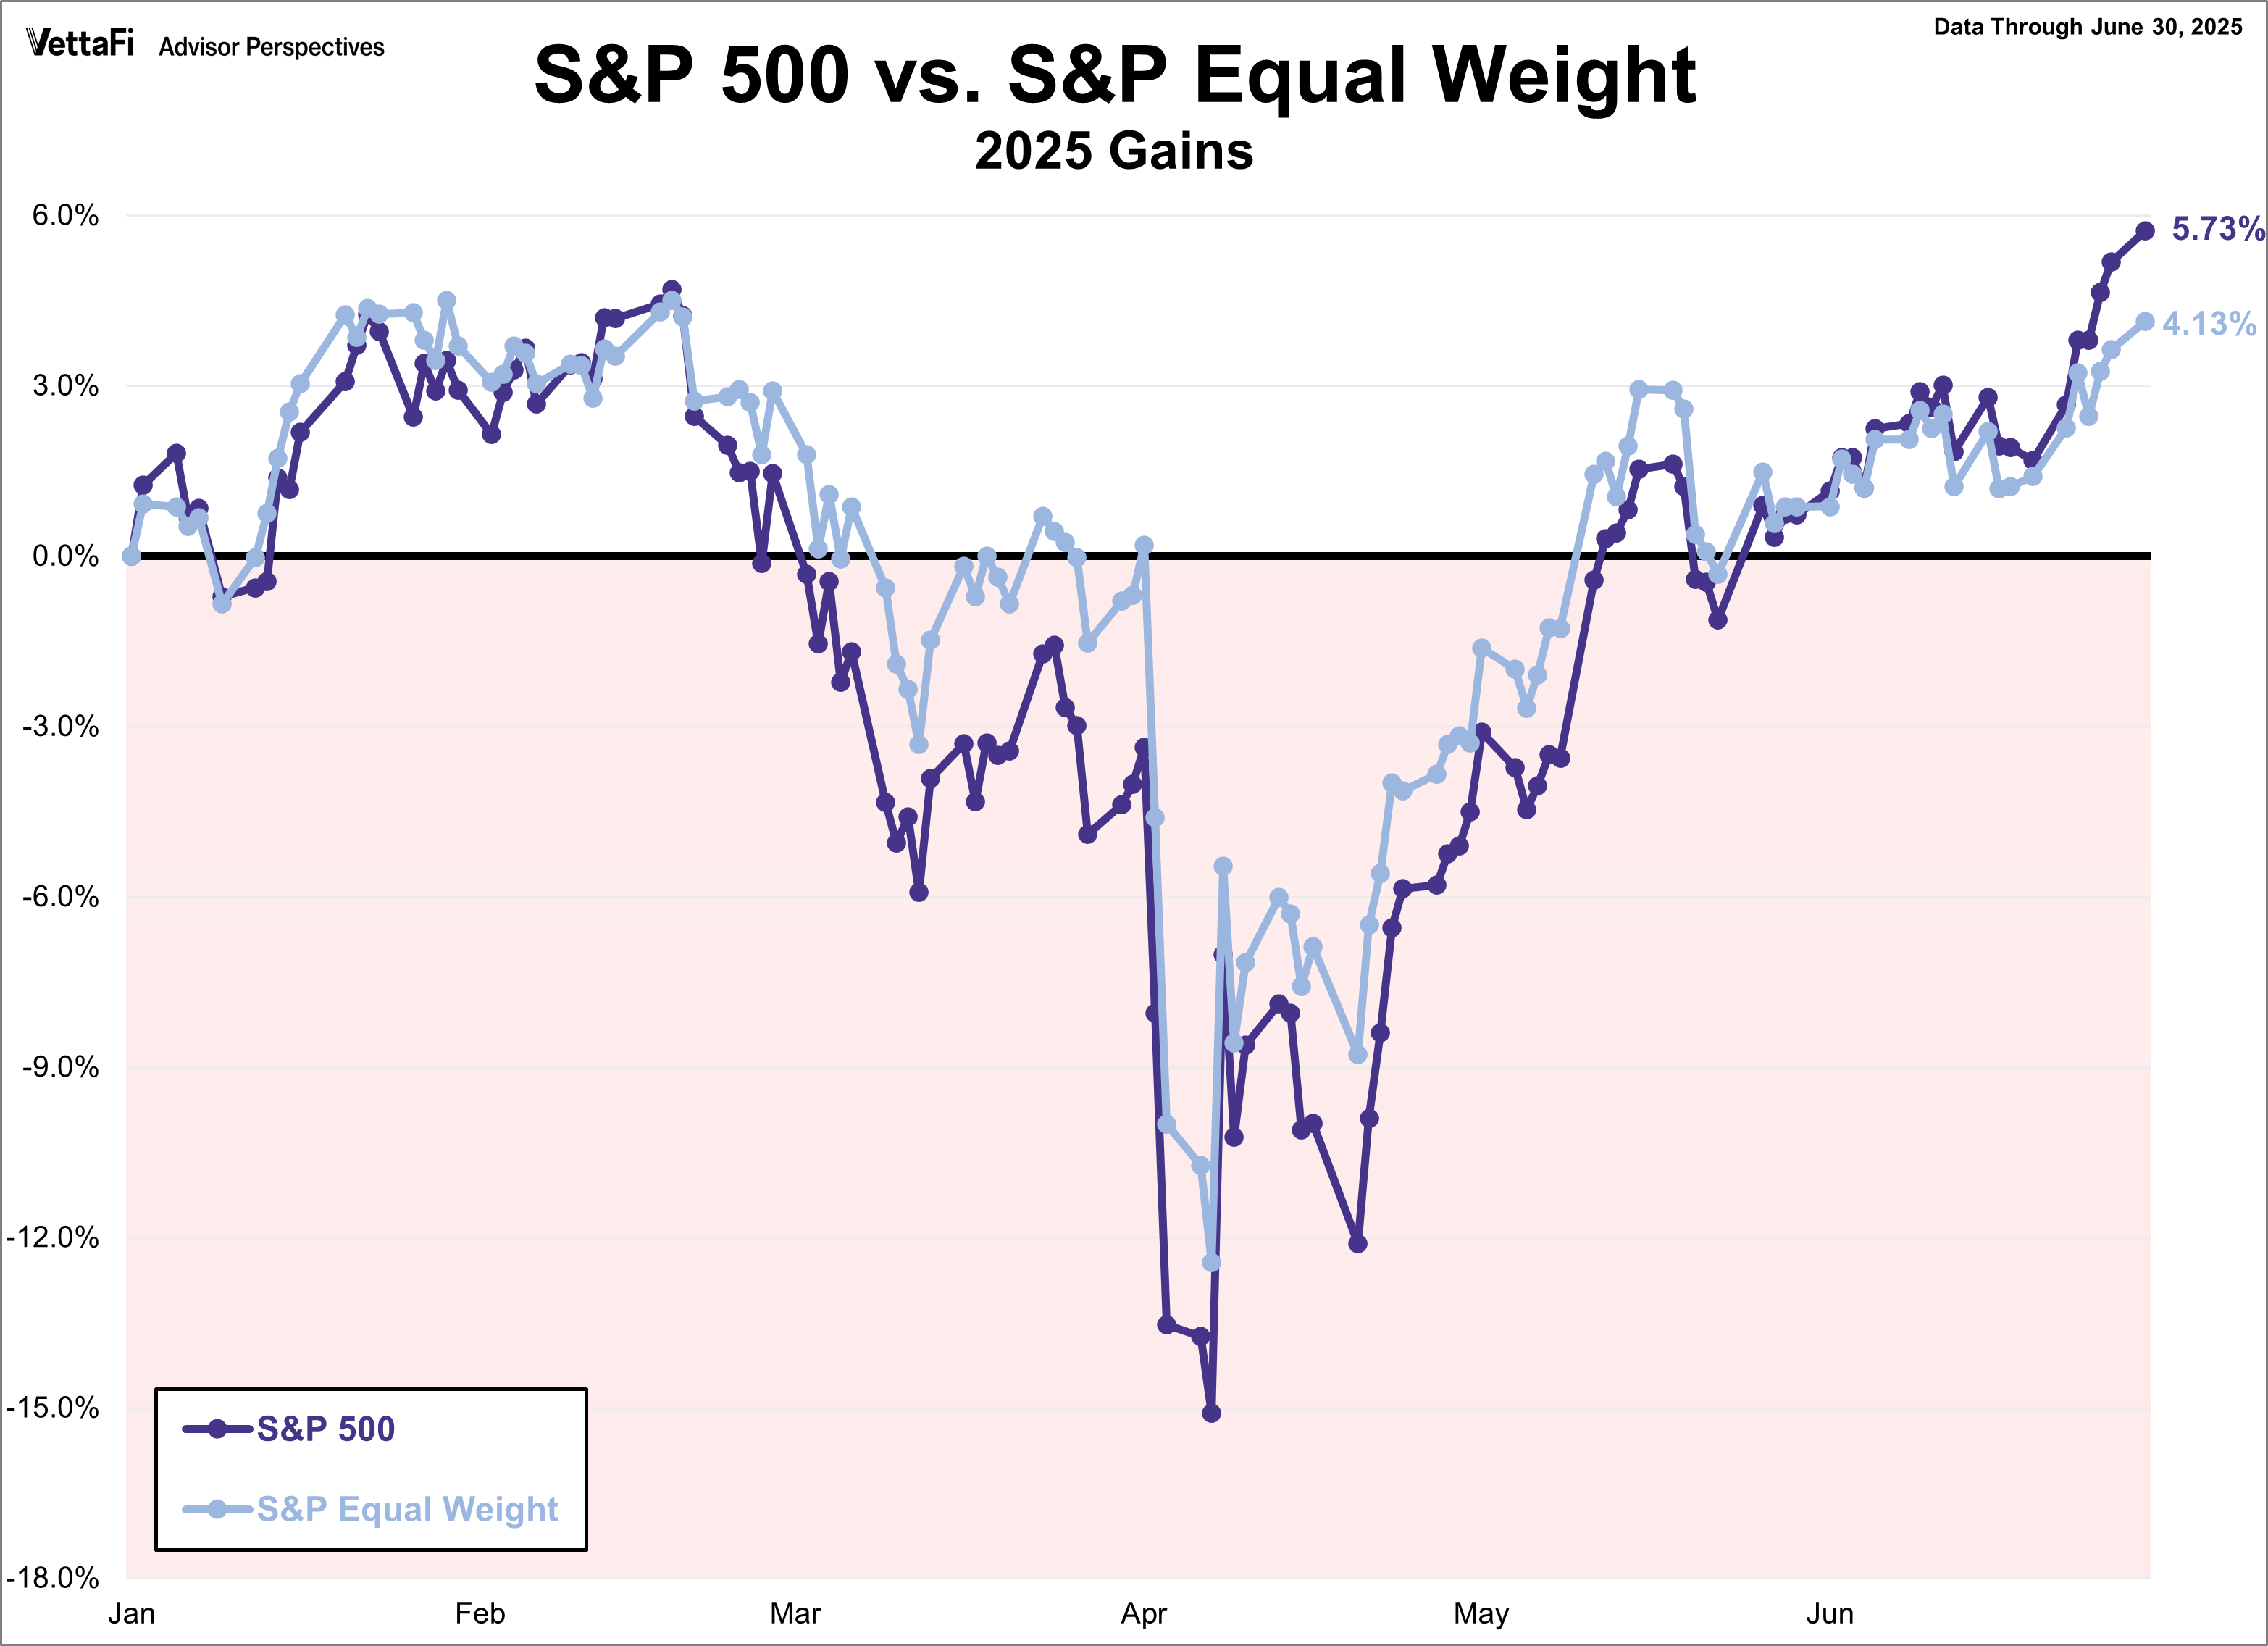
A weekly update that highlights the S&P 500’s performance and broader index trends. The index experienced a volatile first half of the year, ultimately finishing up 5.73% at a new record high. In contrast, the S&P Equal Weight index, which had outpaced the broader index for much of the year, concluded June up 4.13%.
-
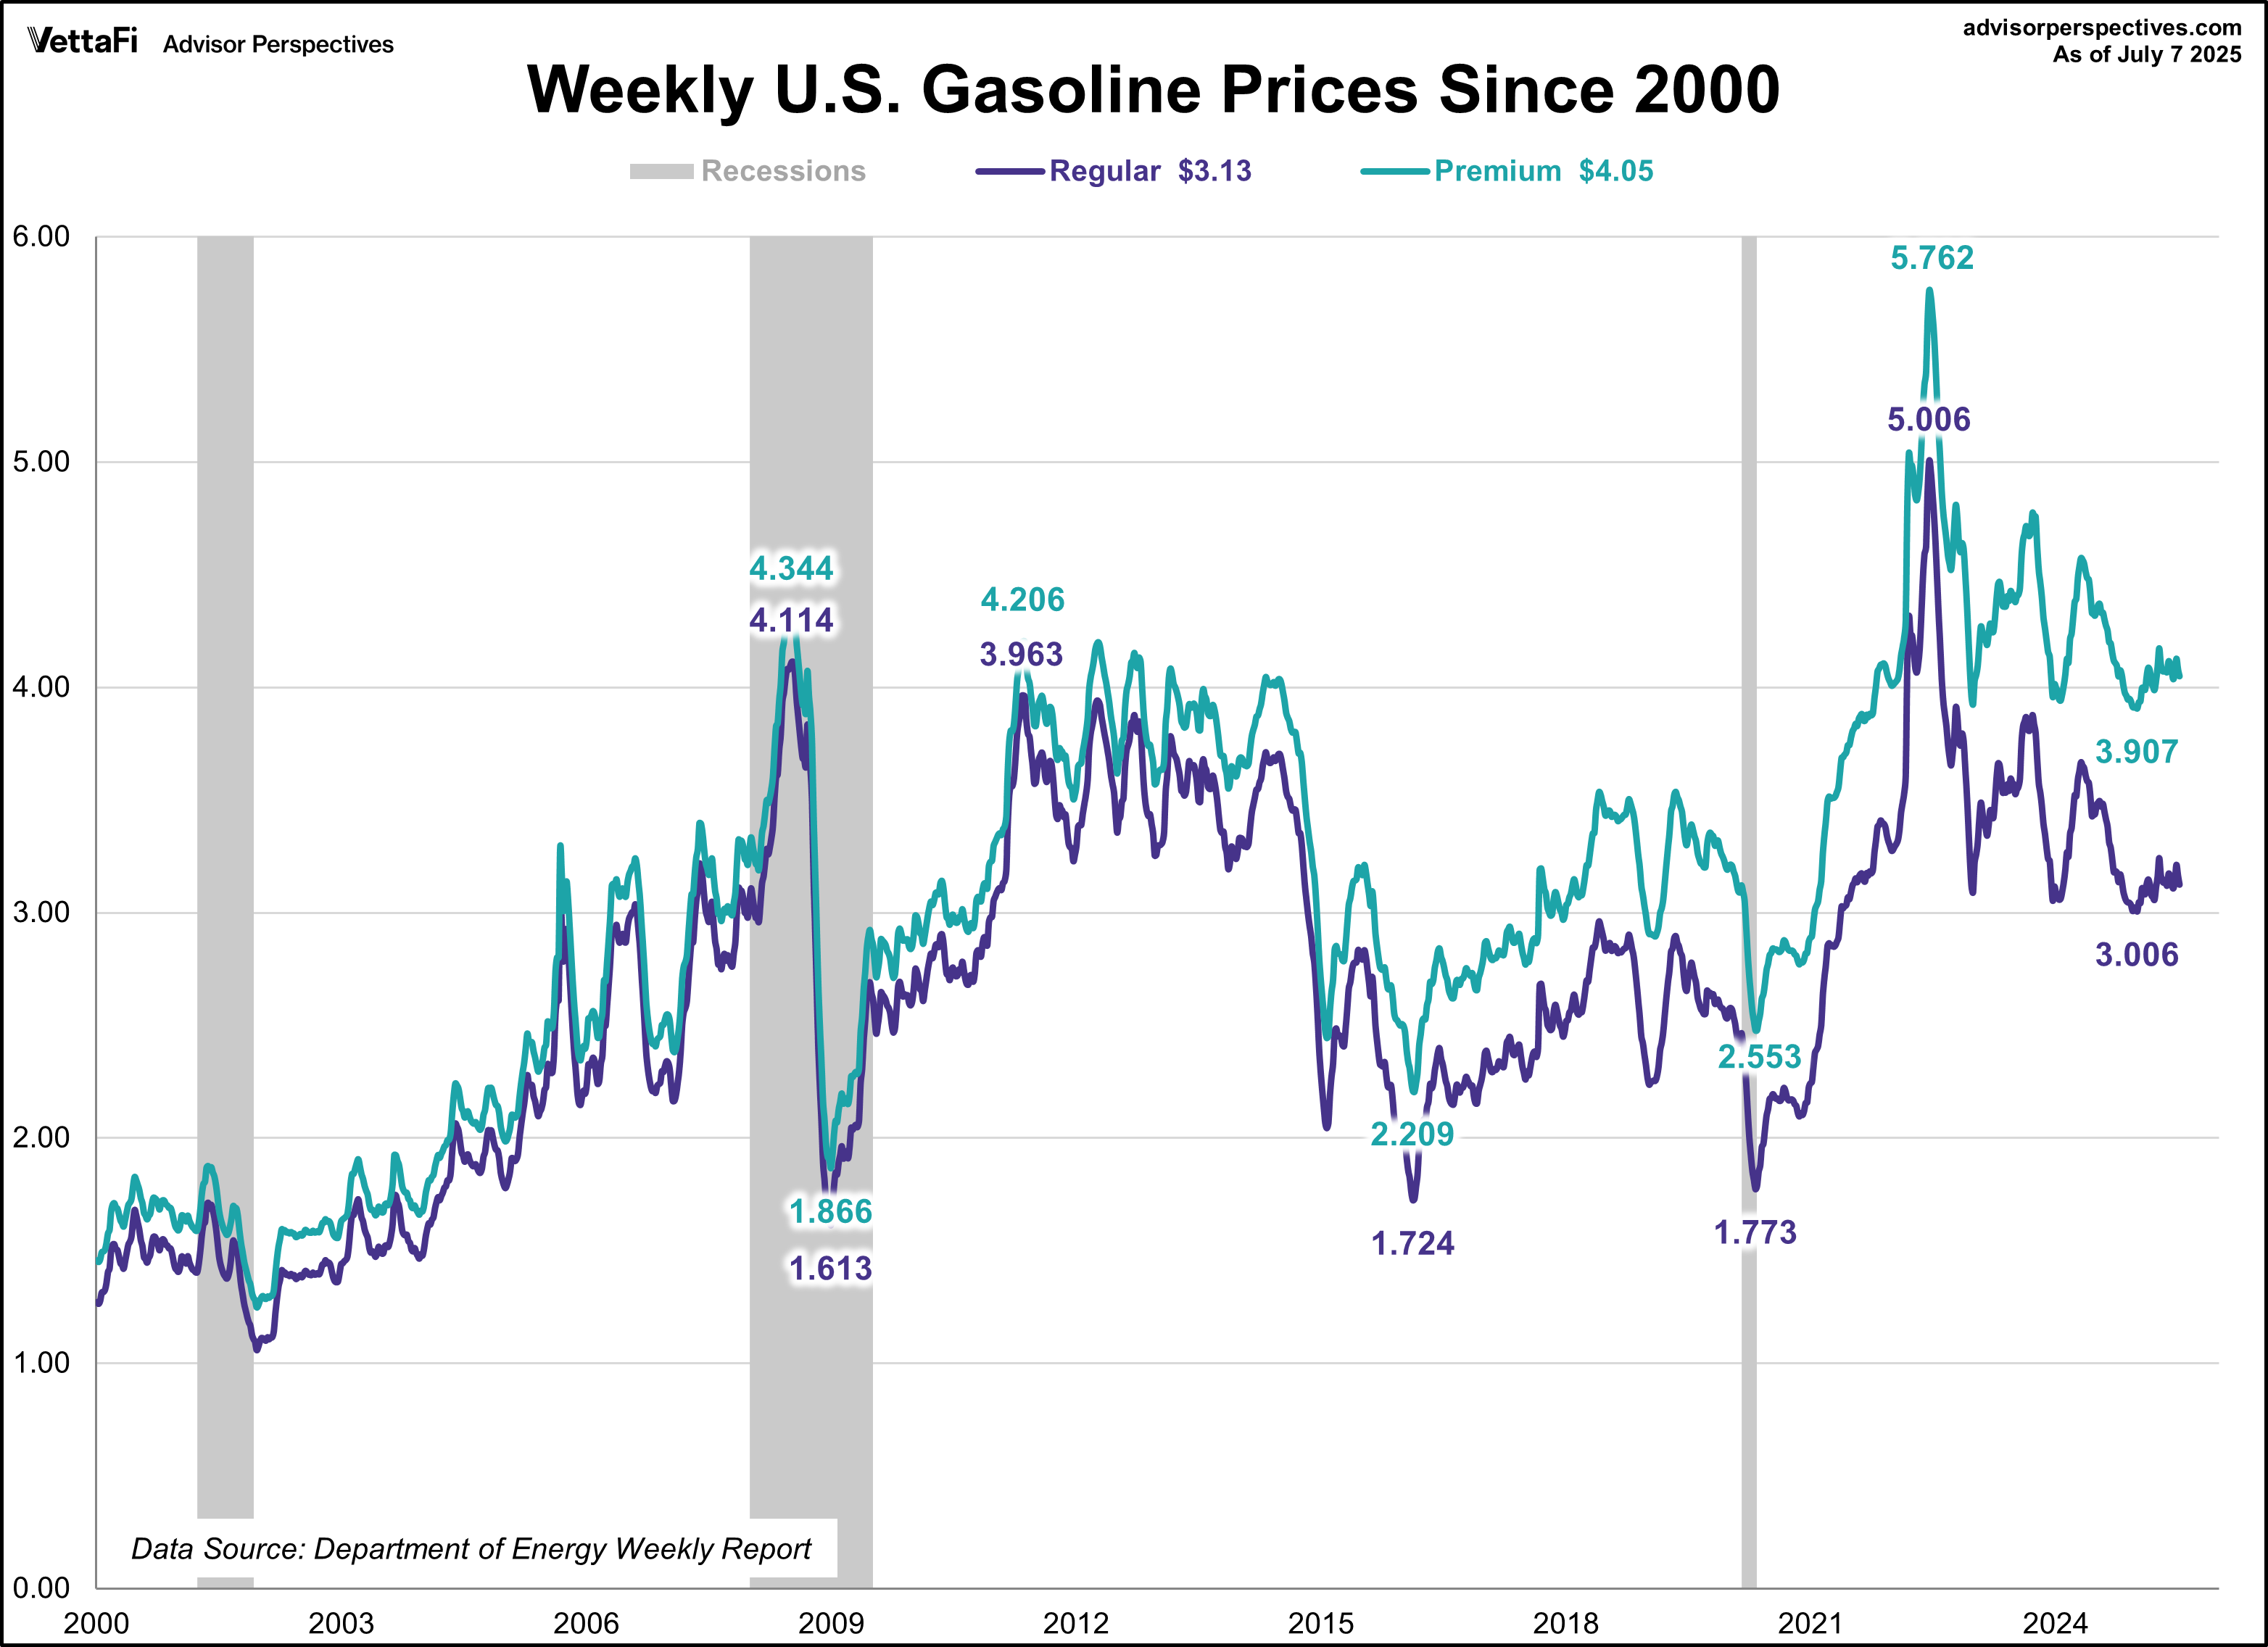
A weekly update that shows the price of gas in nominal and real terms since the turn of the century. As of the end of June, regular gasoline was up 12 cents and premium gasoline was up 15 cents from their prices at the beginning of the year.
-
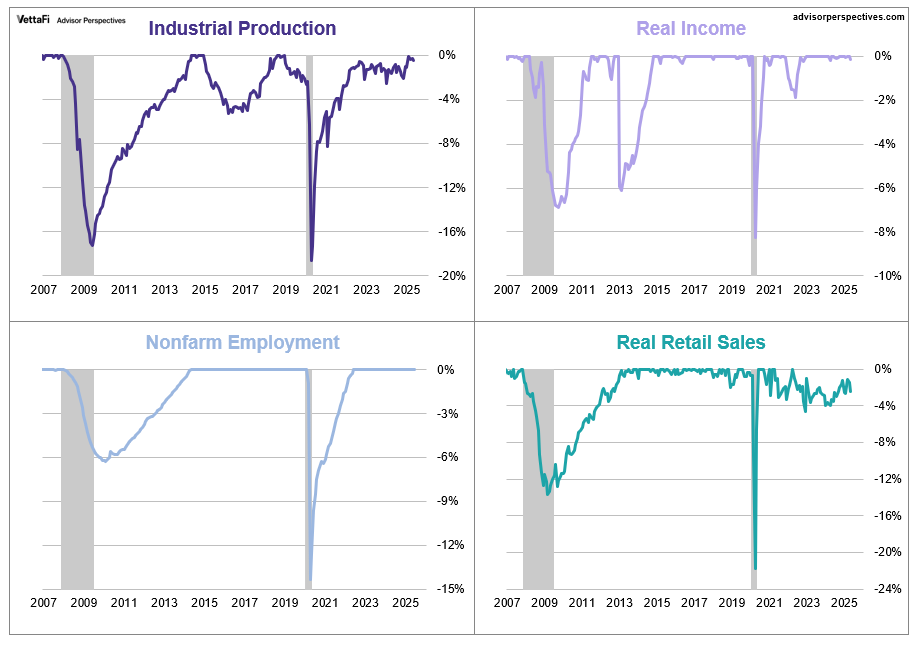
An analysis of four economic indicators (employment, industrial production, real retail sales, and real personal income) that the NBER Business Cycle Dating Committee weighs heavily when making official recession calls. The latest average of the percent off high of the four big indicators was 0.77% off a new high.
-
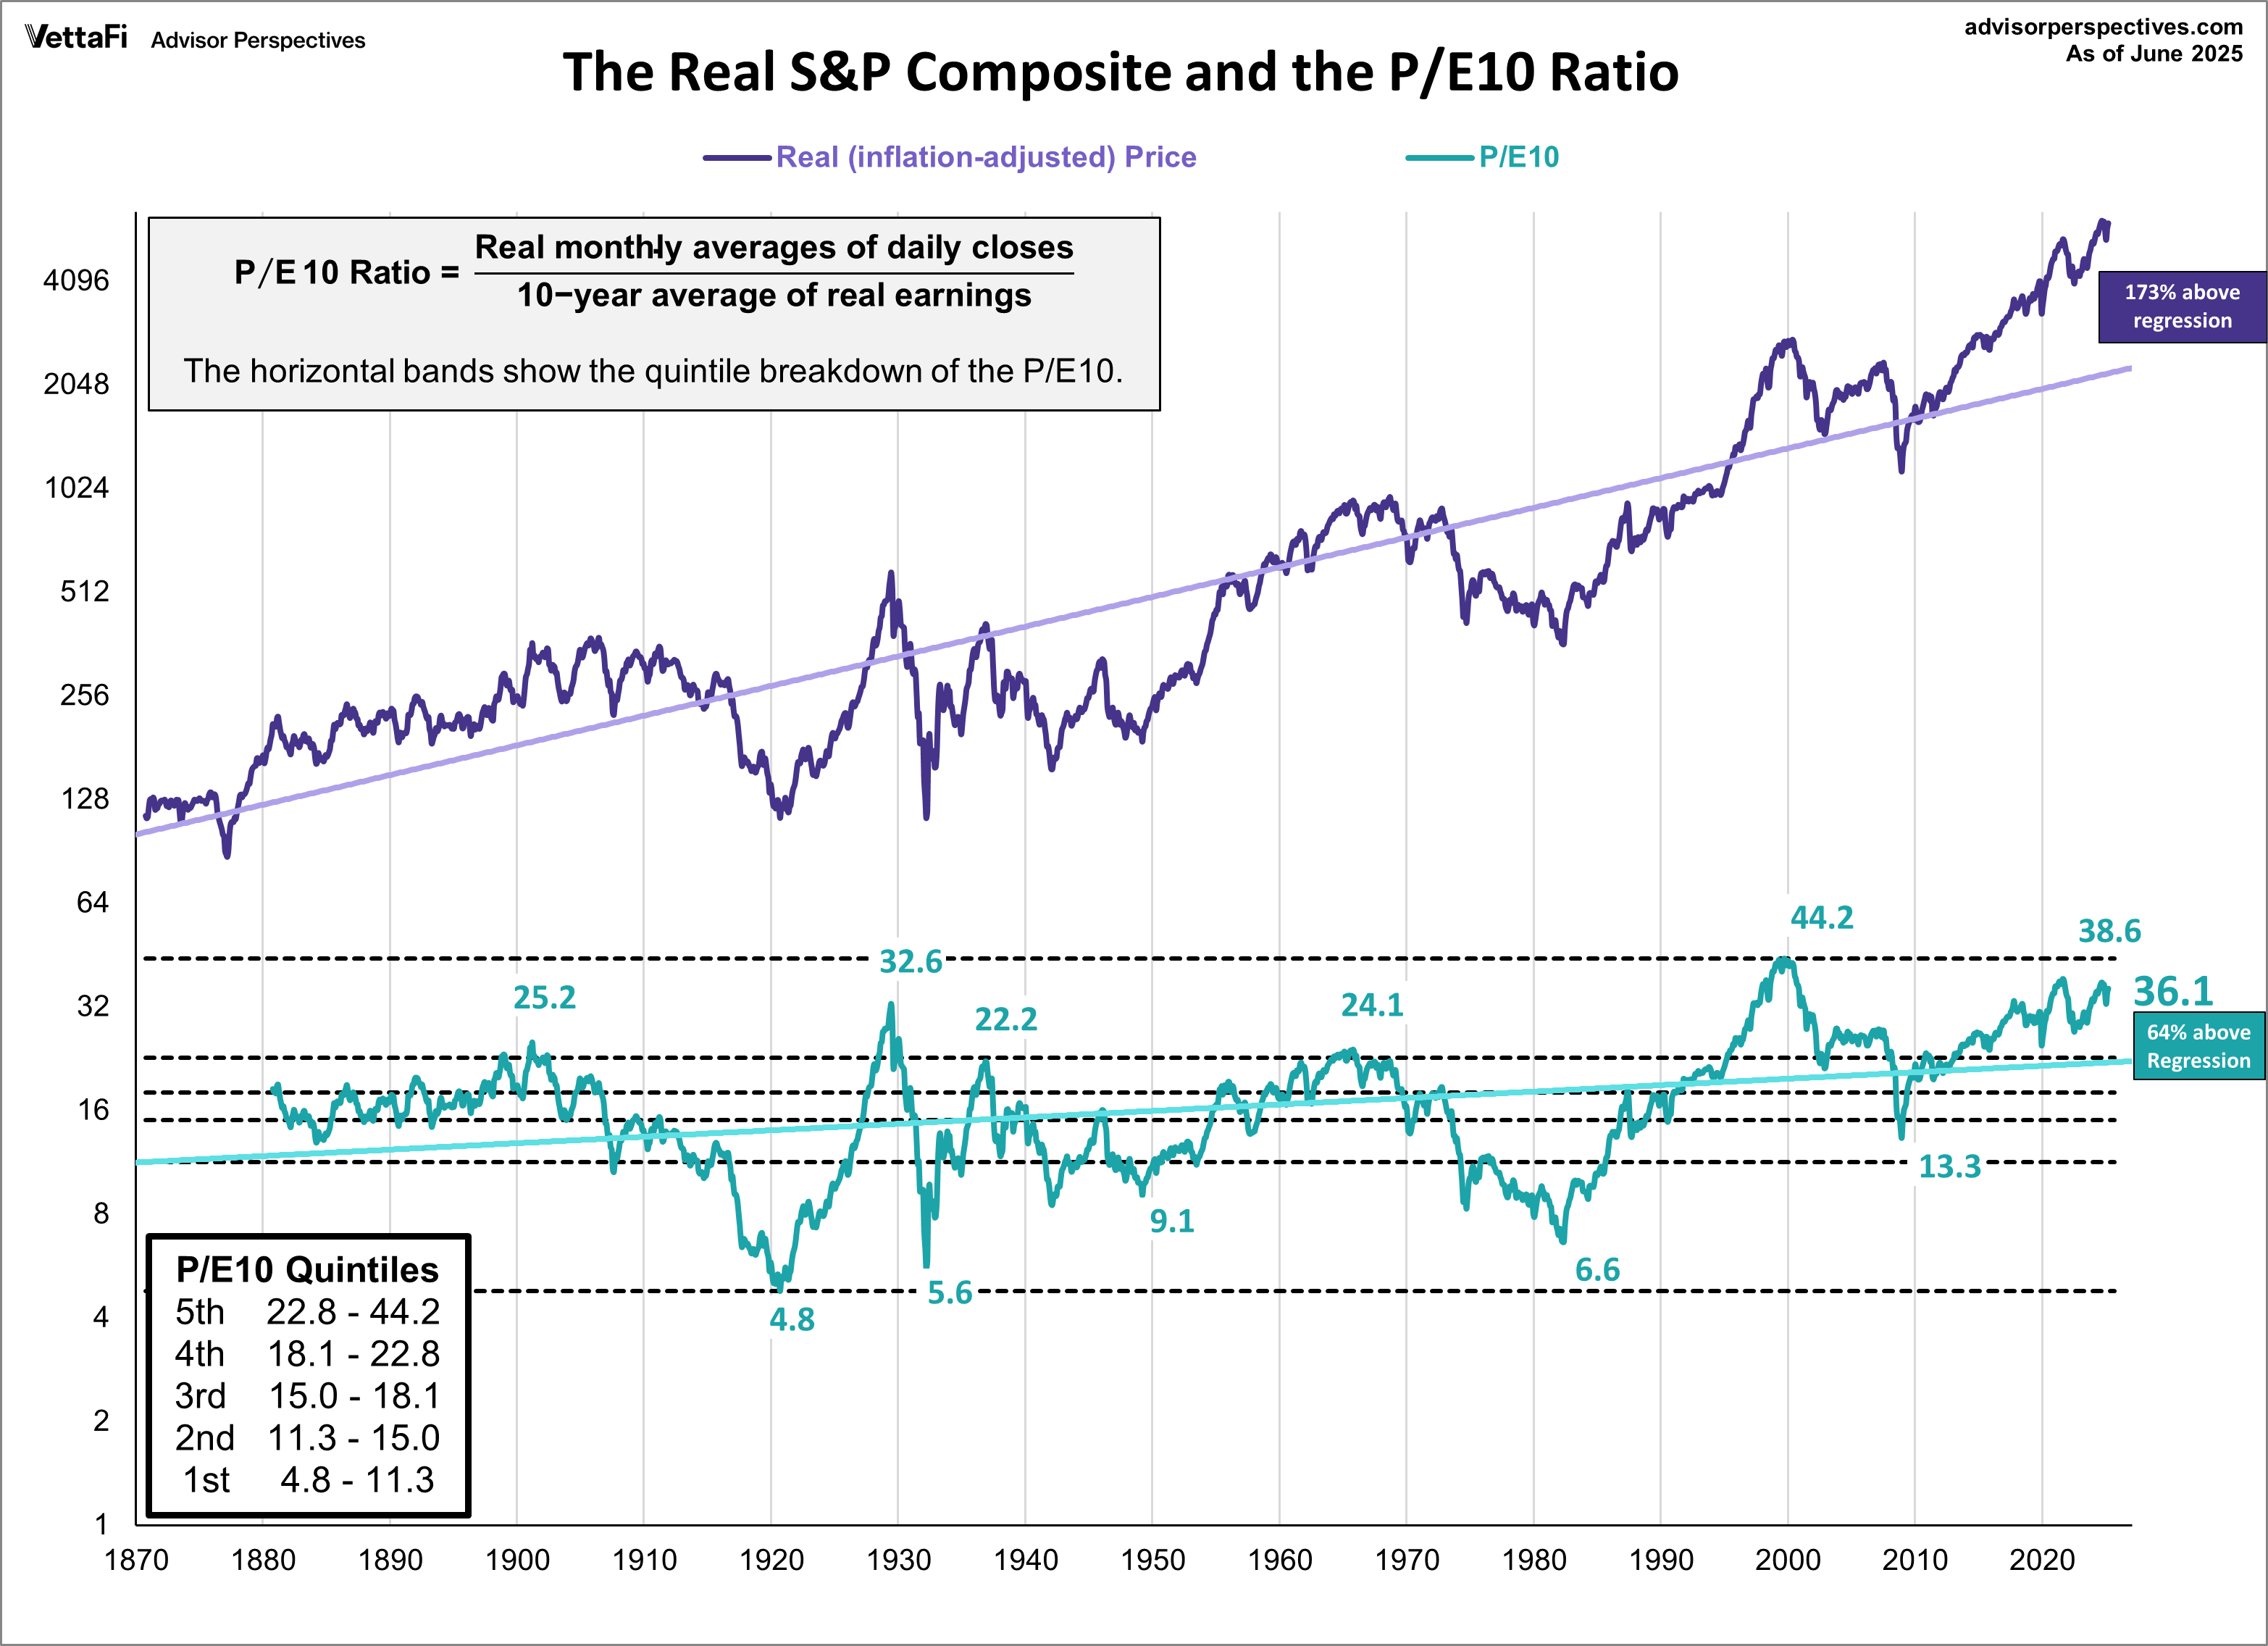
A long-term valuation indicator calculated by dividing the current S&P 500 price by the average inflation-adjusted earnings over the past 10 years. At the end of June, the P/E 10 Ratio was at 36.1, signaling a highly overvalued market.
-
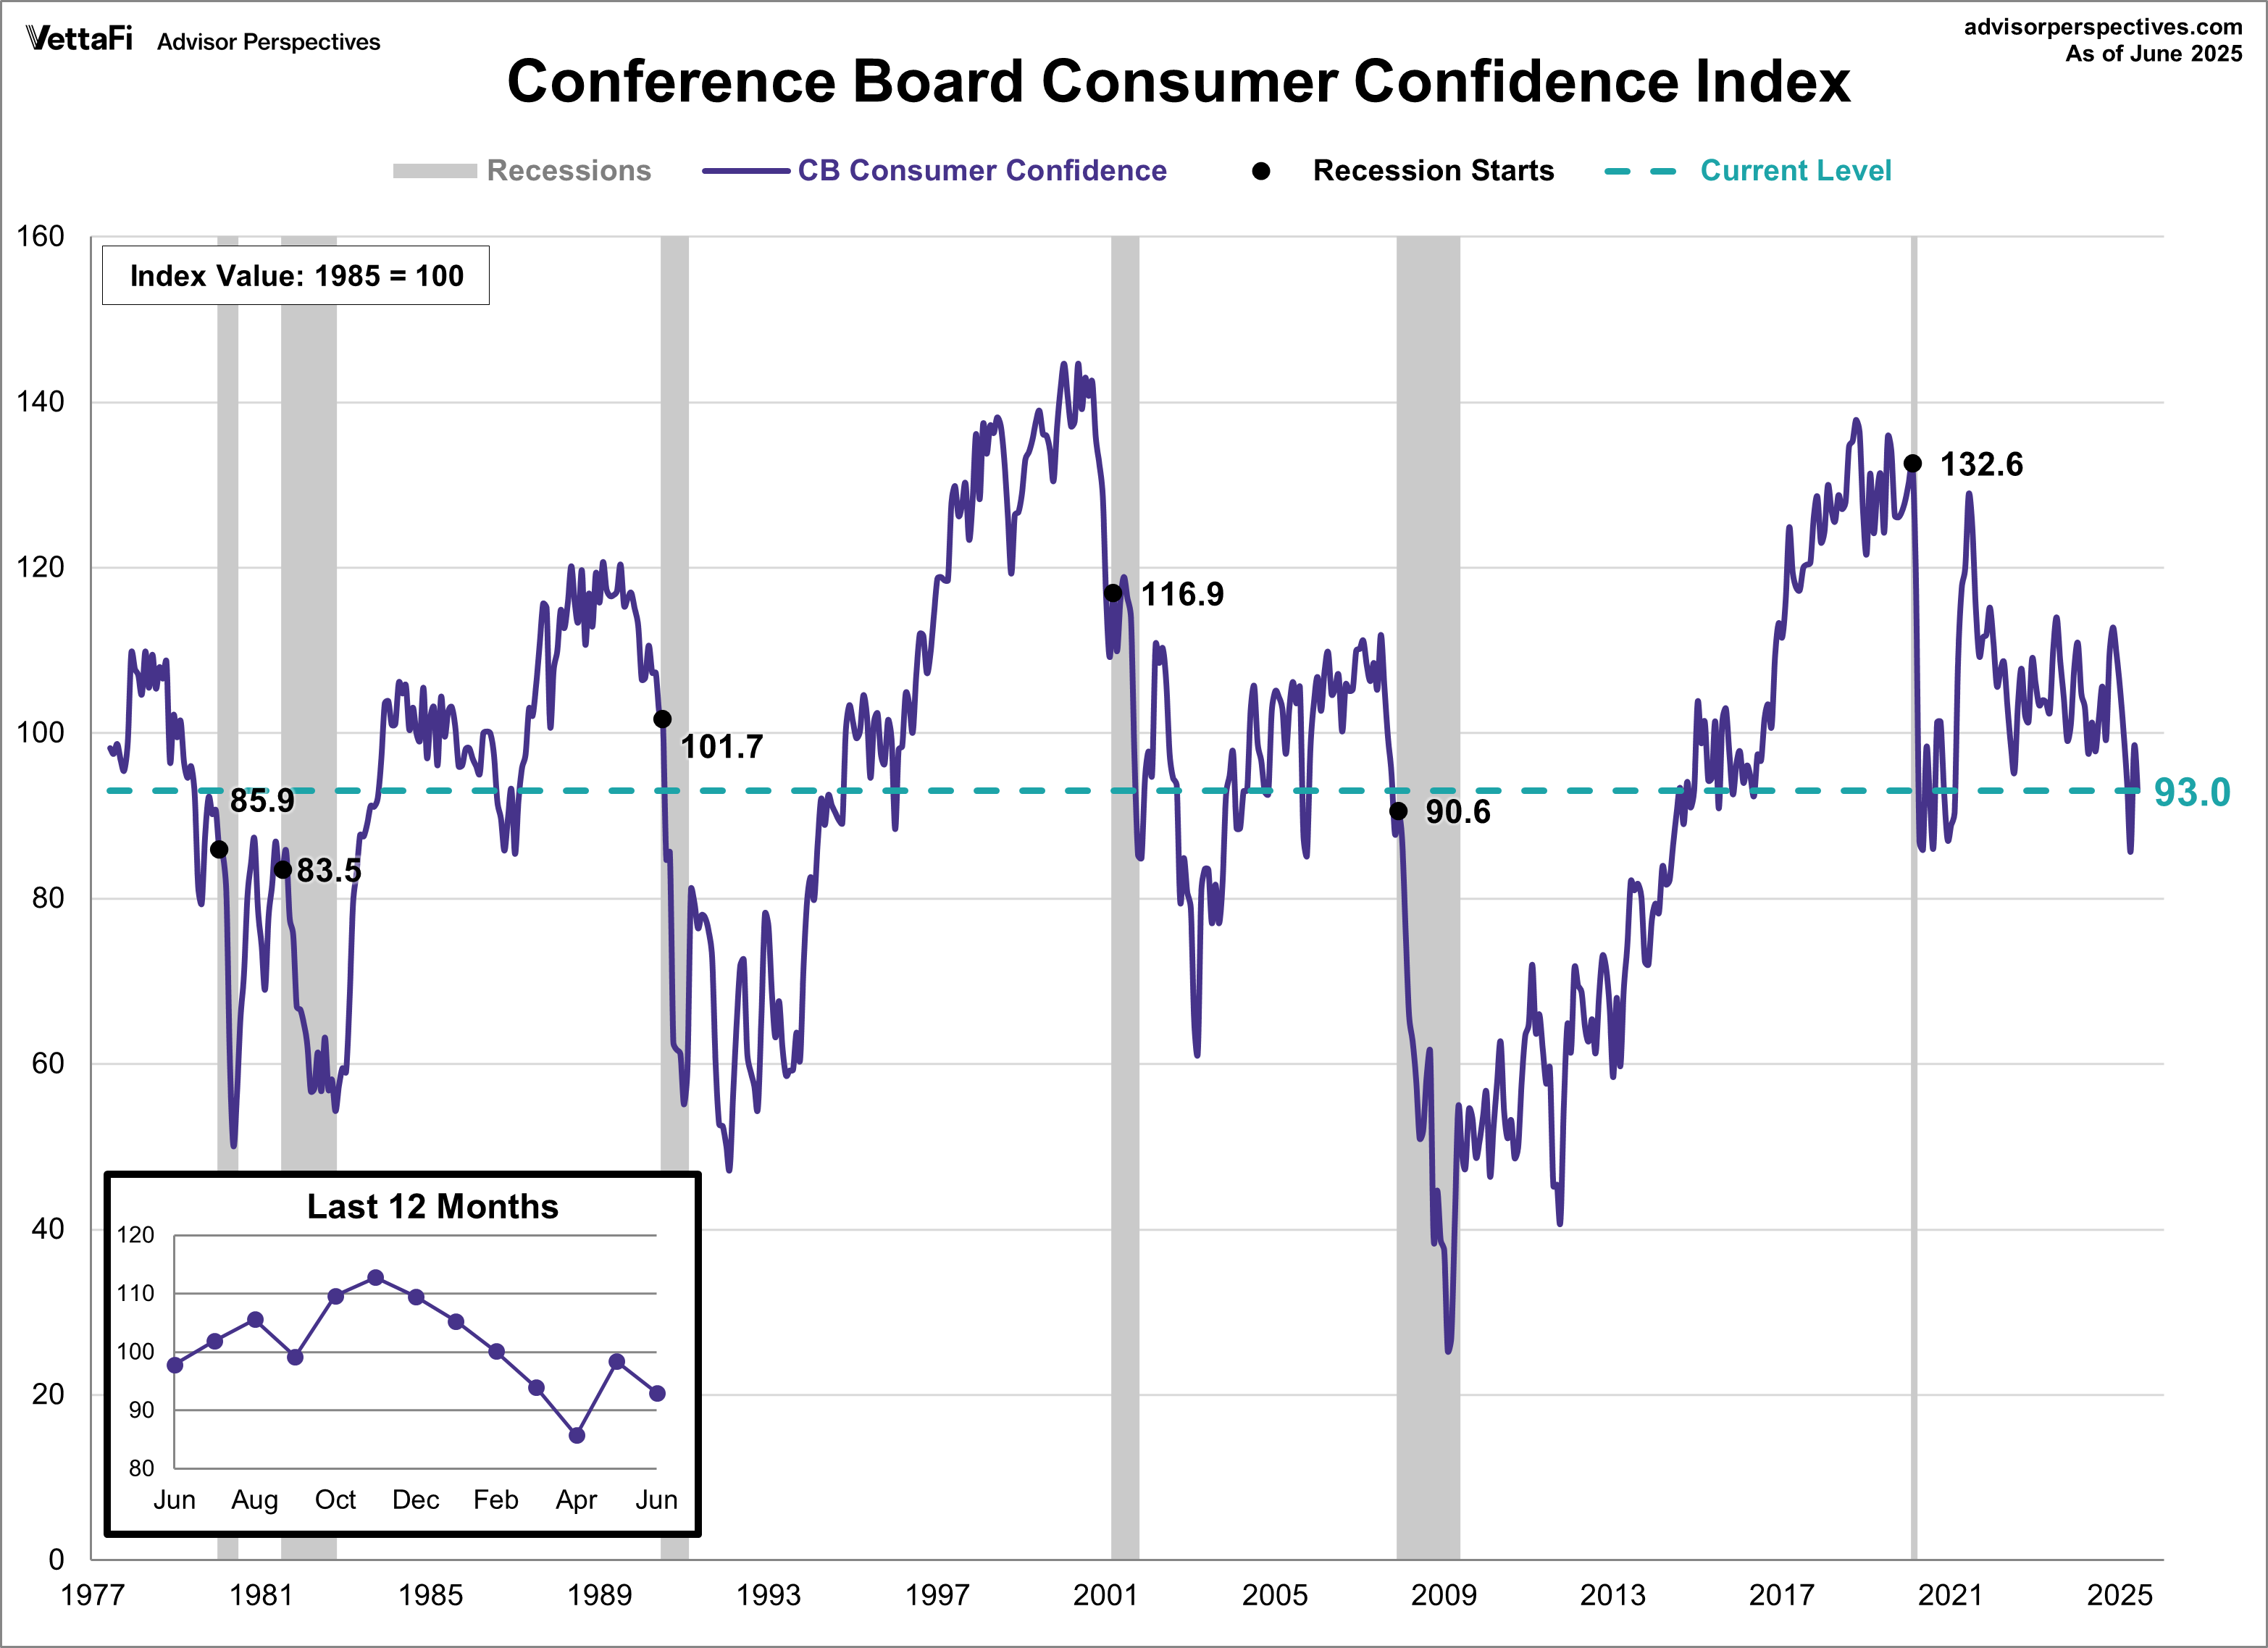
A monthly survey of consumer attitudes regarding present and future perceptions of the economy, business conditions, and the labor market. The index declined for most of the first half, finishing June at one of its lowest levels in history (93.0).
ETFs associated with the S&P 500 include: iShares Core S&P 500 ETF (IVV), SPDR S&P 500 ETF Trust (SPY), Vanguard S&P 500 ETF (VOO), SPDR Portfolio S&P 500 ETF (SPLG), and Invesco S&P 500 Equal Weight ETF (RSP).
Read more updates by Jen Nash