Now that 2025 has come to an end, let’s take a look at the top 10 most-read charts of the year. From market updates and valuations to consumer attitudes and gas prices, these charts have provided crucial insights into the economic landscape that shaped the last twelve months.
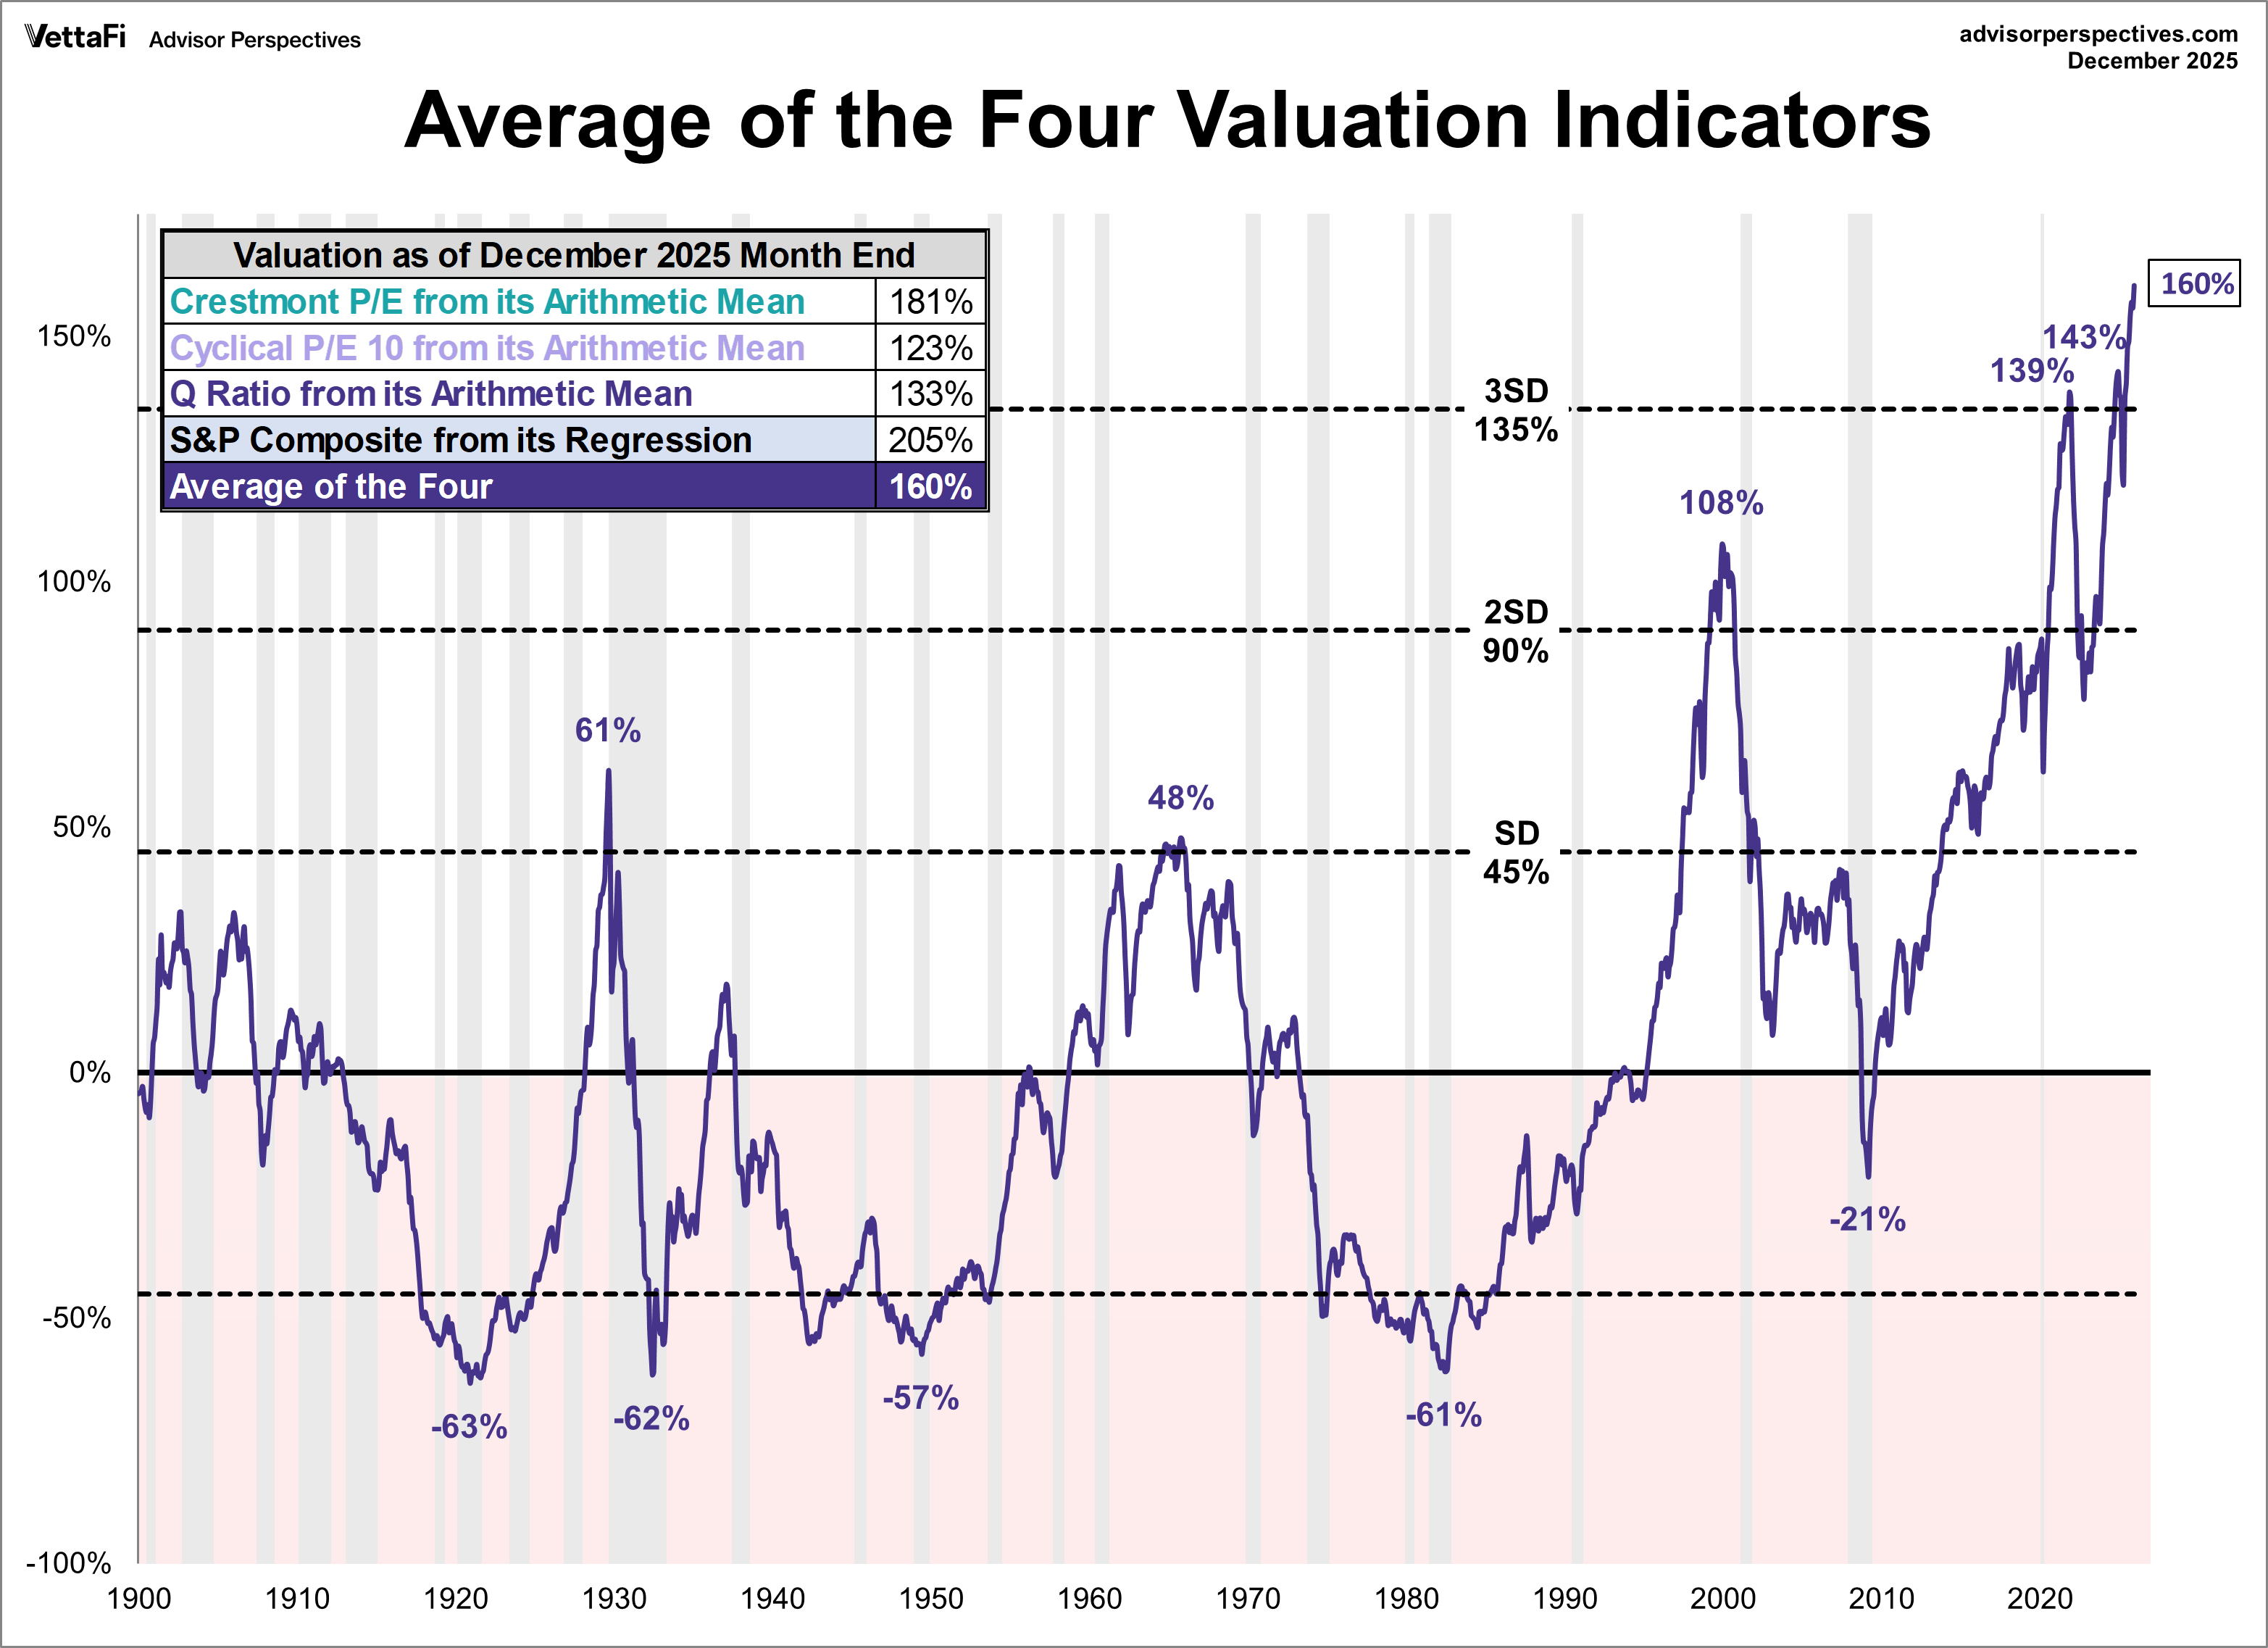
1. Market Valuation Overview
A comparative analysis of four valuation indicators (Regression to Trend, Crestmont P/E, Q-Ratio, and P/E 10). Based on December’s S&P 500 monthly data, the market is OVERVALUED somewhere in the range of 123% to 205%, depending on the indicator.
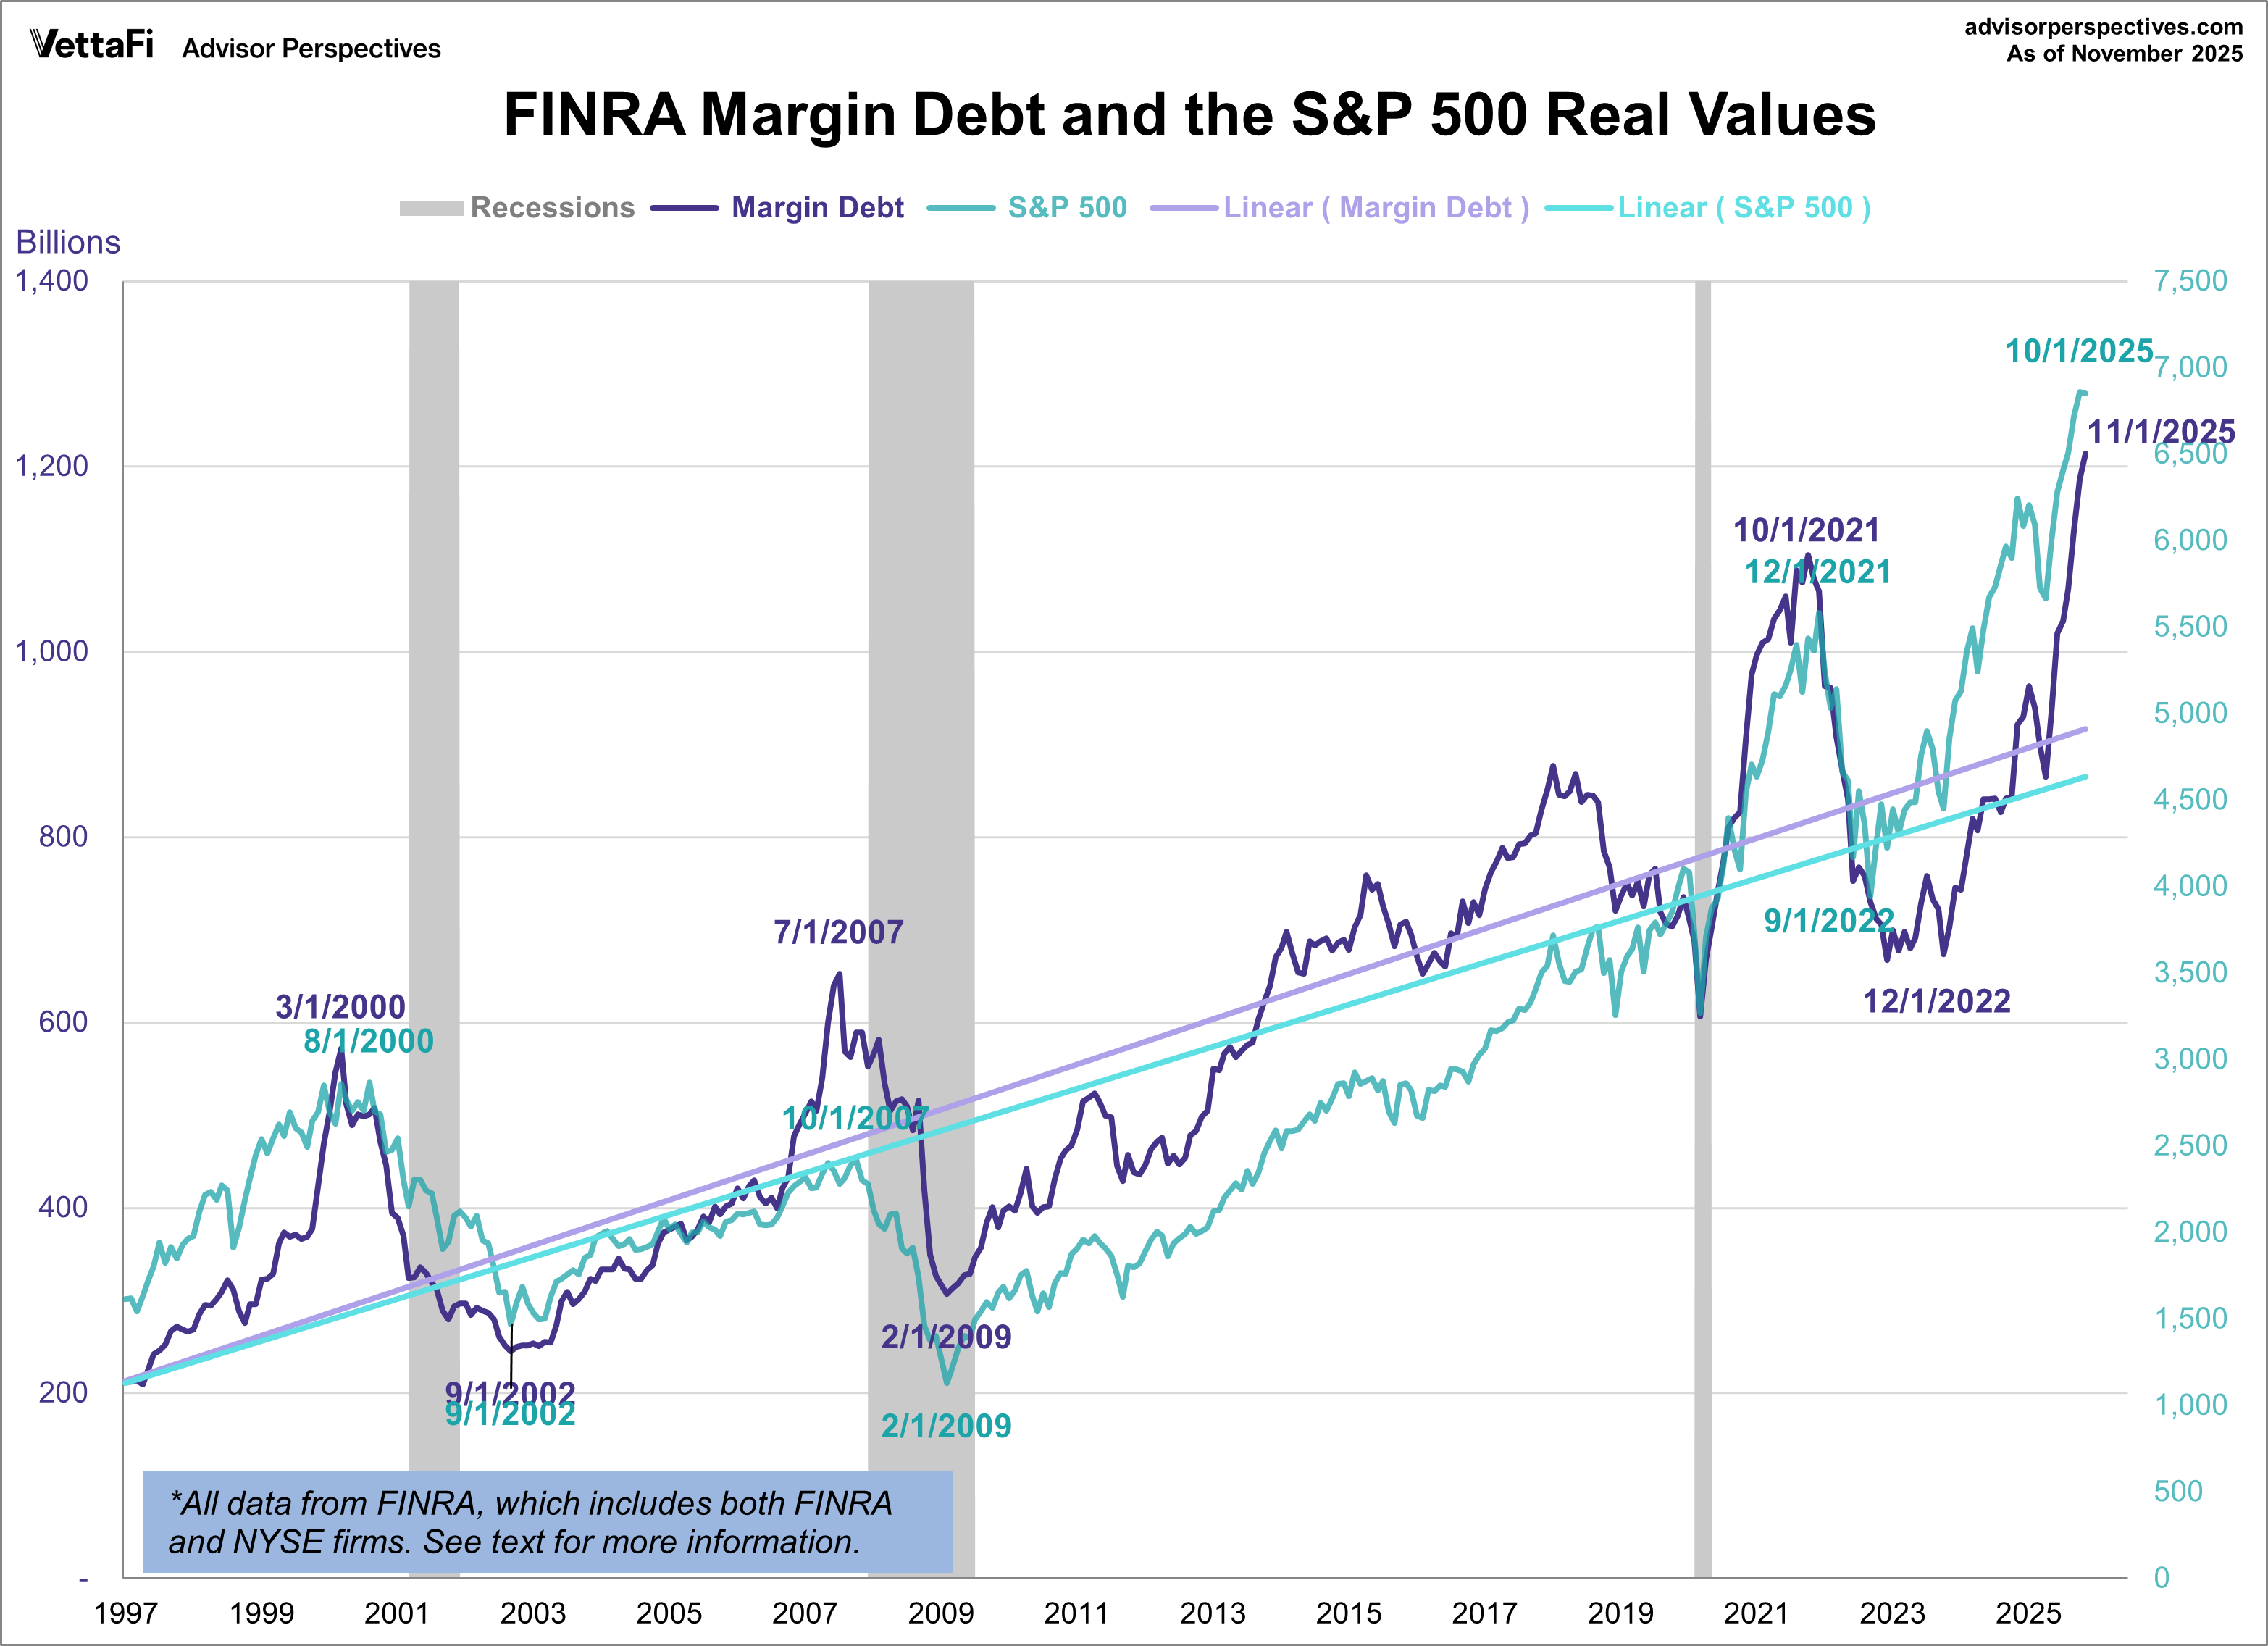
 2. Margin Debt
A depiction of the money investors borrowed from brokers via margin accounts. Margin debt continued to reach new heights at the end of the year, with the debt level hitting a record high of $1.21 trillion in November.
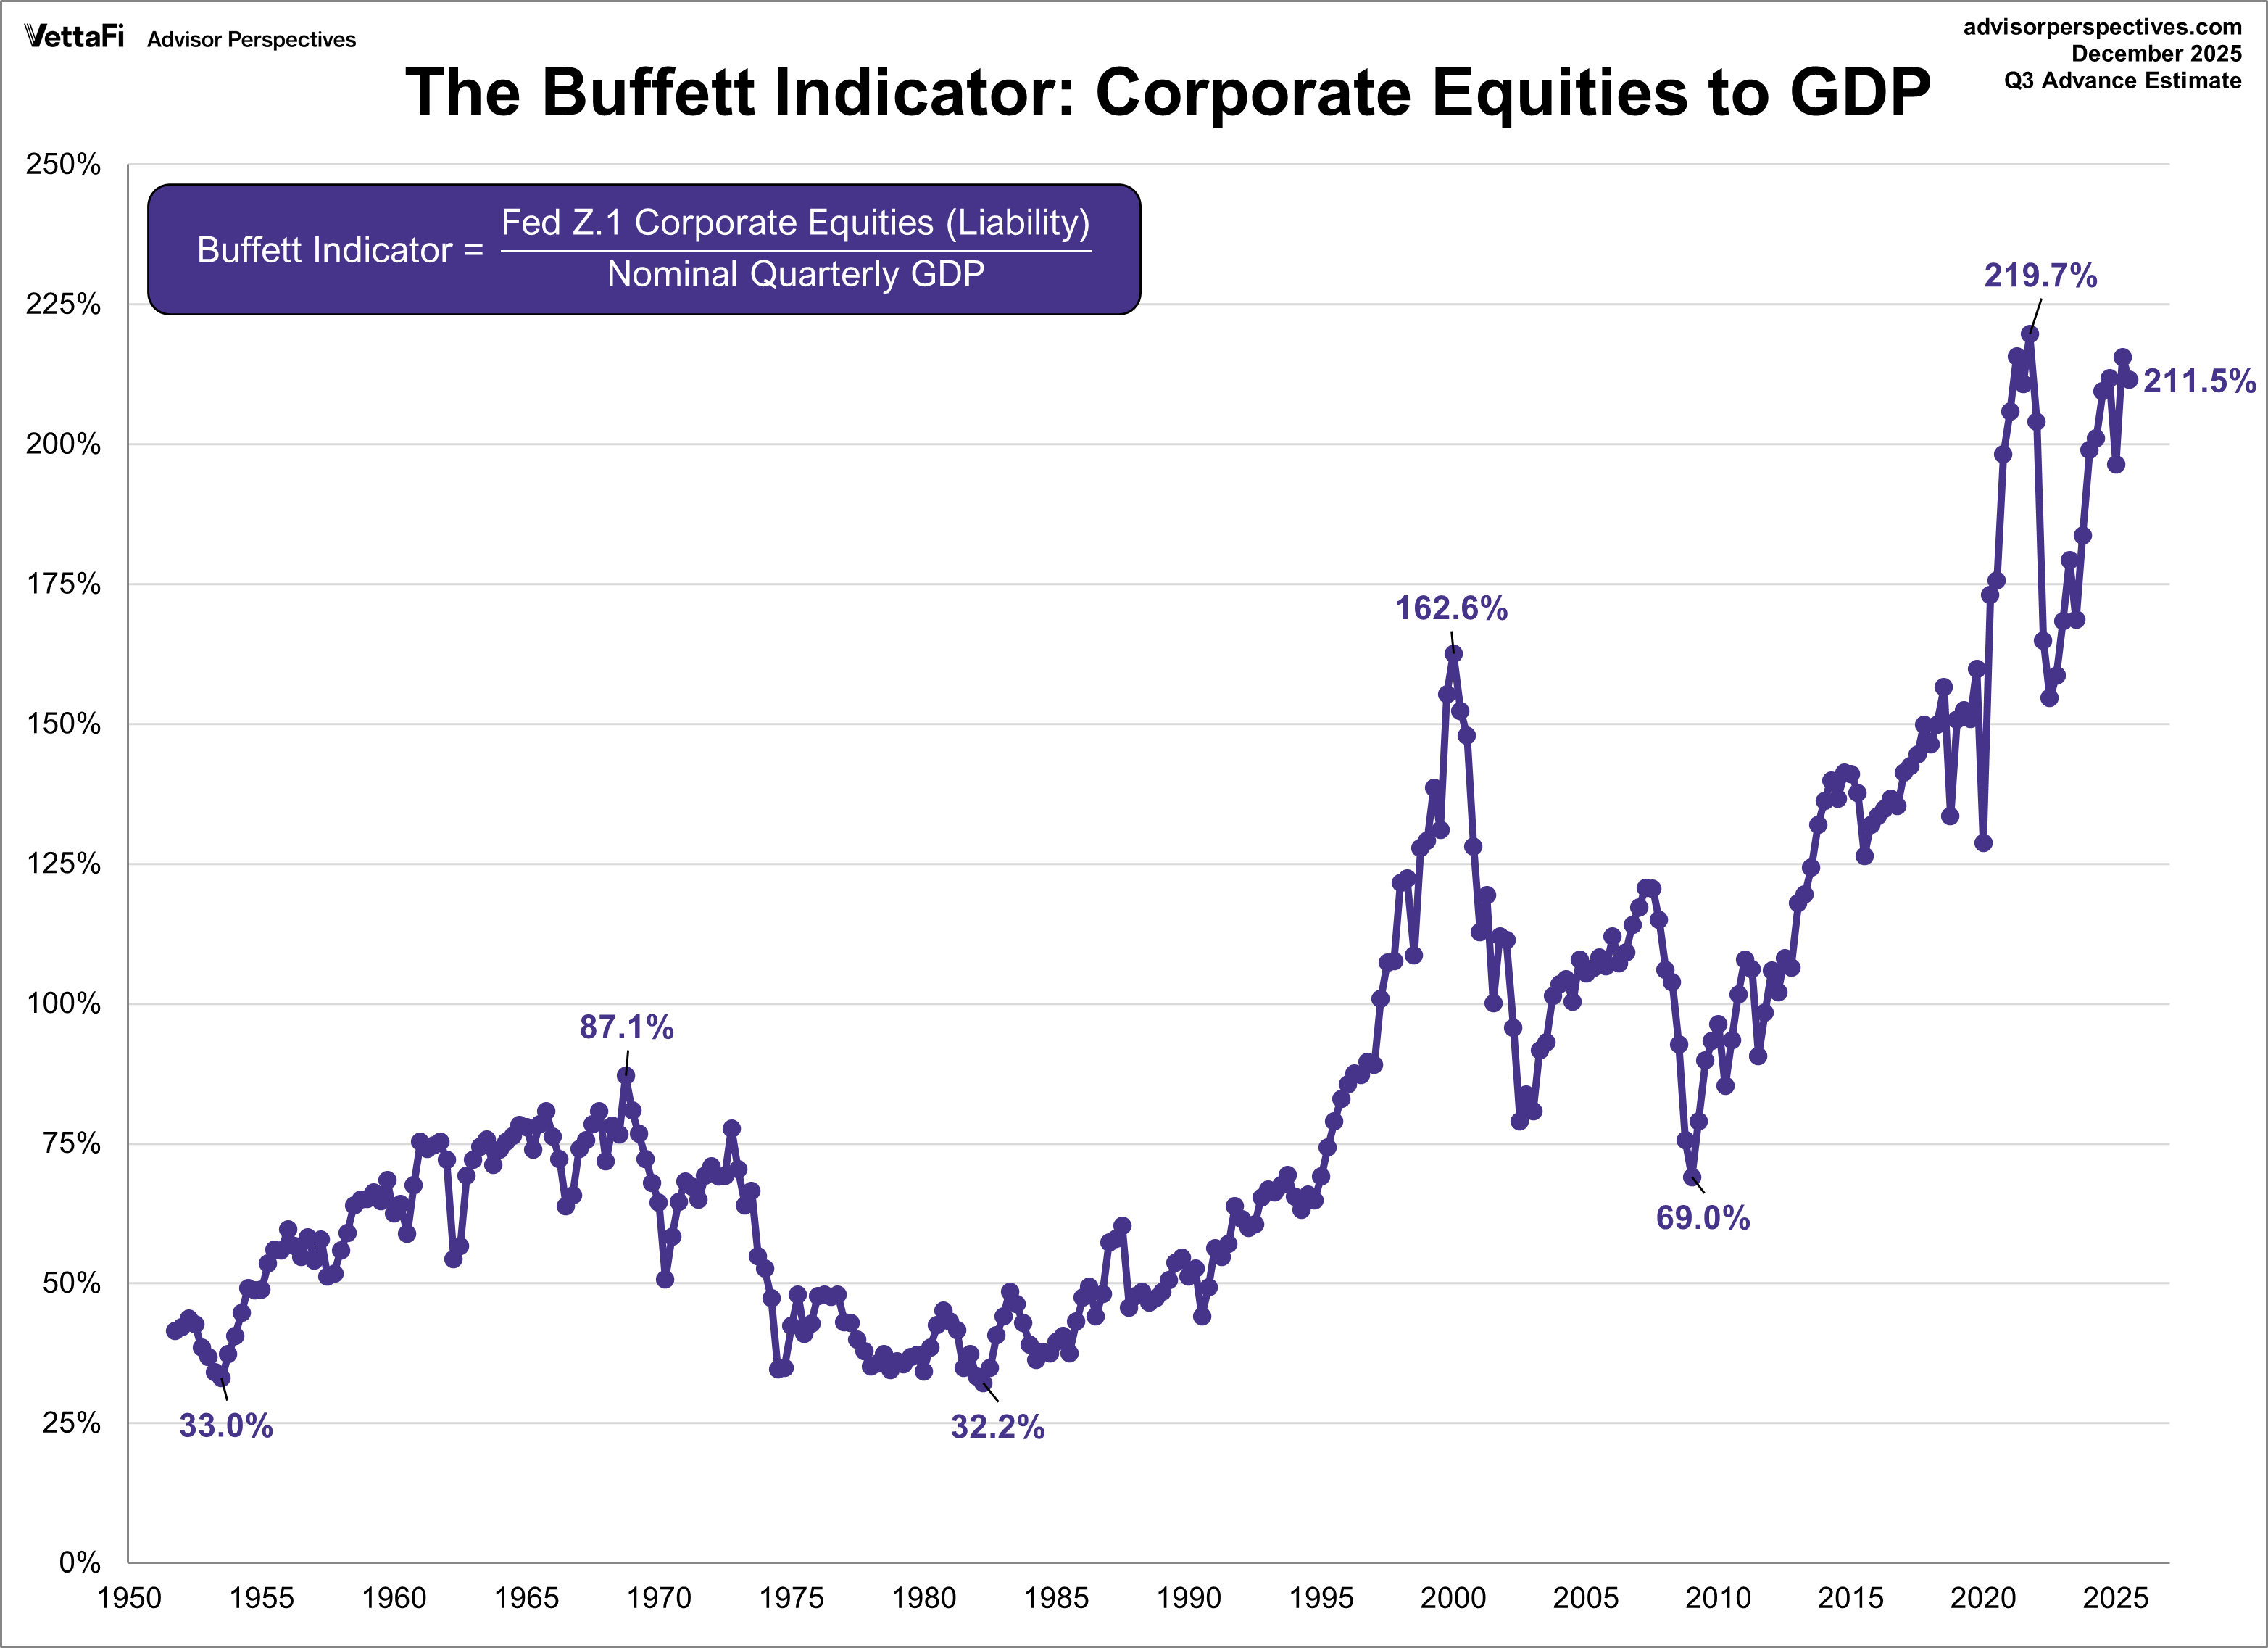
3. Buffett Valuation Indicator
A long-term valuation metric comparing the total market value of publicly traded stocks to the country’s GDP. Using the Q3 GDP advance estimate, latest reading is 211.5%, one of the highest levels on record. Thus, the indicator is signaling an OVERVALUED market.
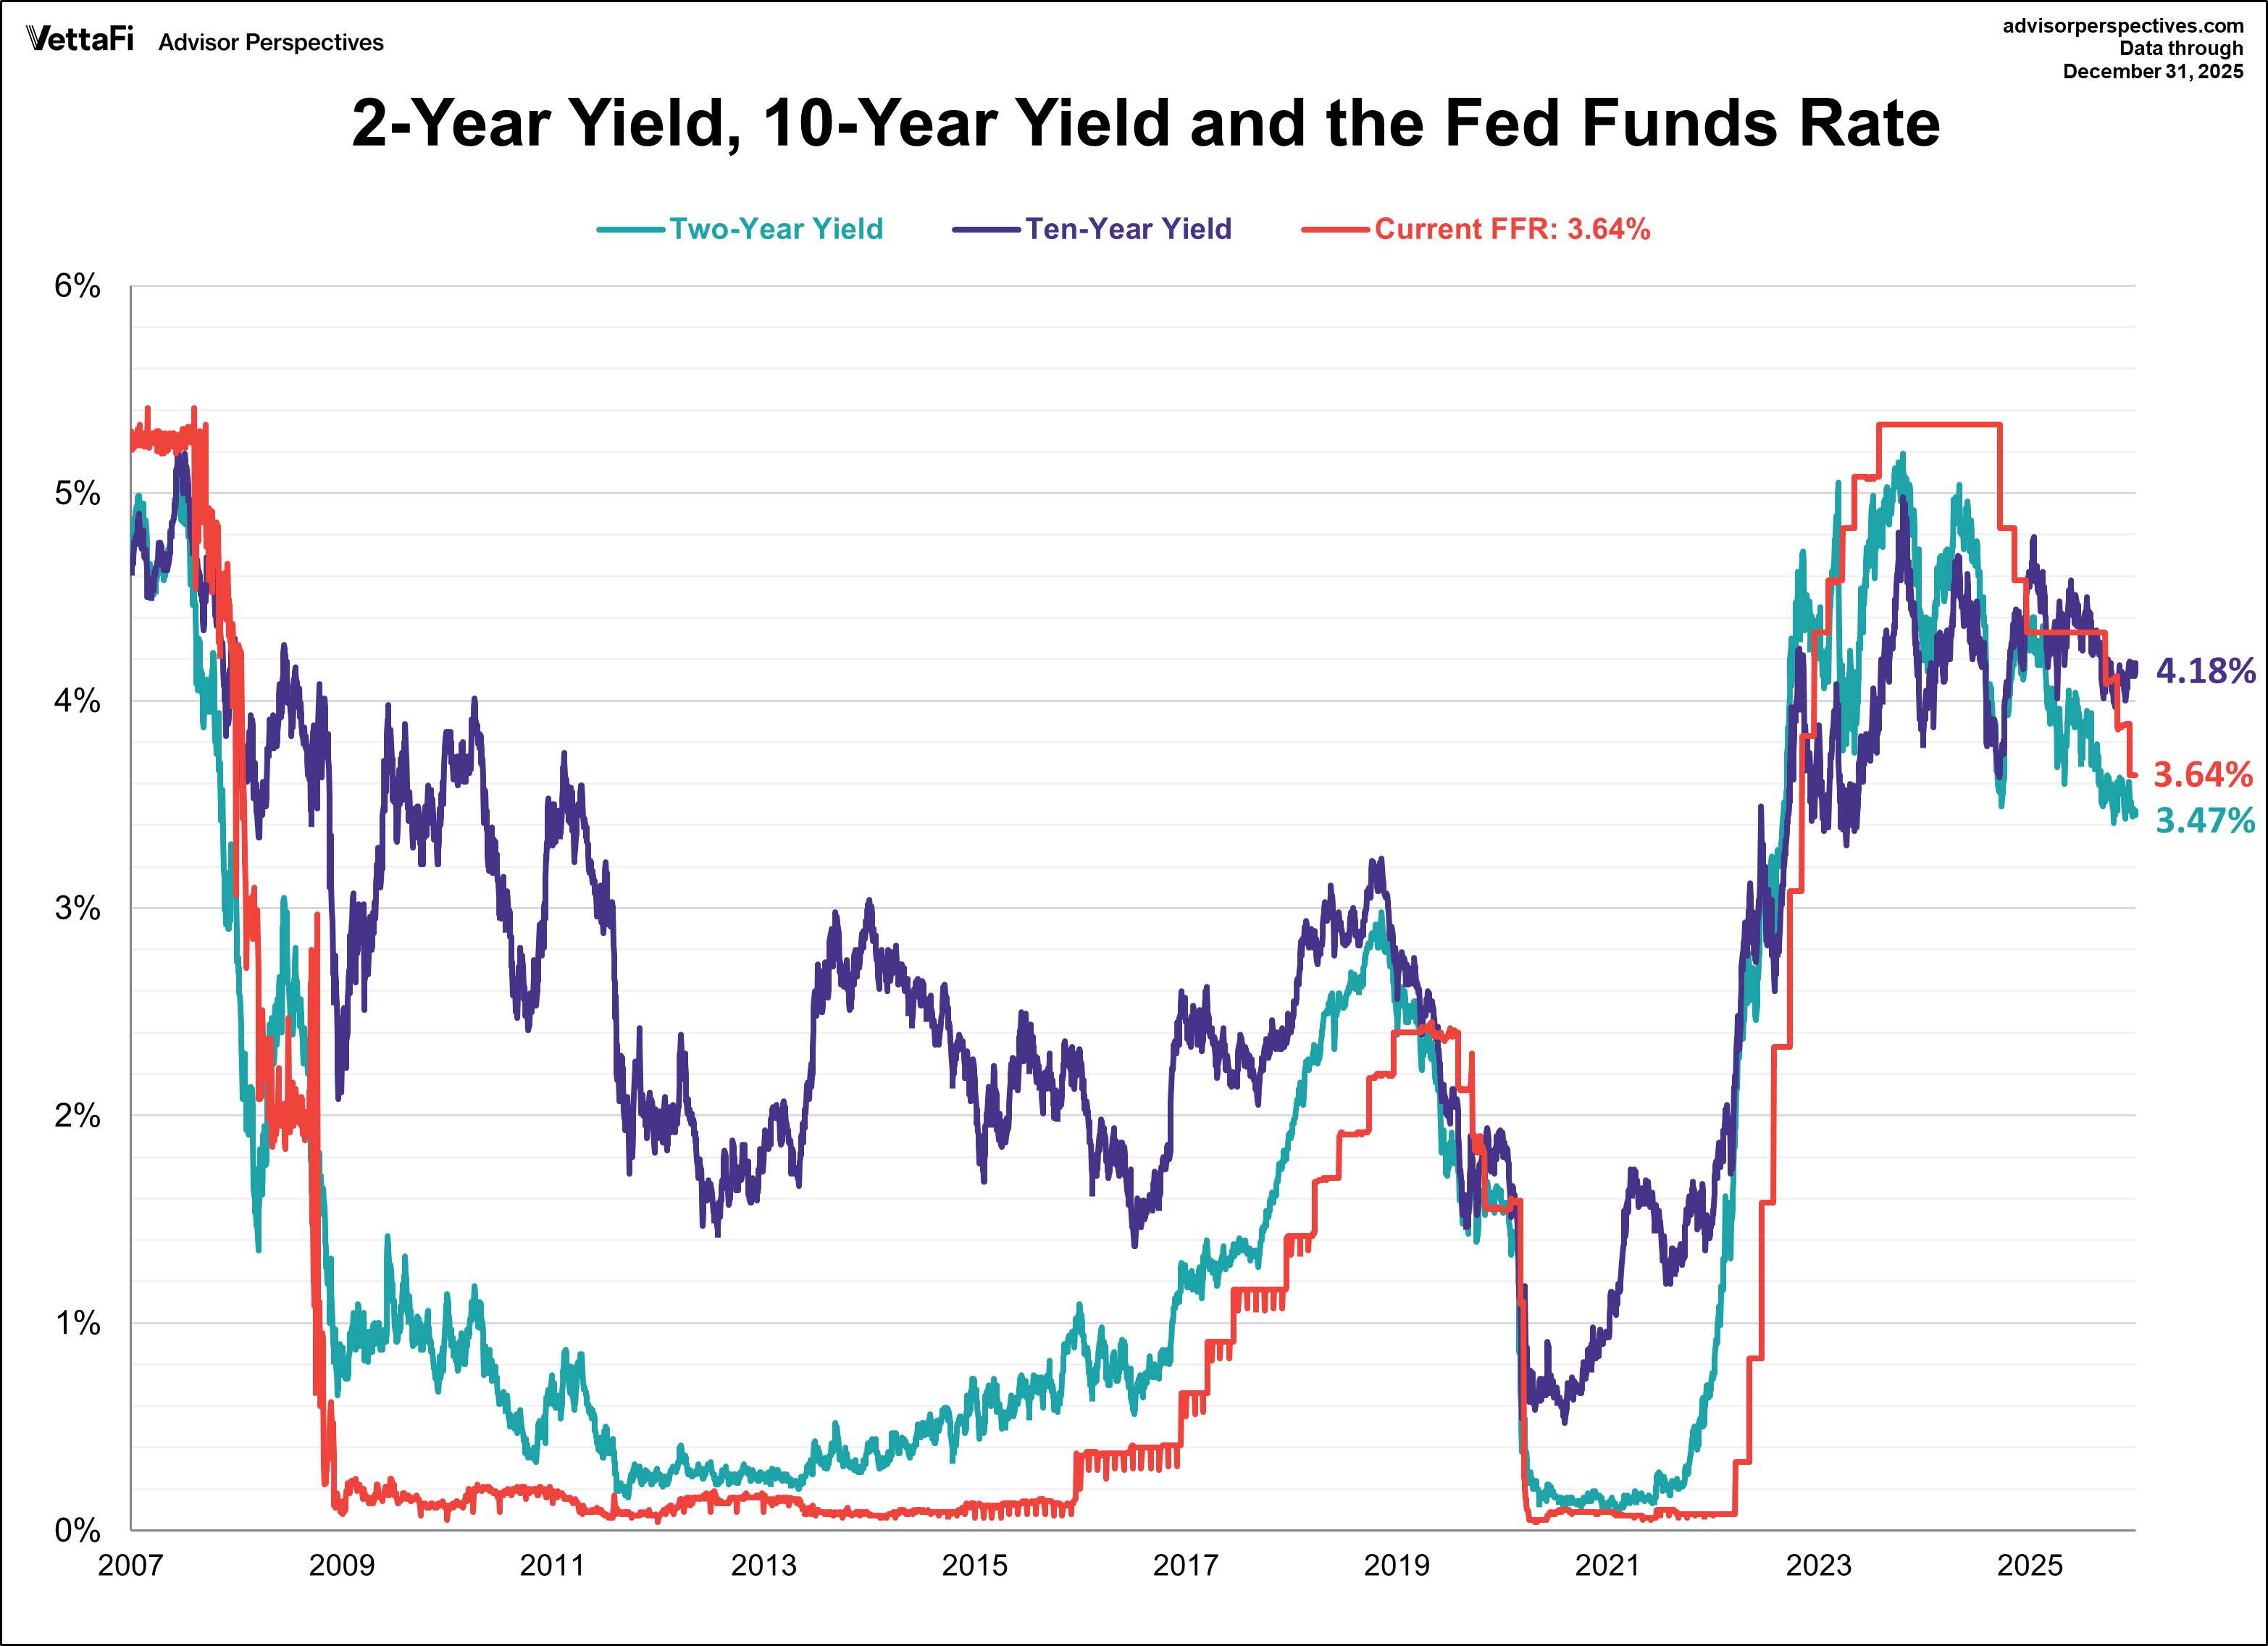
4. Treasury Yields Snapshot
A weekly update that highlights the performance of several Treasury bonds. The yield on the 10-year note ended the year at 4.18% while the yield on the 2-year not ended at 3.47%.
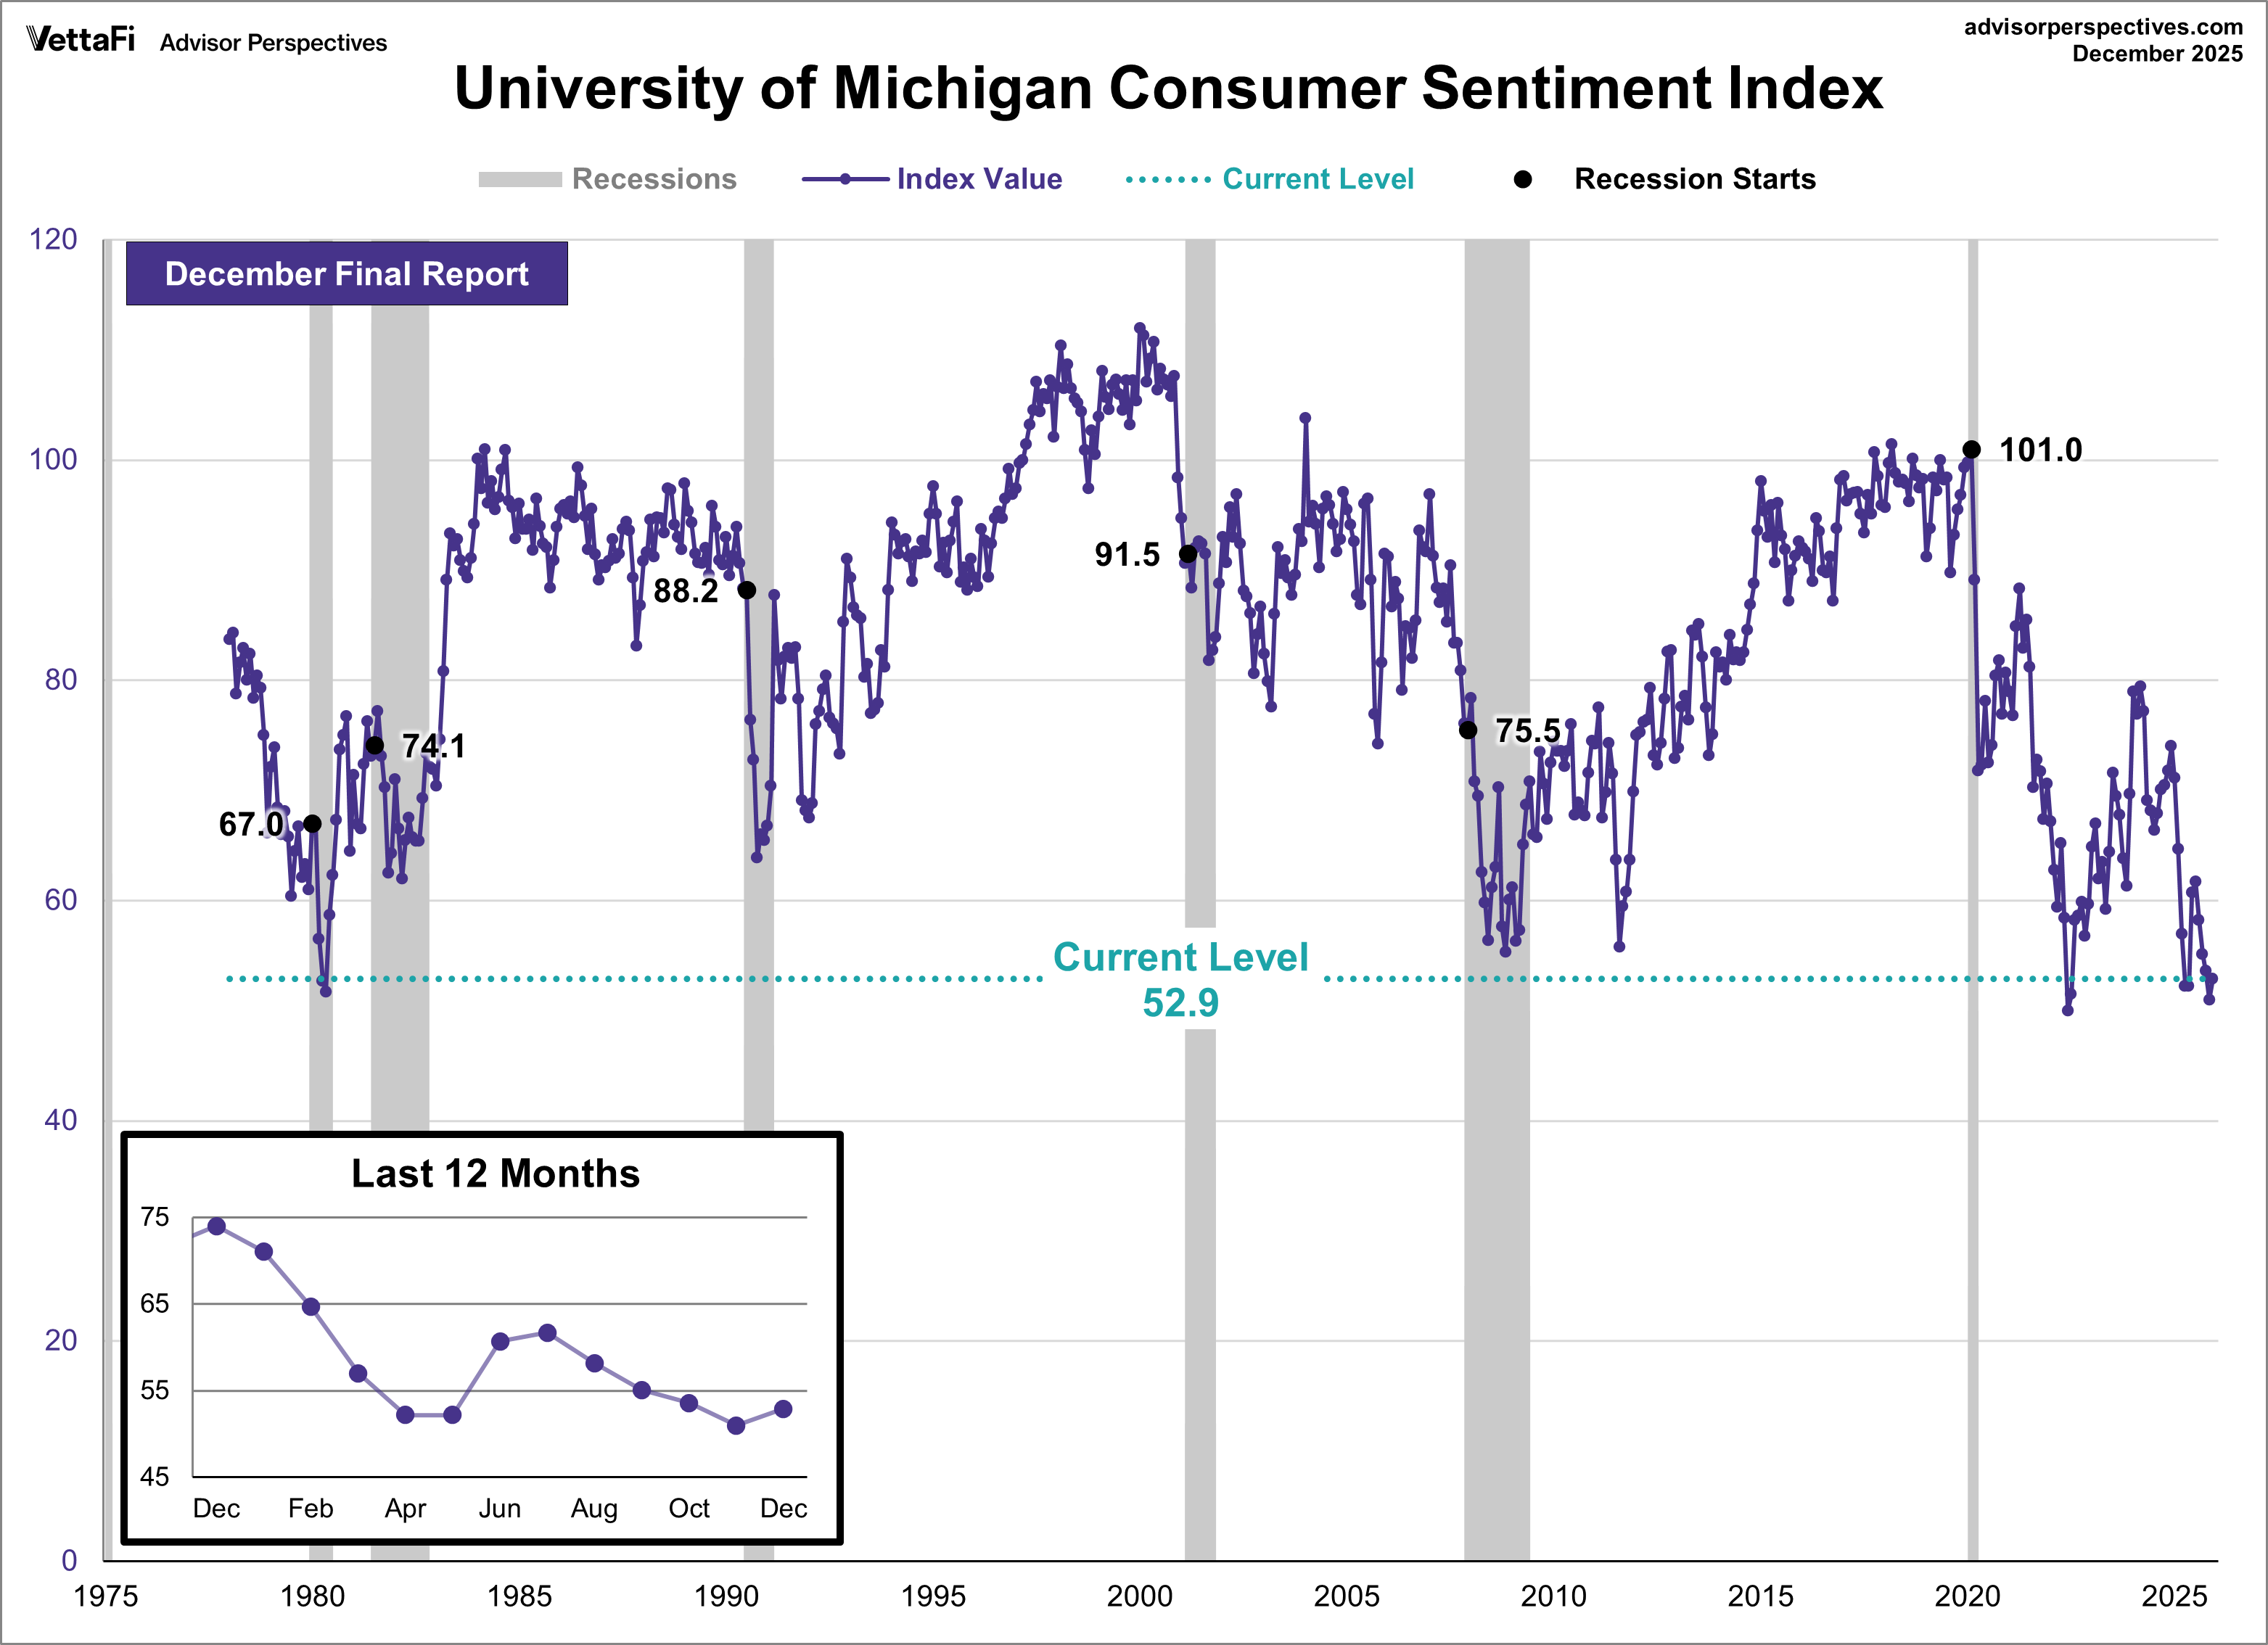
5. University of Michigan Consumer Sentiment Index
A monthly survey of consumer confidence levels with regards to the economy, personal finances, business conditions, and buying conditions. The index closed out the year by increasing for the first time in five months, inching up to 52.9 at the end of December.
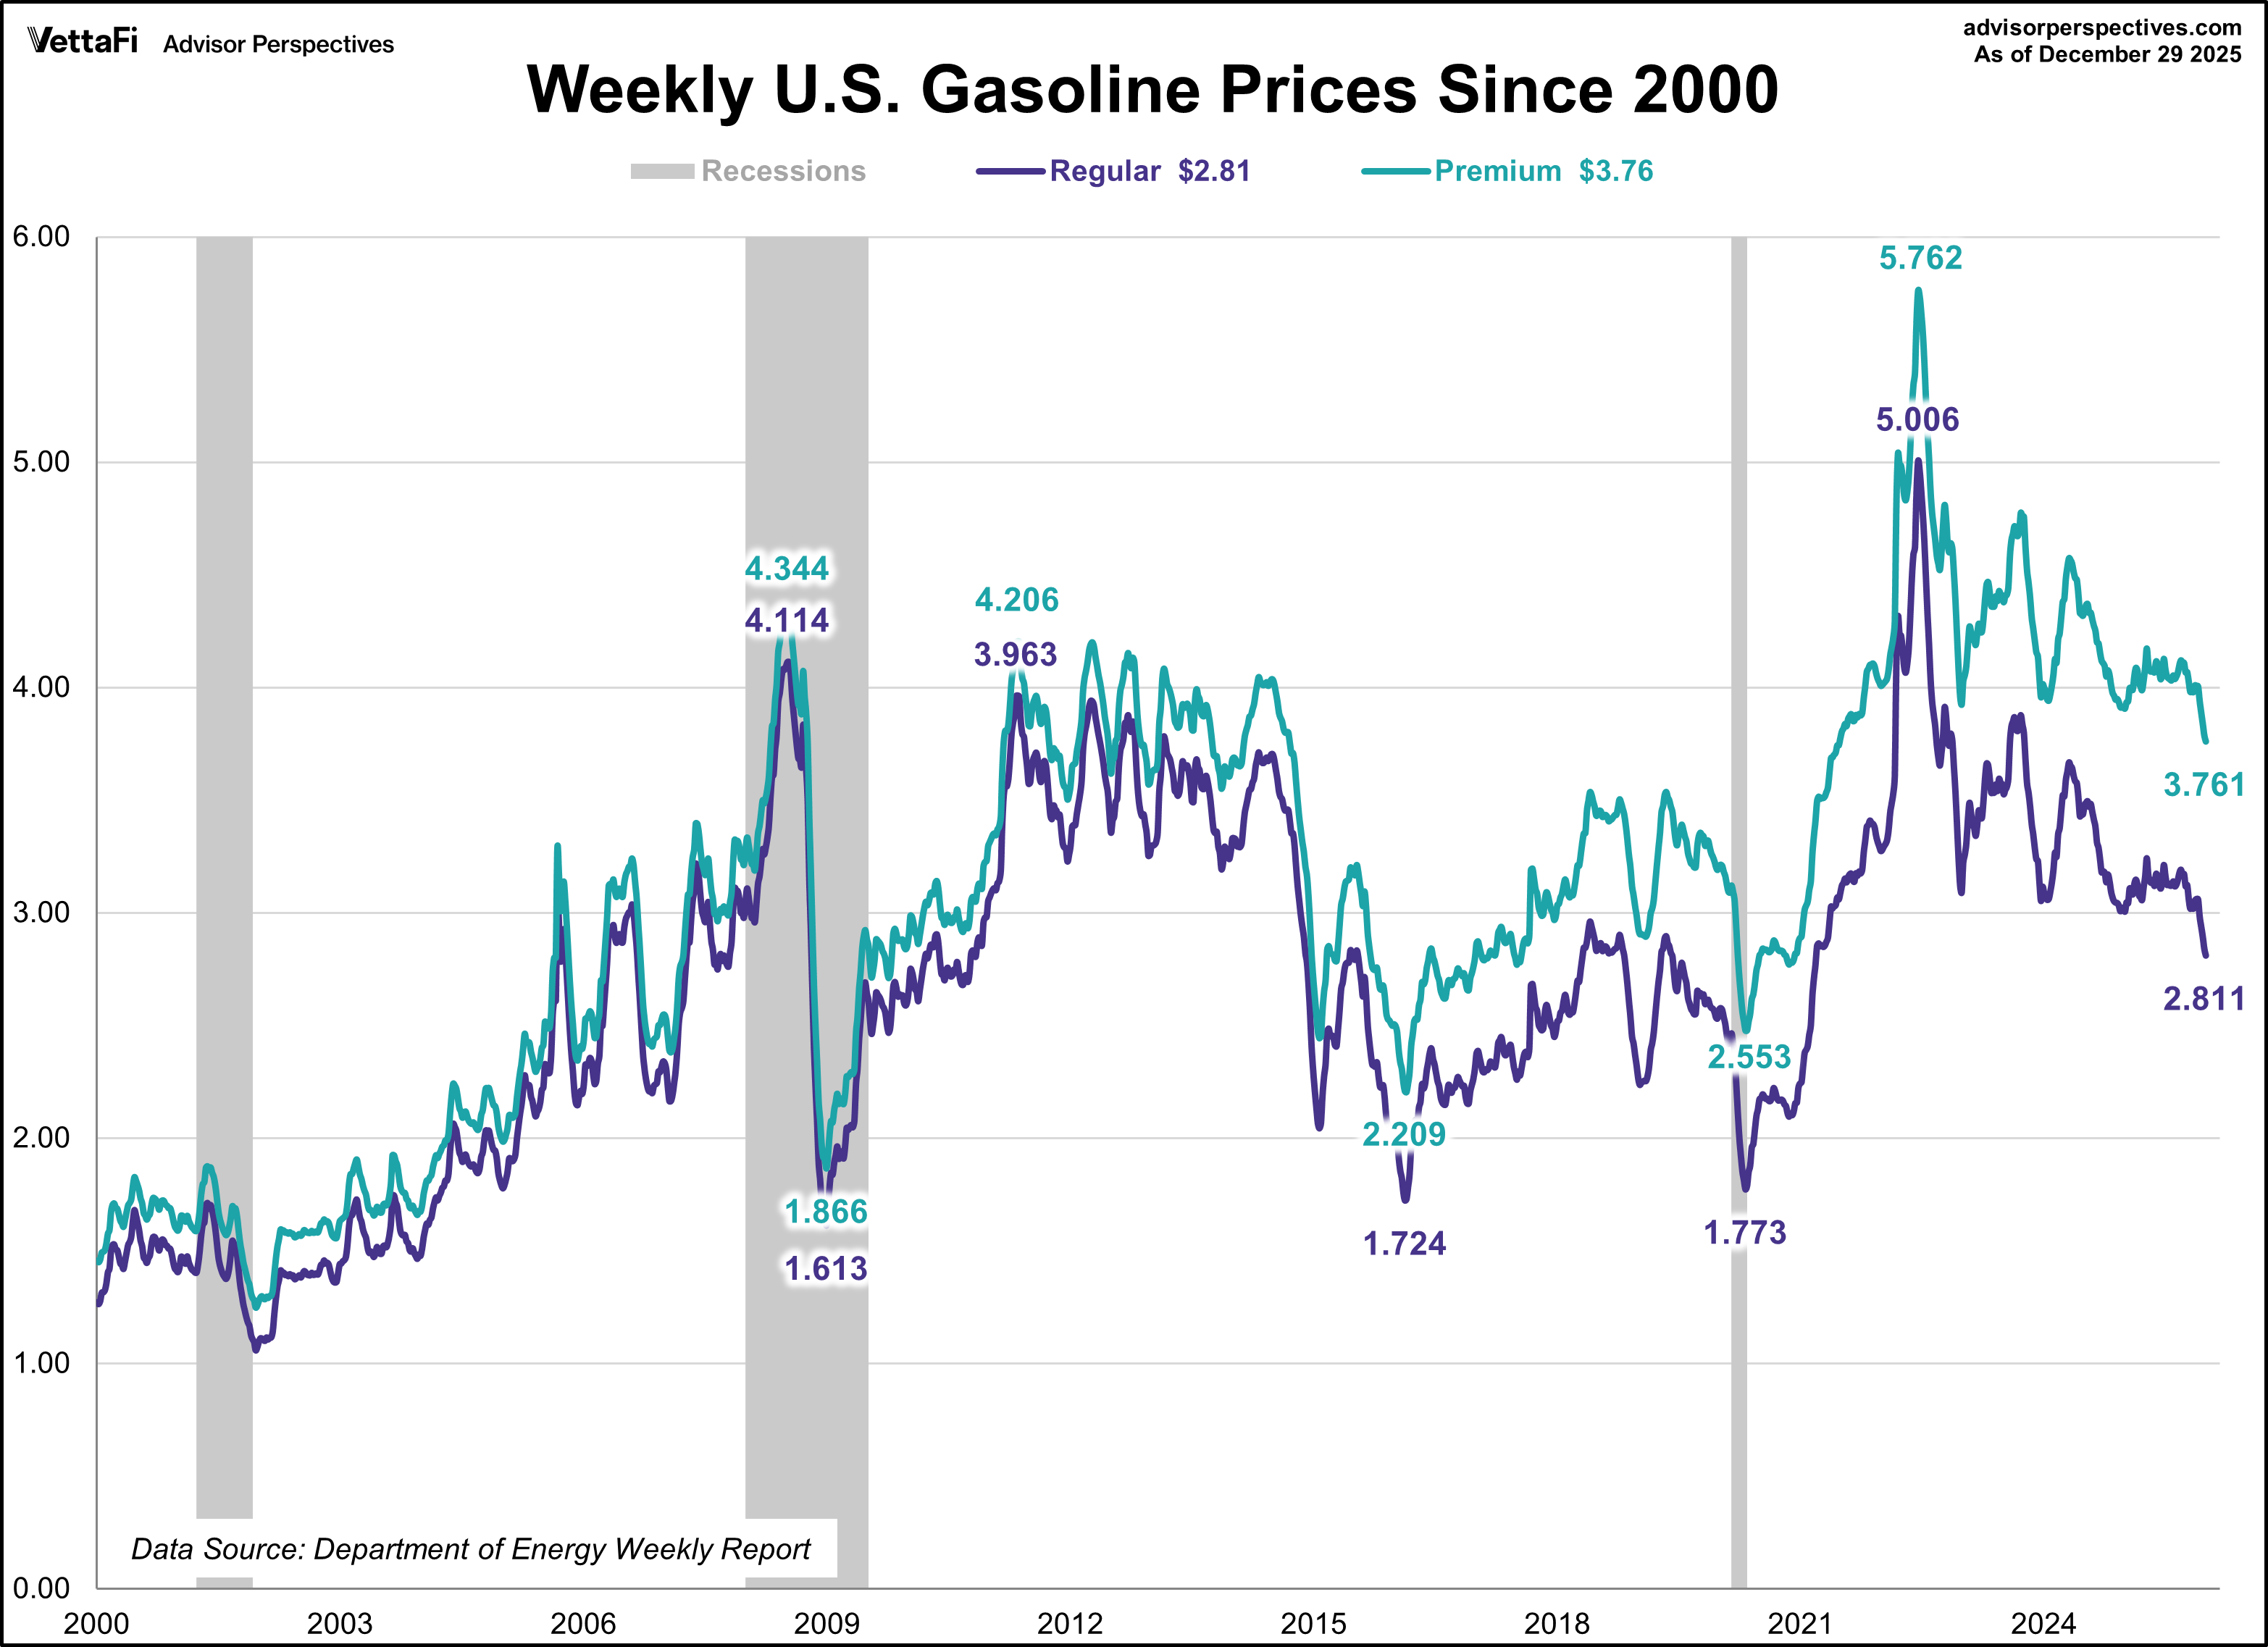
6. Weekly Gas Prices
A weekly update that shows the price of gas in nominal and real terms since the turn of the century. At the end of December, the price of gasoline was at its lowest level since early 2021.
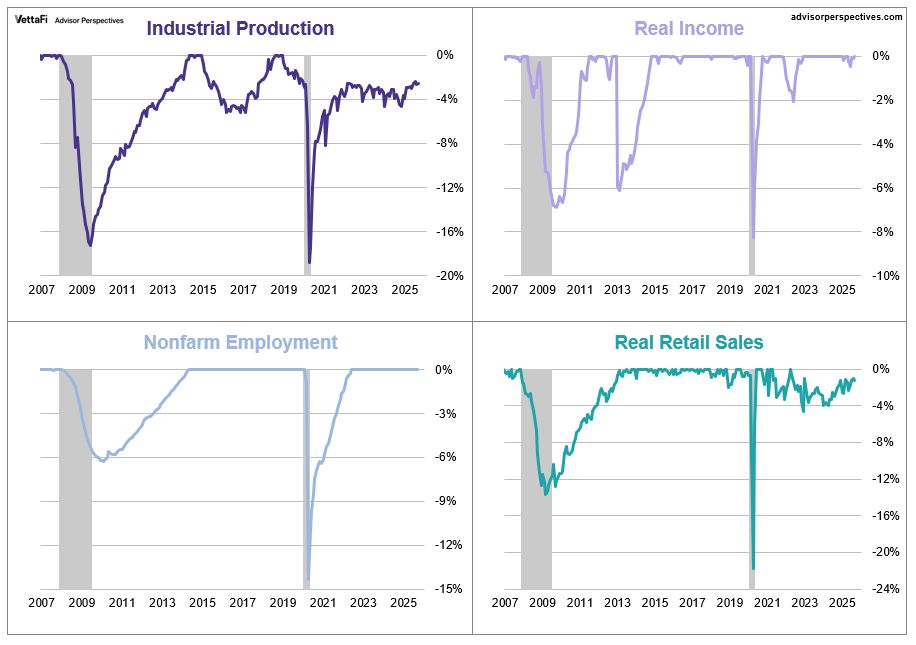
7. The Big Four Recession Indicators
An analysis of four economic indicators (Employment, Industrial Production, Real Retail Sales, and Real Personal Income) that the NBER Business Cycle Dating Committee weighs heavily when making official recession calls. The latest average of the percent off high of the four big indicators is 0.94% away from reaching a new high, the narrowest margin since February 2020.
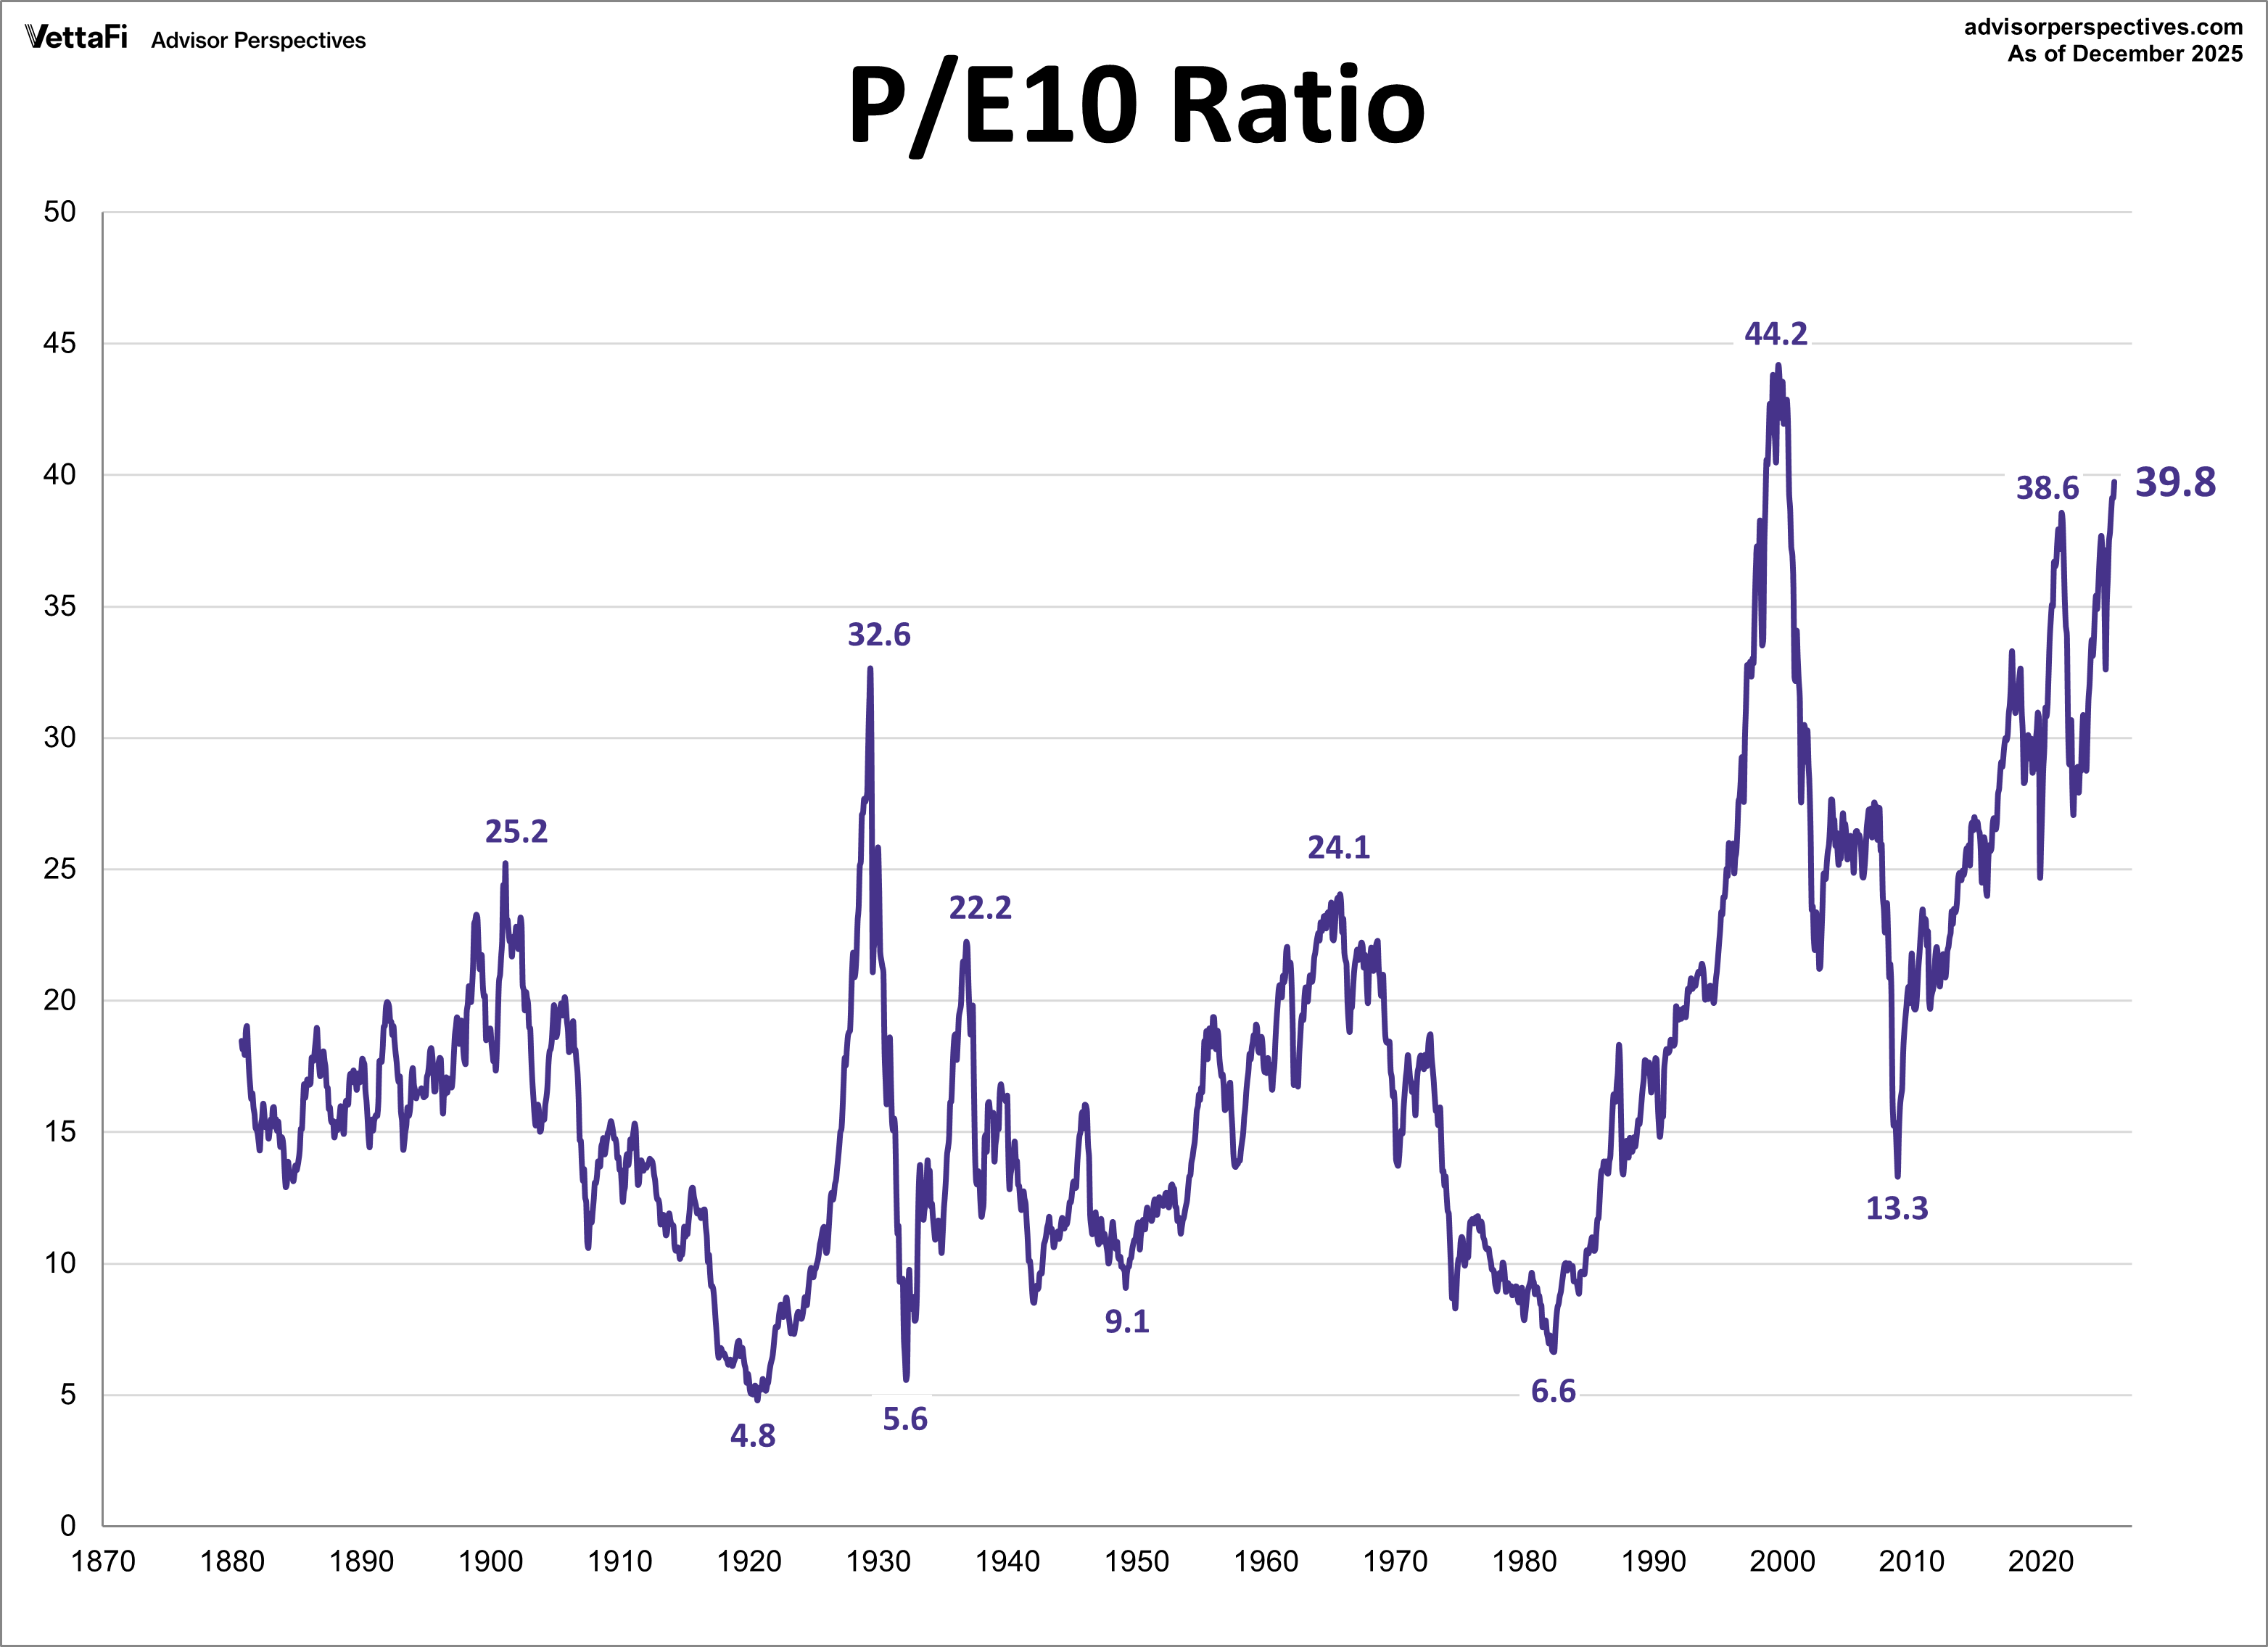
8. P/E 10 Market Valuation Update
A long-term valuation indicator calculated by dividing the current S&P 500 price by the average inflation-adjusted earnings over the past 10 years. At the end of December, the P/E 10 Ratio was at 39.8, the highest level since 2000. Thus, the indicator is signaling an OVERVALUED market.
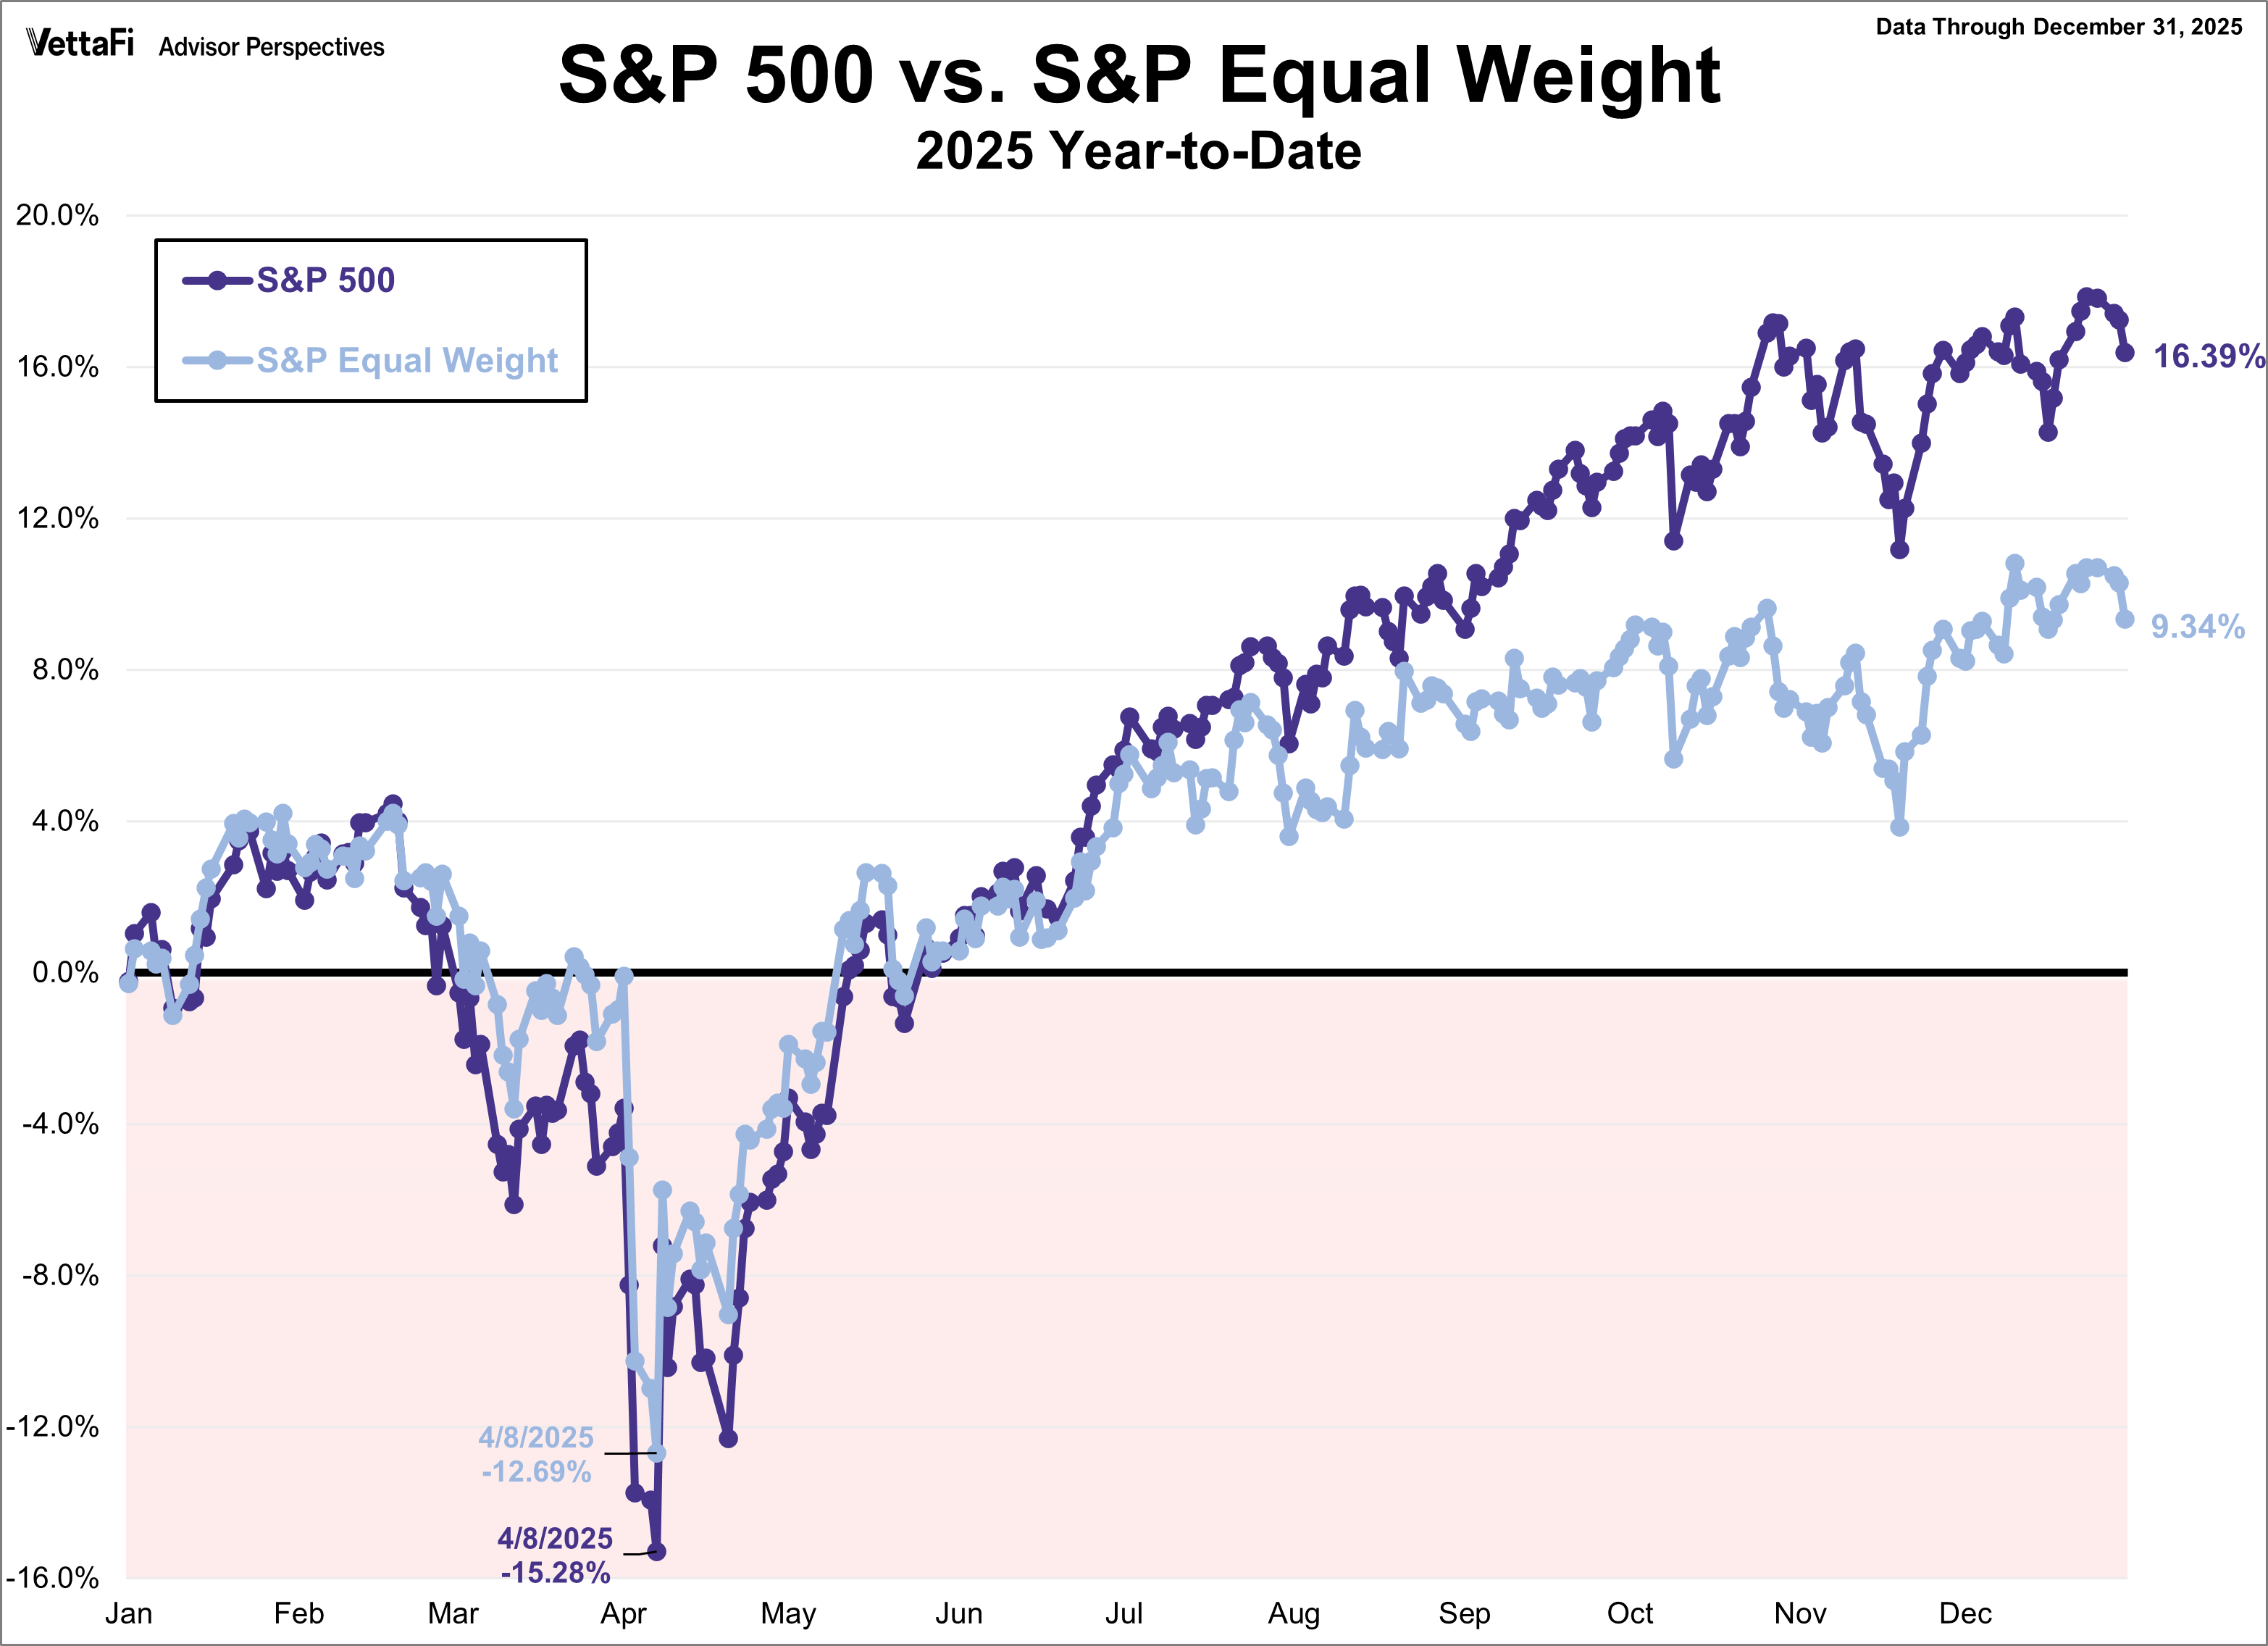
9. S&P 500 Snapshot
A weekly update that highlights the S&P 500’s performance and broader index trends. The index experienced a volatile first half of the year, but was on the rise for most of the second half. The S&P 500 finished the year with an annual gain of 16.4%, while the S&P Equal Weight index posted a 9.3% gain.
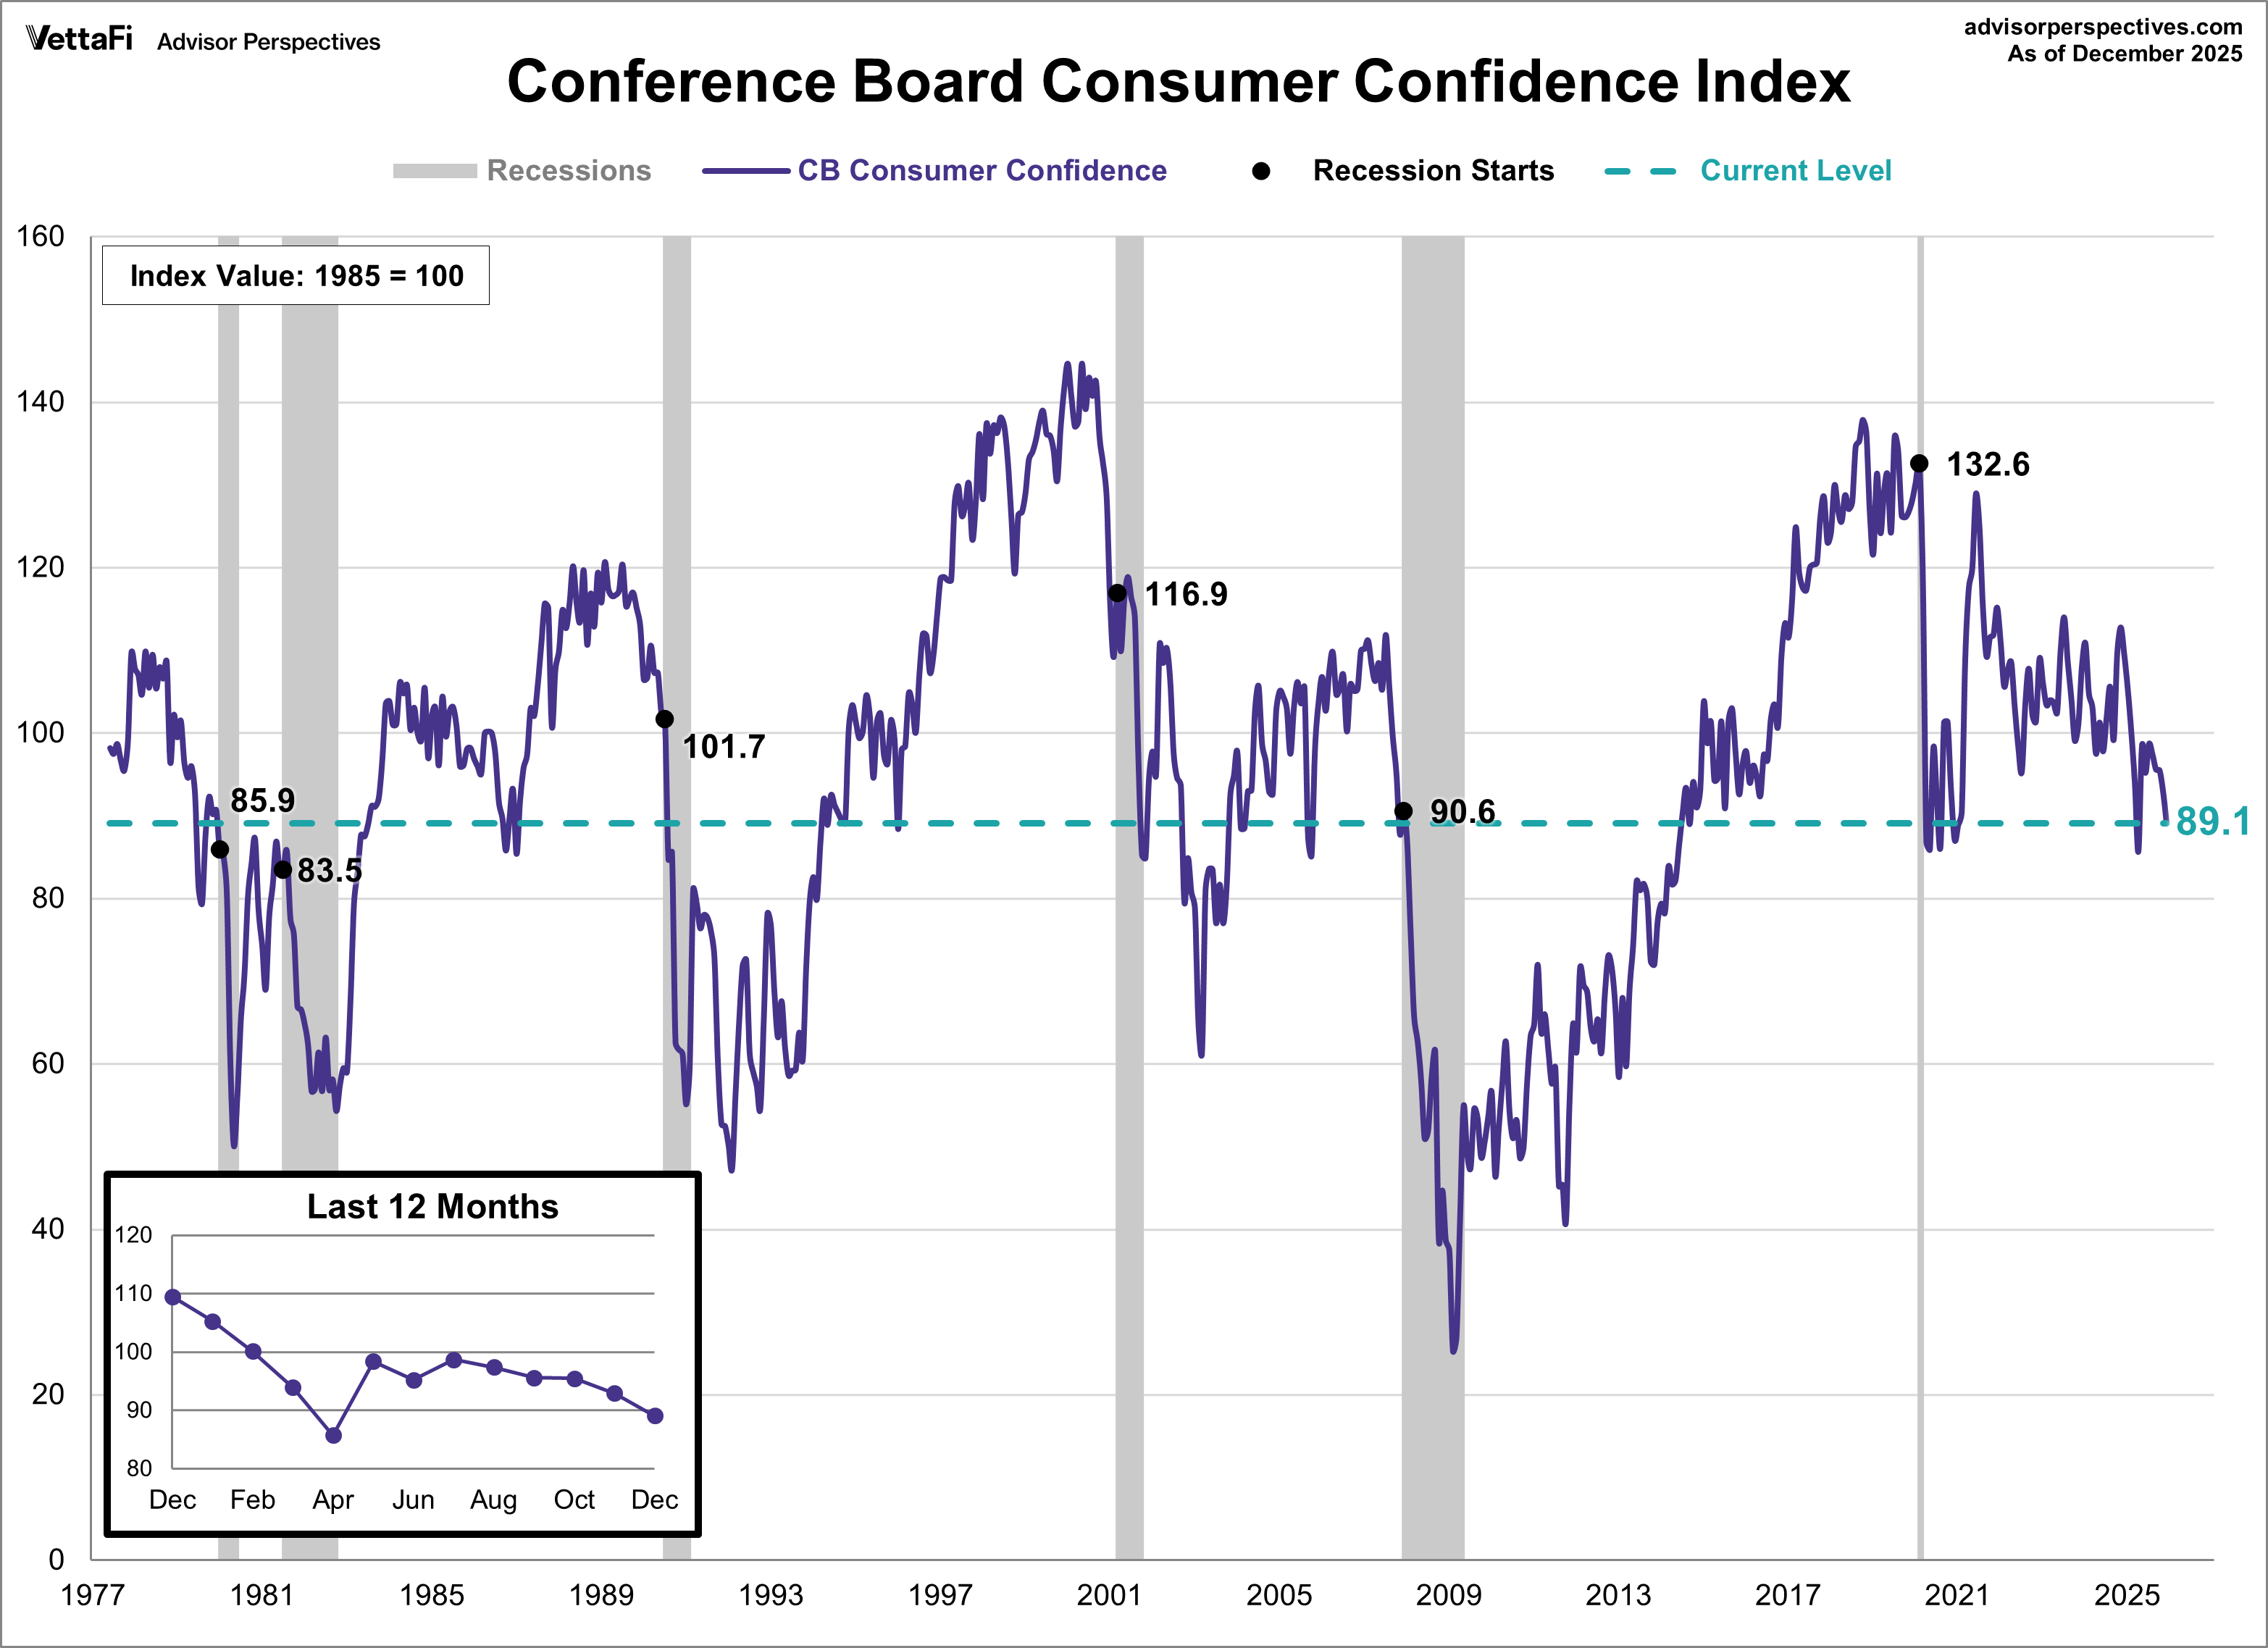
10. The Conference Board's Consumer Confidence Index
A monthly survey of consumer attitudes regarding present and future perceptions of the economy, business conditions, and the labor market. The index declined for most of the year, finishing December at 89.1.
ETFs associated with the S&P 500 include: iShares Core S&P 500 ETF (IVV), SPDR S&P 500 ETF Trust (SPY), Vanguard S&P 500 ETF (VOO), SPDR Portfolio S&P 500 ETF (SPYM), and Invesco S&P 500® Equal Weight ETF (RSP).


