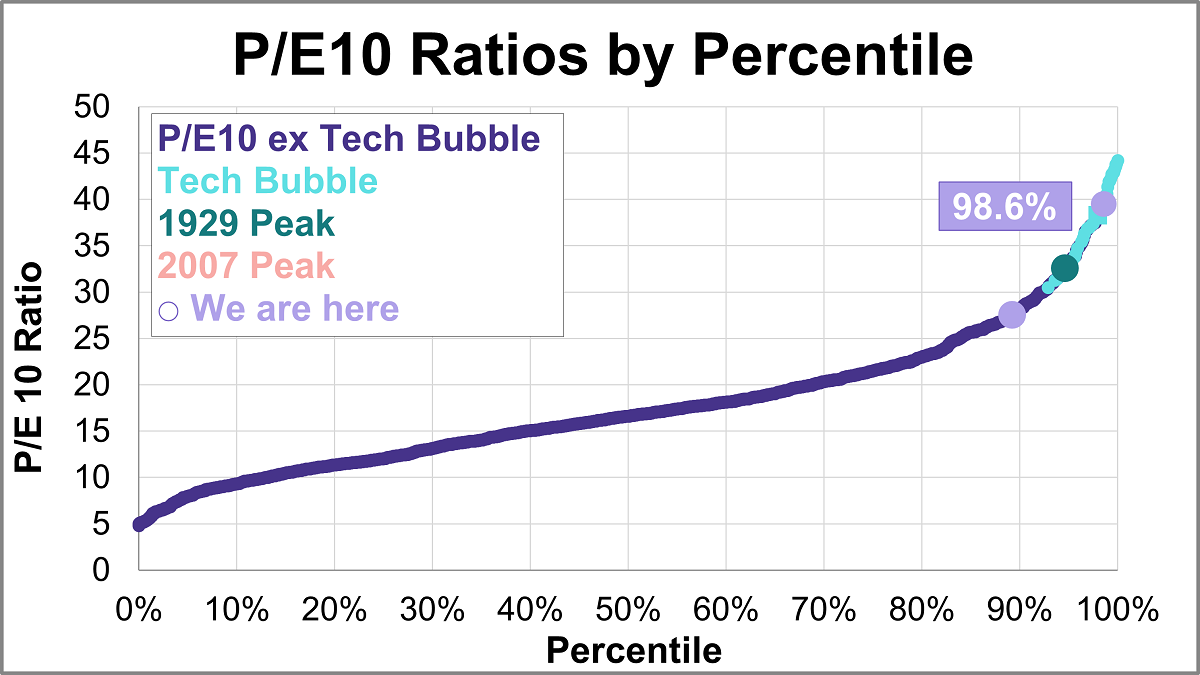
Here is the latest update of a popular market valuation method, Price-to-Earnings (P/E) ratio, using the most recent Standard & Poor's "as reported" earnings and earnings estimates, and the index monthly average of daily closes for the past month. The latest trailing twelve months (TTM) P/E ratio is 25.3 and the latest P/E10 ratio is 39.5.
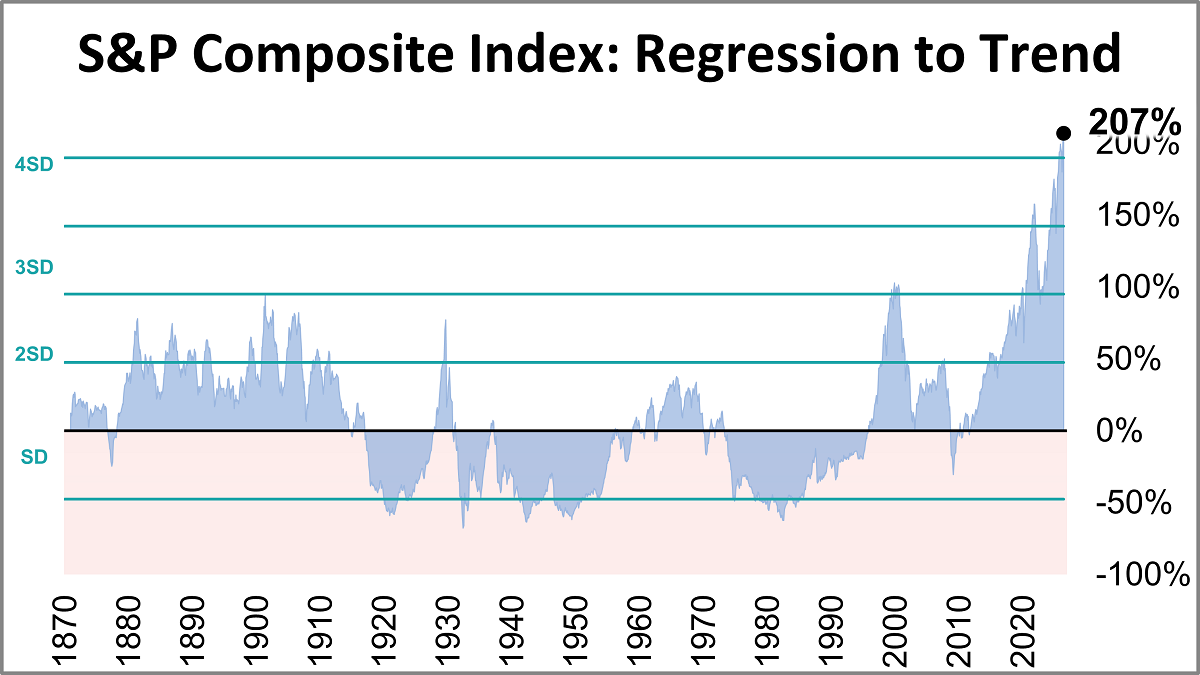
The inflation-adjusted S&P Composite Index was 207% above its long-term trend at the end of June.
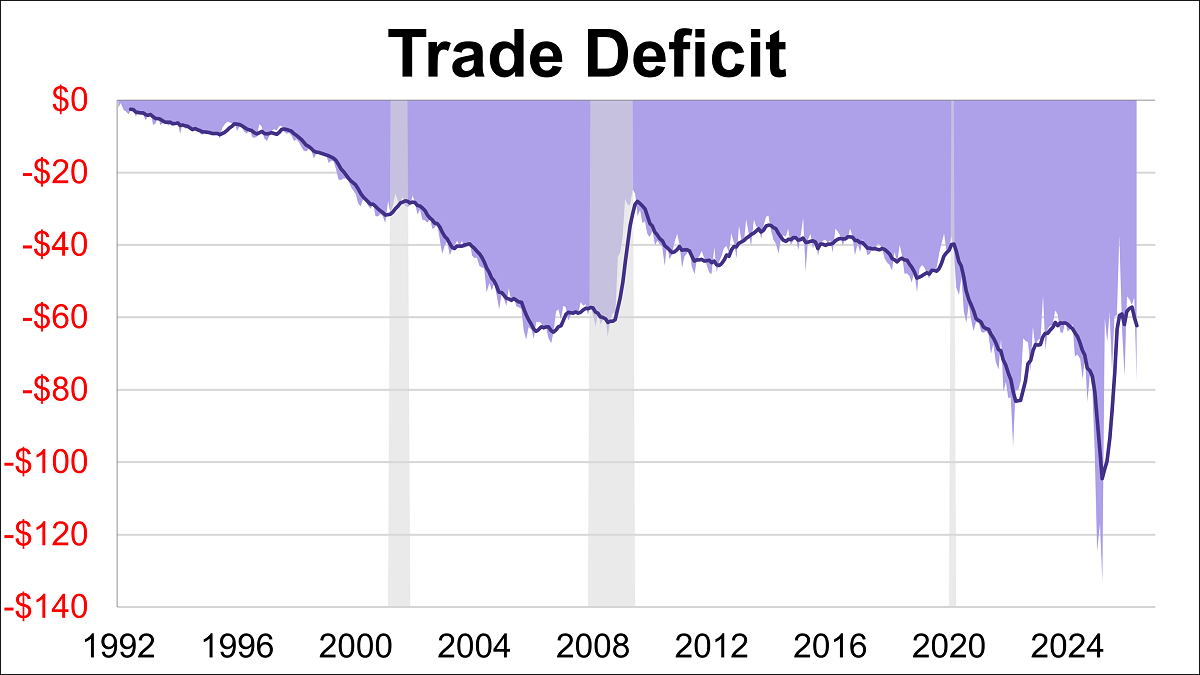
The U.S. trade deficit expanded over 40% in May to $77.59B, its widest gap since March 2025. The latest reading missed the forecast of -$78.30B.
The U.S. Treasury launched the Trump Accounts for childhood wealth building. Discover the five low-cost index ETFs anchoring the program.
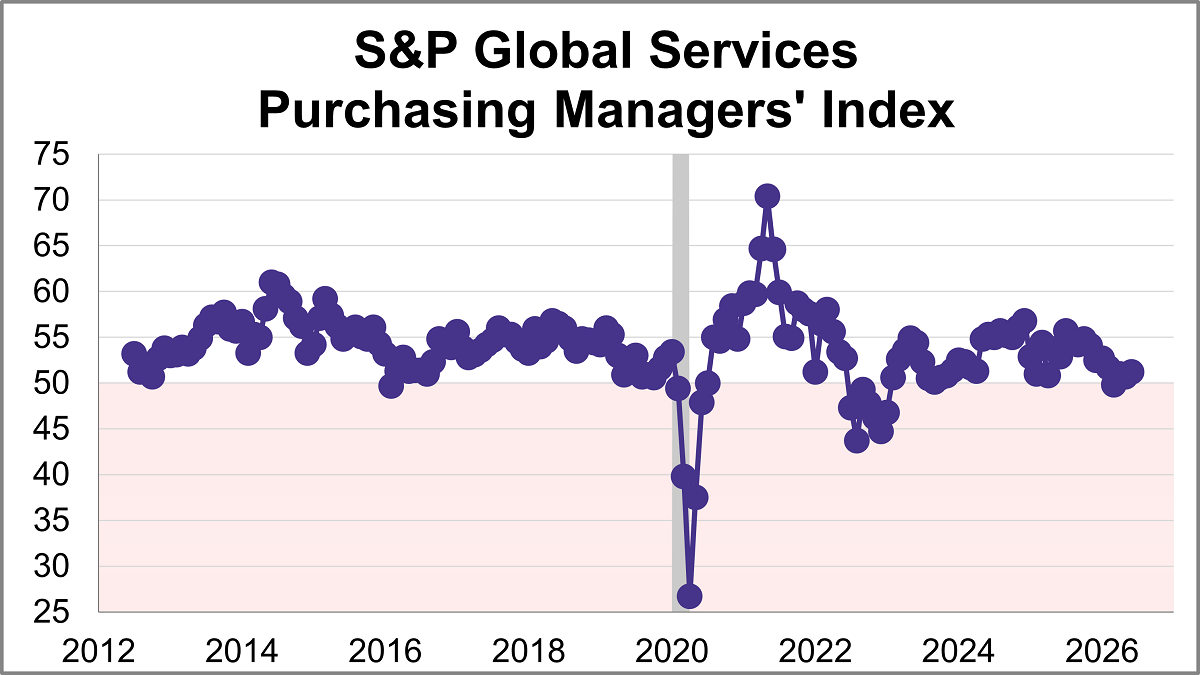
The June U.S. Services Purchasing Managers' Index (PMI) from S&P Global rose 0.5 points to 51.2, indicating a modest rise in service sector activity. The latest reading was just below the forecast of 51.3 and marked the strongest expansion in four months.
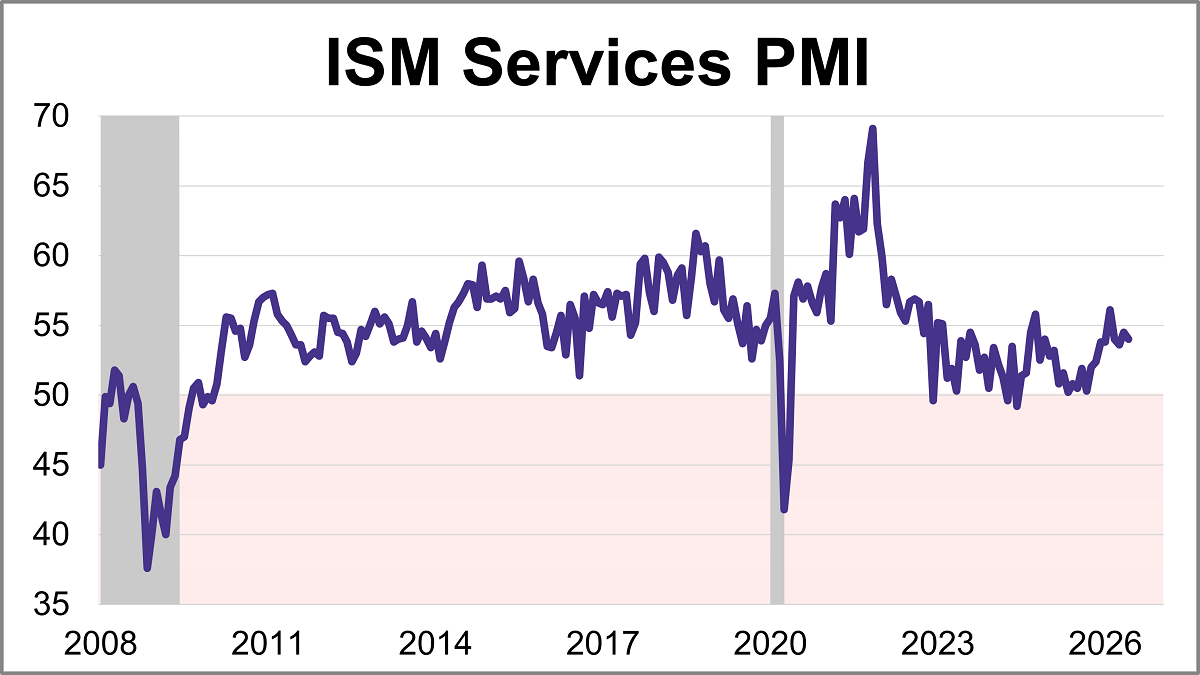
The Institute for Supply Management (ISM) released its June Services Purchasing Managers' Index (PMI), with the headline composite index at 54.0. This was slightly lower than the forecast of 54.2 but keeps the index in expansion territory for a 24th consecutive month.
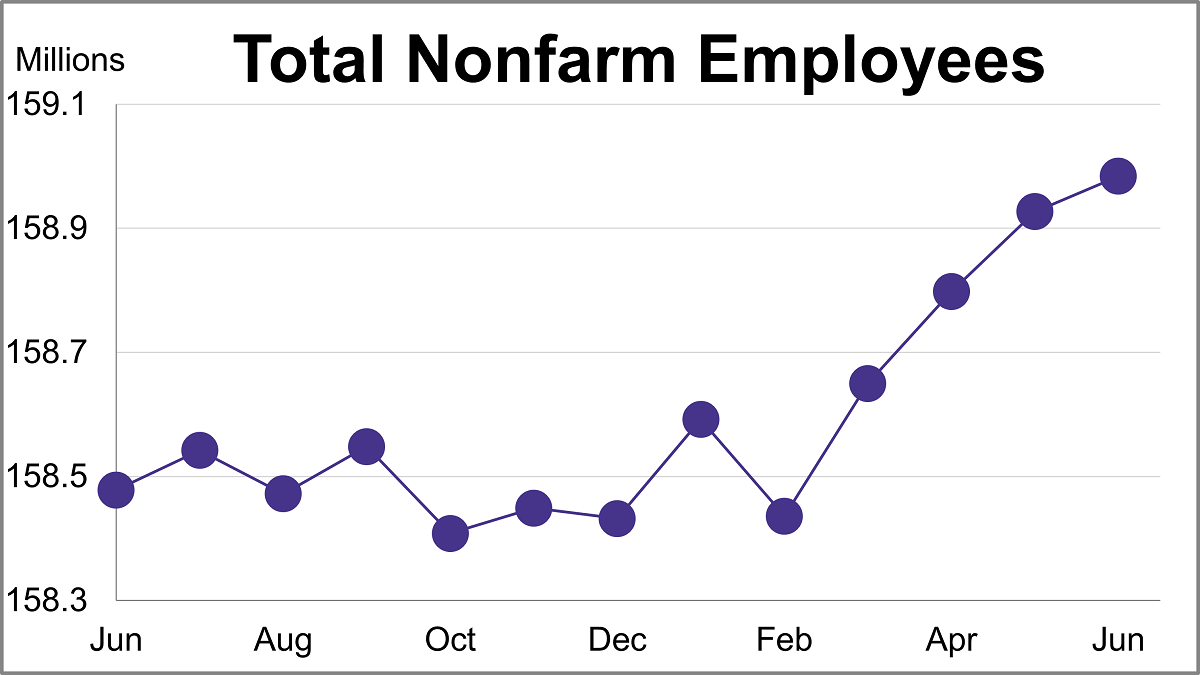
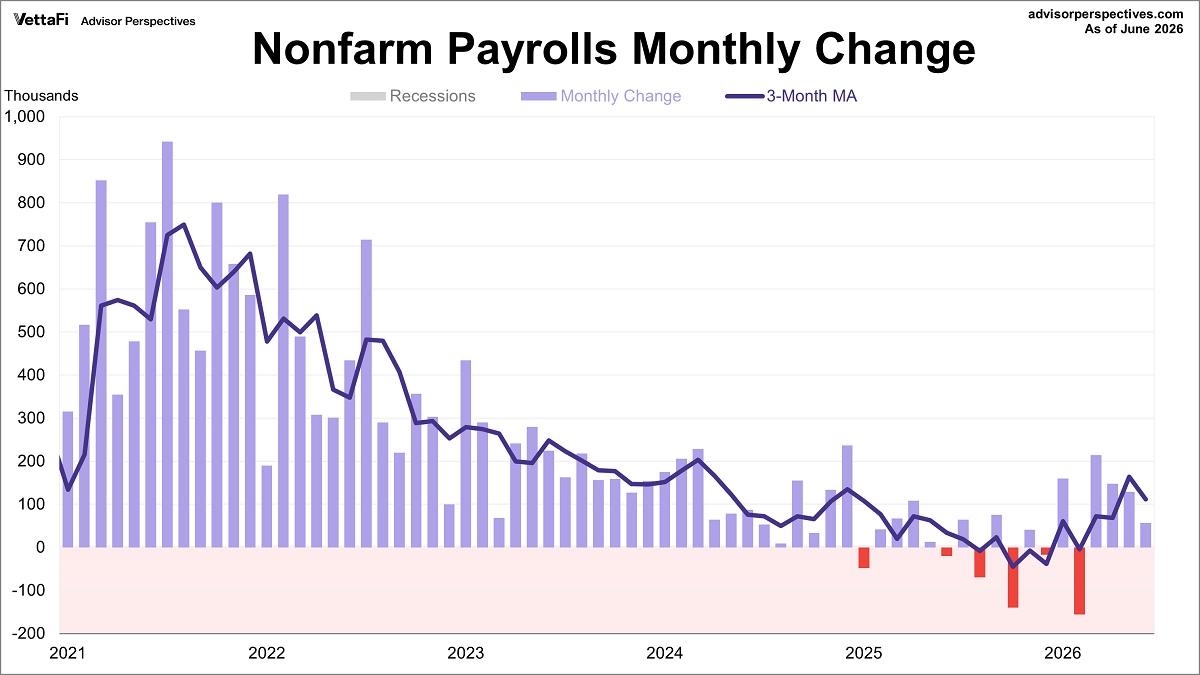
There is a general belief that there are four big indicators that the NBER Business Cycle Dating Committee weighs heavily in their cycle identification process. This commentary focuses on one of these indicators: nonfarm employment. In June, total nonfarm payrolls increased by 57,000 while the unemployment rate ticked down to 4.2%.
The latest employment report showed that 57,000 jobs were added in June, down from May's 129,000 gain. This figure was significantly lower than the projected addition of 114,000 jobs. Meanwhile, the unemployment rate unexpectedly ticked down to 4.2%.
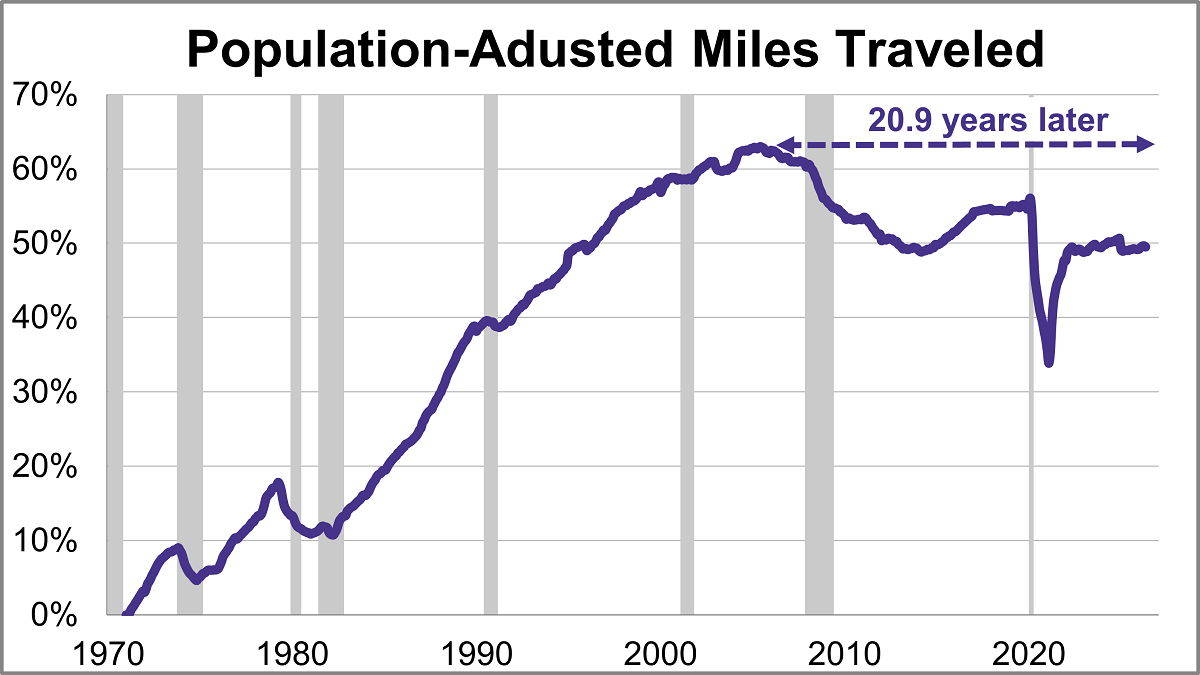
Travel on all roads and streets decreased in May. The 12-month moving average was down 0.06% month-over-month but was up 0.93% year-over-year. However, if we factor in population growth, the 12-month MA of the civilian population-adjusted data (age 16-and-over) was down 0.10% month-over-month and up 0.32% year-over-year.
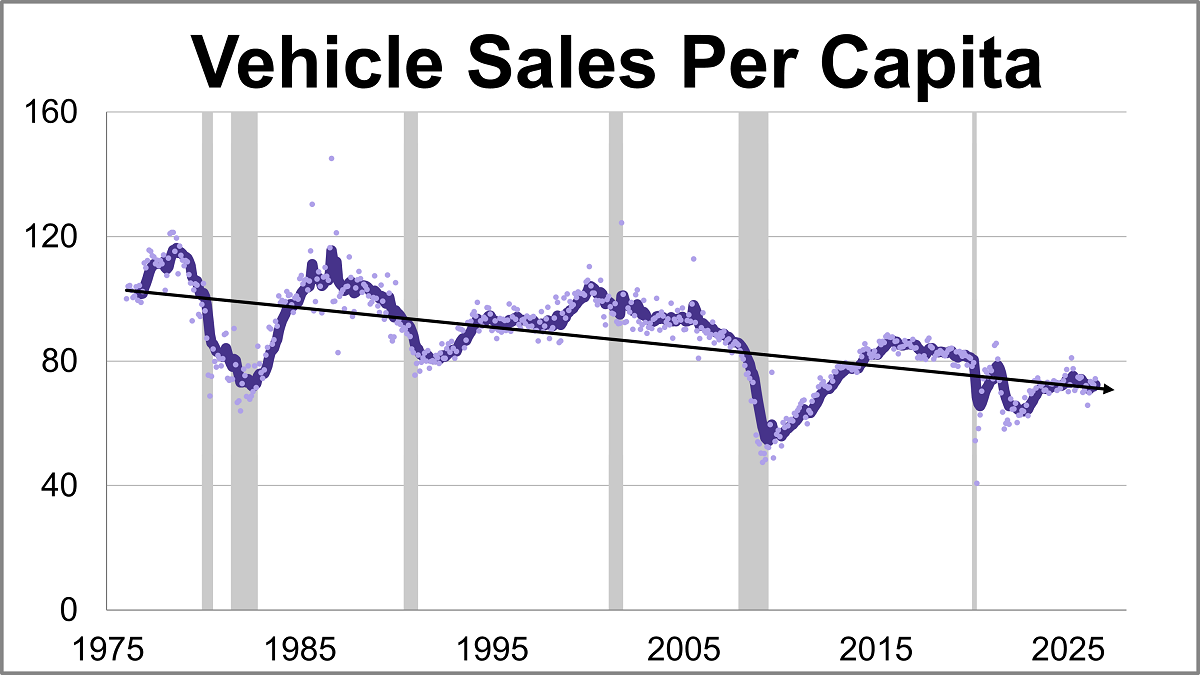
Vehicle sales rose to their highest level in nine months in June, coming in at a seasonally adjusted annual rate of 16.523 million units. This represents a 2.8% increase from the previous month and a 4.4% rise from one year ago.
Home prices fell for a second straight month in April according to the S&P Cotality Case-Shiller index, as the housing slowdown intensifies. On a seasonally adjusted basis, the national index dropped 0.1% month-over-month and was up 0.8% year-over-year.
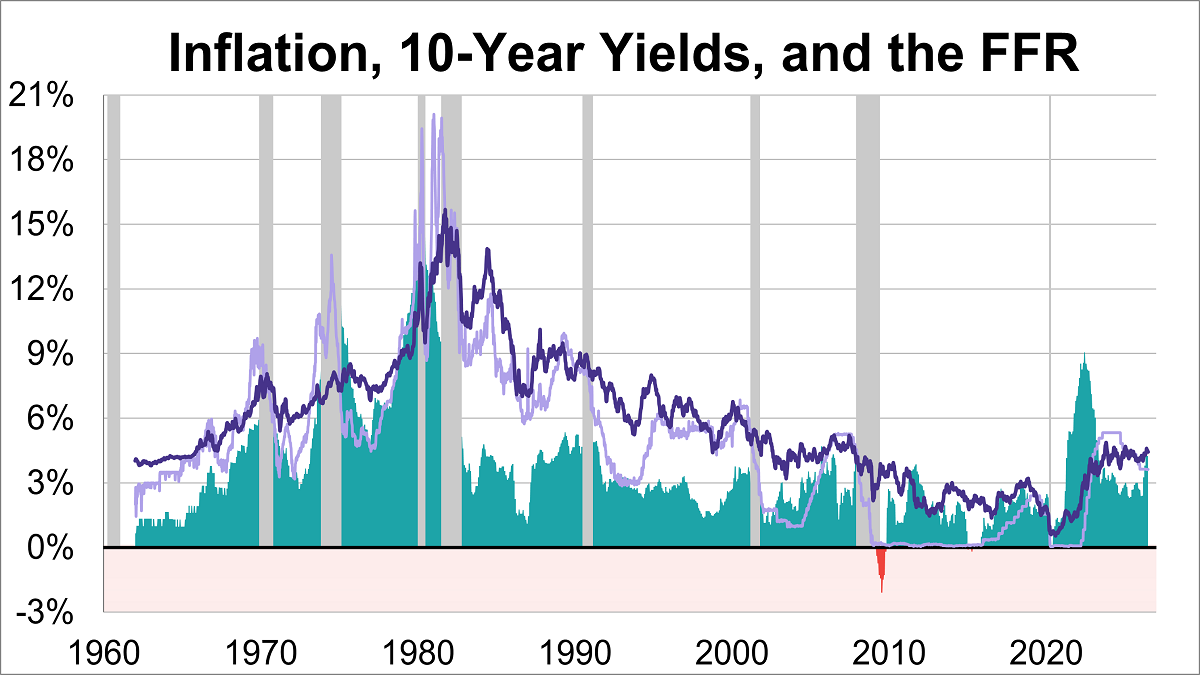
The 10-year Treasury yield has experienced dramatic fluctuations, ranging from a peak of 15.68% in October 1981, during the height of the Volcker era, to a historic low of 0.55% in August 2020, amidst the economic uncertainty of the pandemic. At the end of June 2026, the weekly average stood at 4.44%.
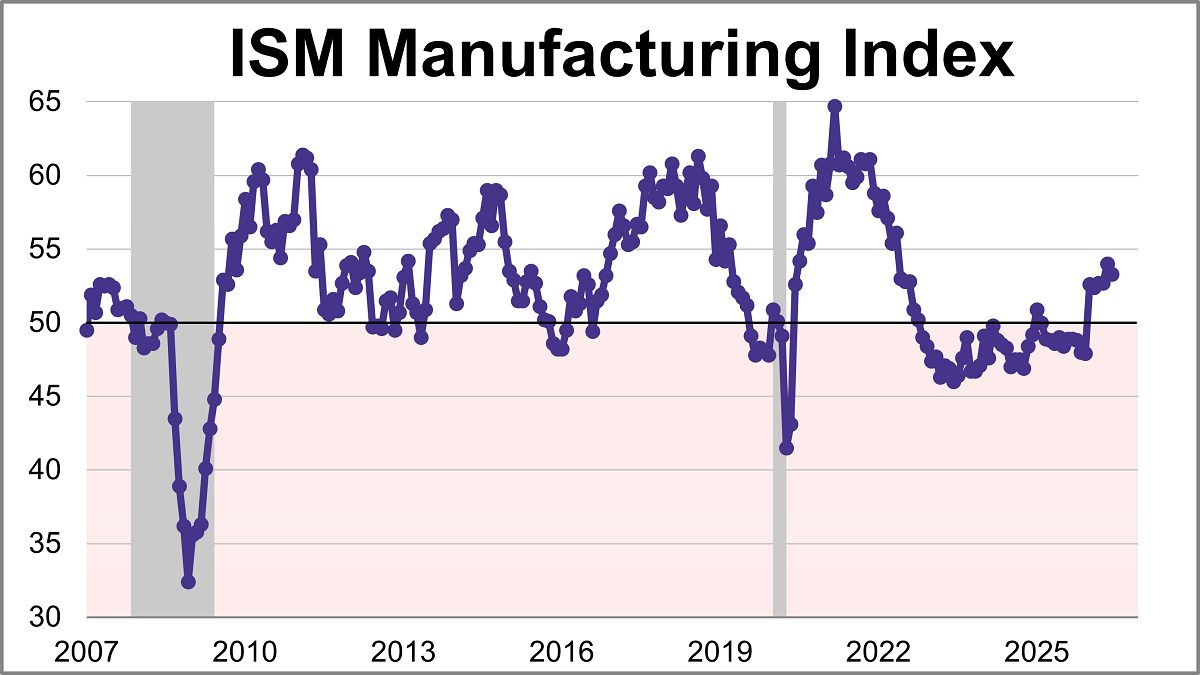
The Institute for Supply Management (ISM) manufacturing purchasing managers index (PMI) came in at 53.3 in June, down from 54.0 in May, marking slightly slower growth. The latest reading was just below the 53.8 forecast and is the index's sixth straight month in expansion territory.
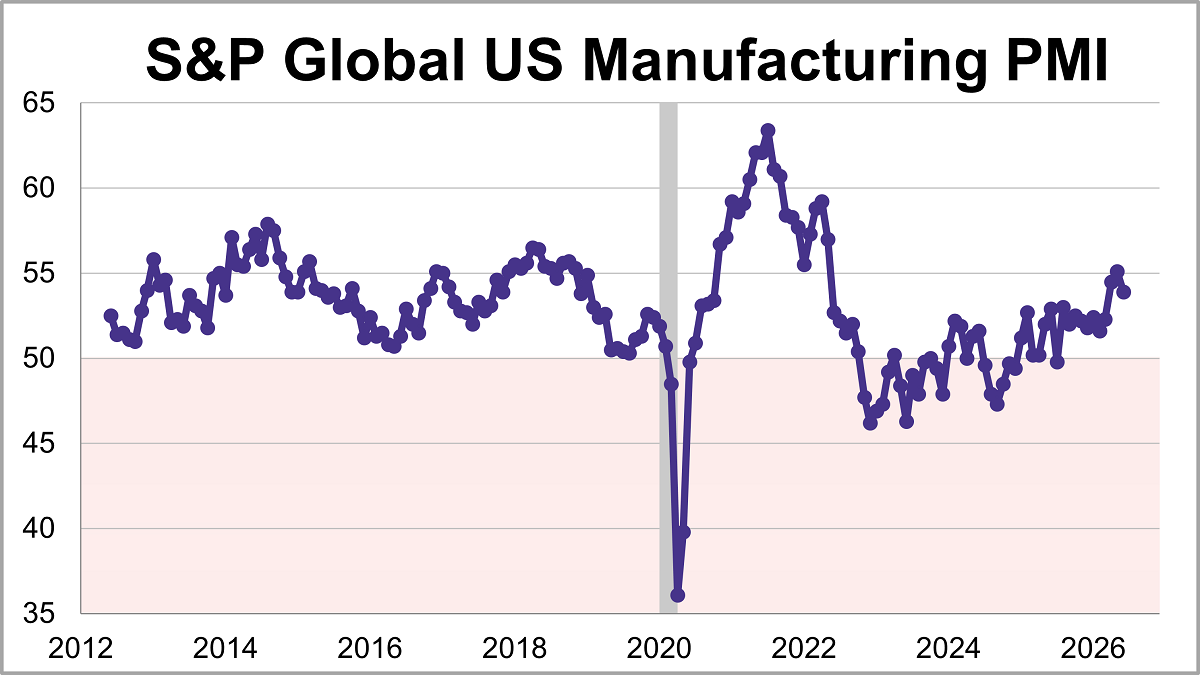
U.S. manufacturing expanded for an eleventh straight month in June but the growth eased to its lowest level in three months. The S&P Global PMI fell 1.2 points to 53.9 last month, falling short of the 55.7 forecast.
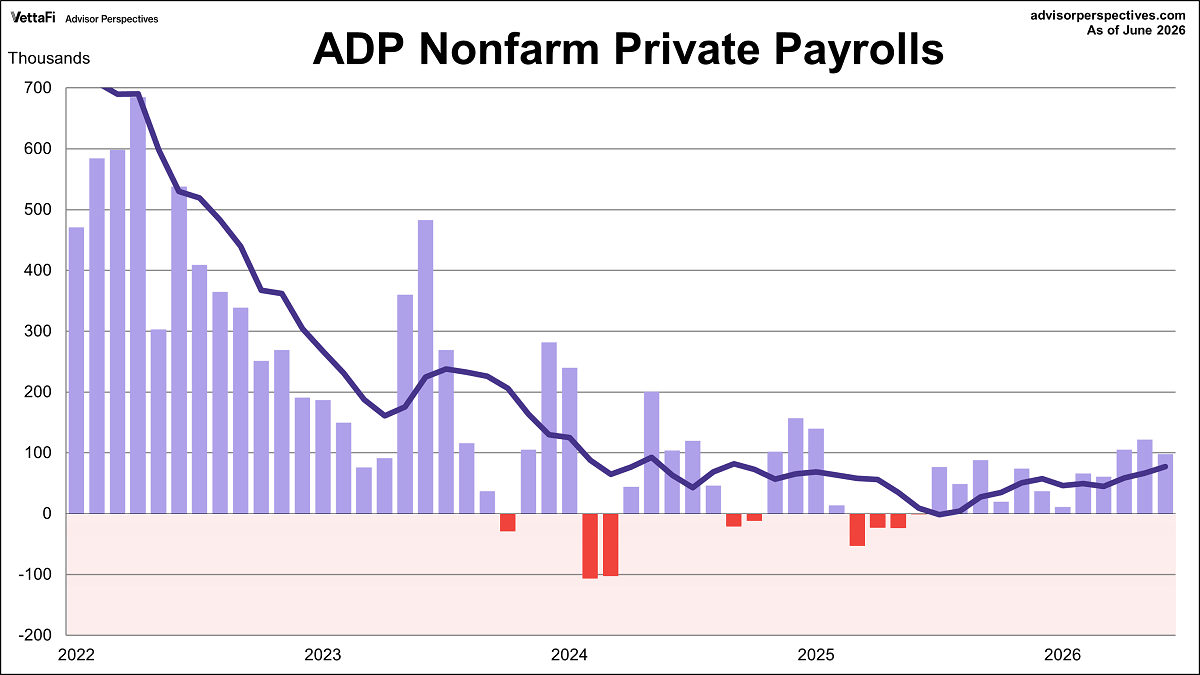
The ADP employment report revealed that 98,000 nonfarm private jobs were added in June, the twelfth straight month of growth. However, the latest figure was below the projected 118,000 addition.
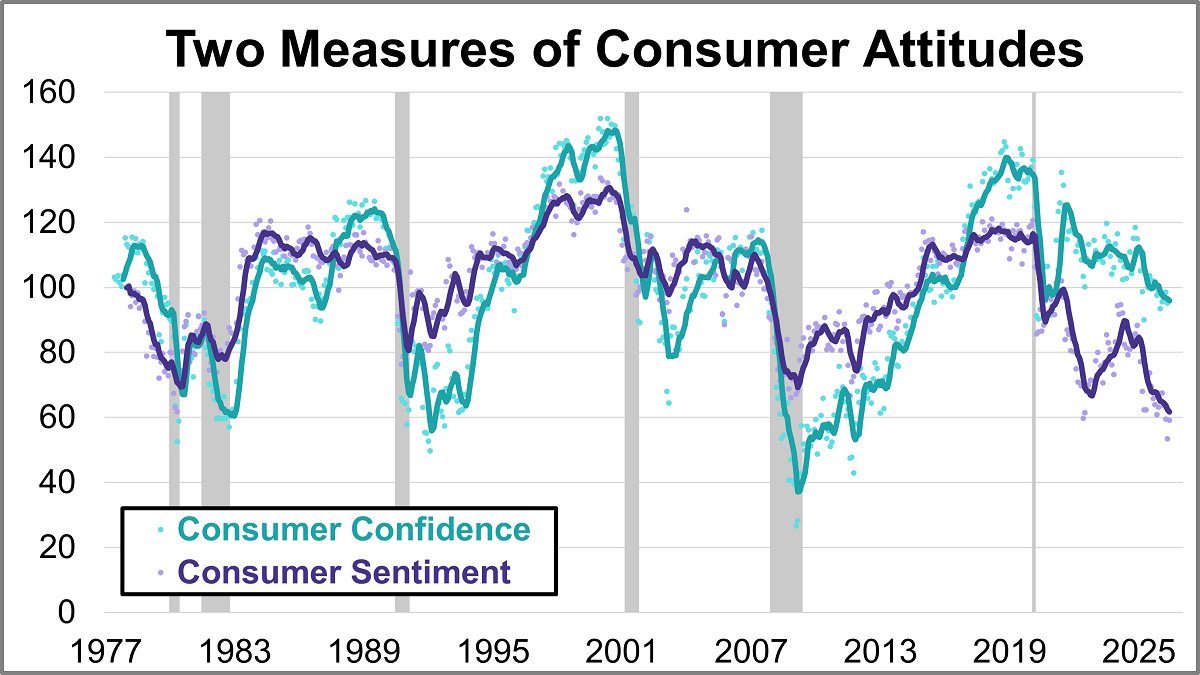
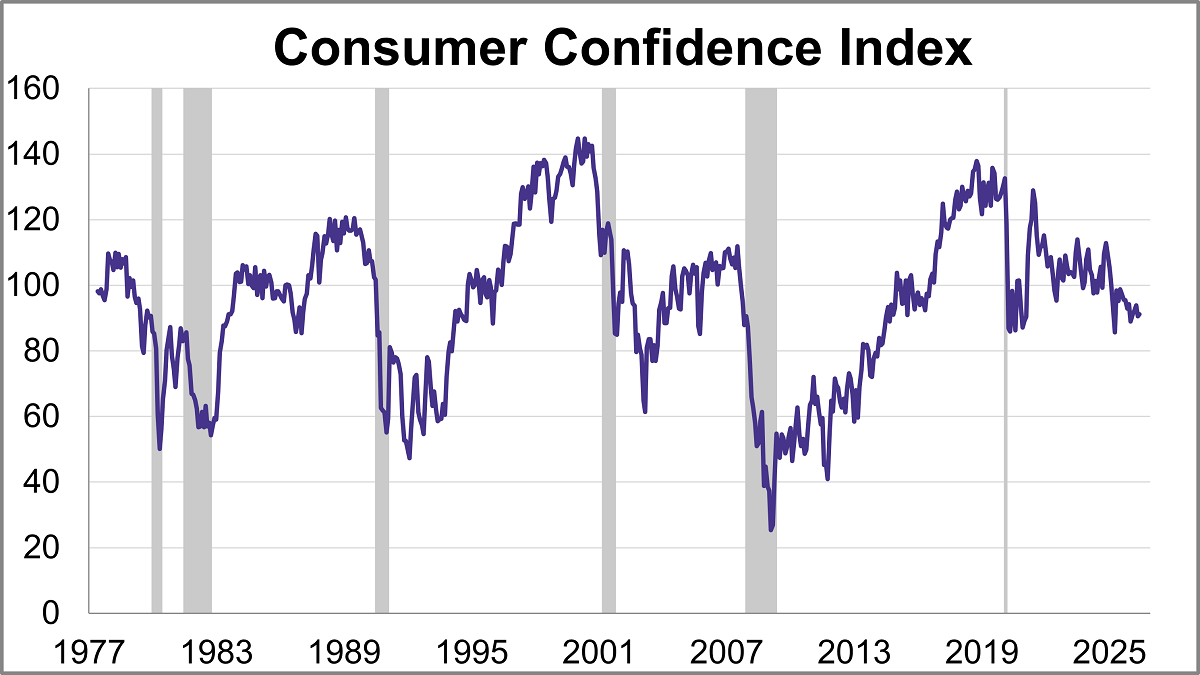
What are consumers thinking about the economy? Their collective mood offers crucial clues for businesses, investors, and policymakers alike. In June, the two leading benchmarks, the University of Michigan’s Consumer Sentiment Index (MCSI) and the Conference Board’s Consumer Confidence Index (CCI), offered similar views with both showing slight improvement despite ongoing inflation concerns.
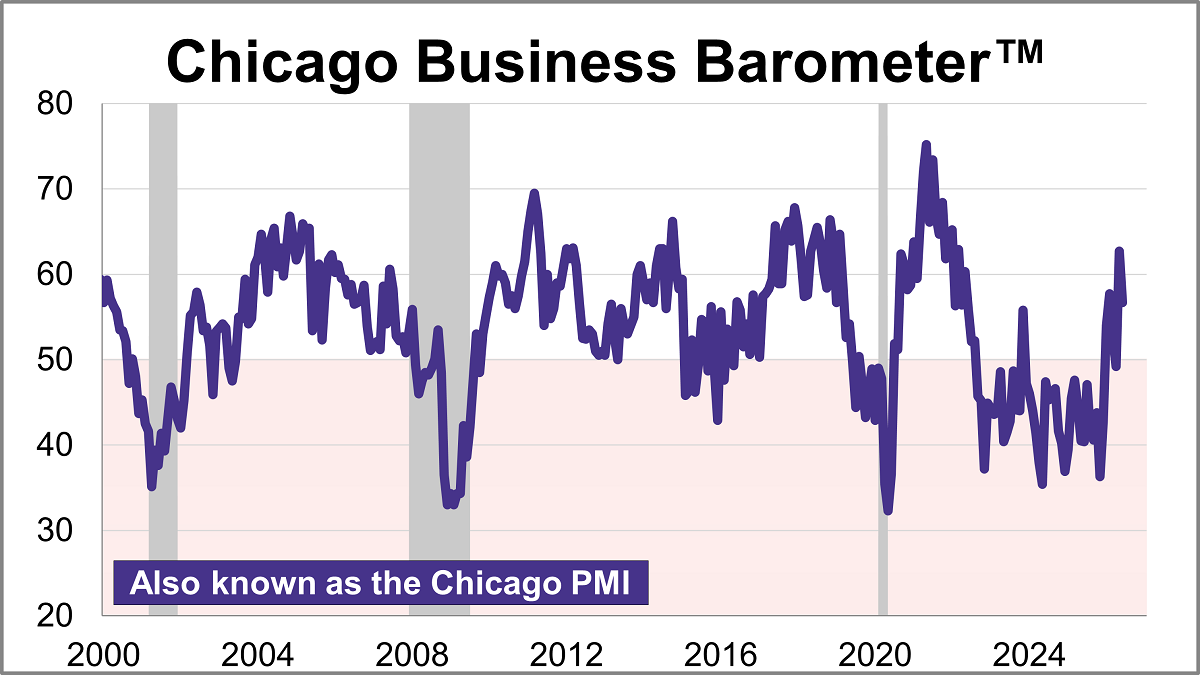
The Chicago Purchasing Managers’ Index cooled 6.0 points in June to 56.7, signaling an expansion in regional business activity for a second straight month. The latest reading was higher than the projected 55.7.
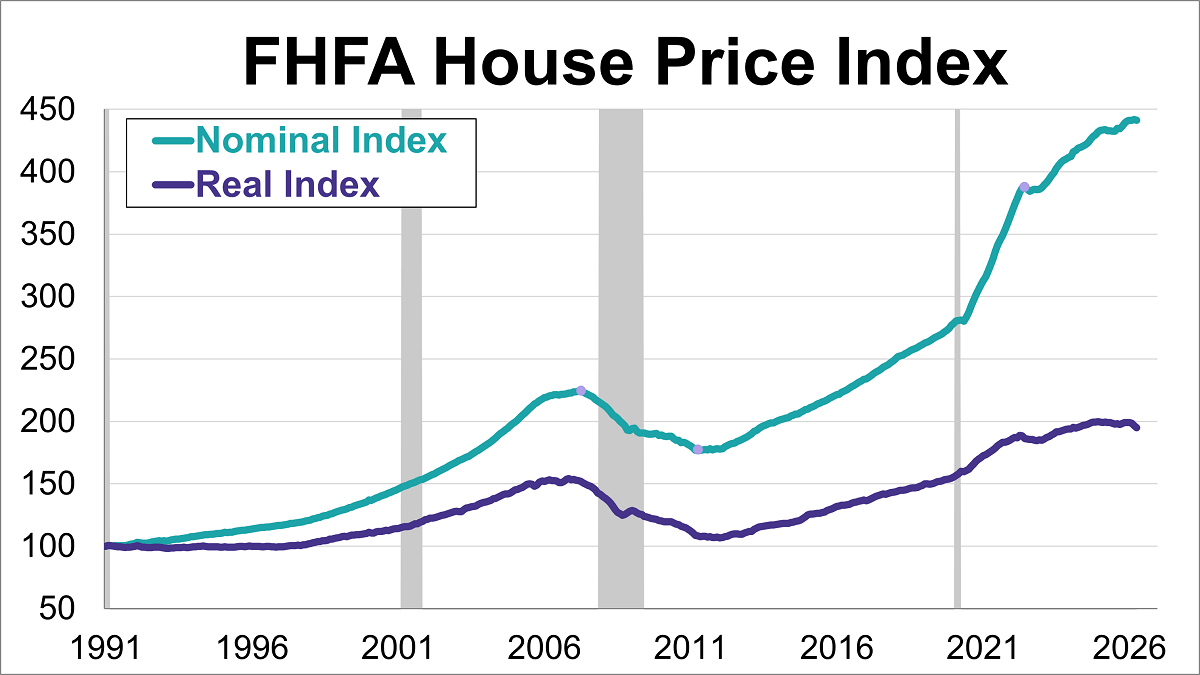
The Federal Housing Finance Agency (FHFA) House Price Index (HPI) retreated in April, falling 0.1% from the previous month's record high to 441.4.
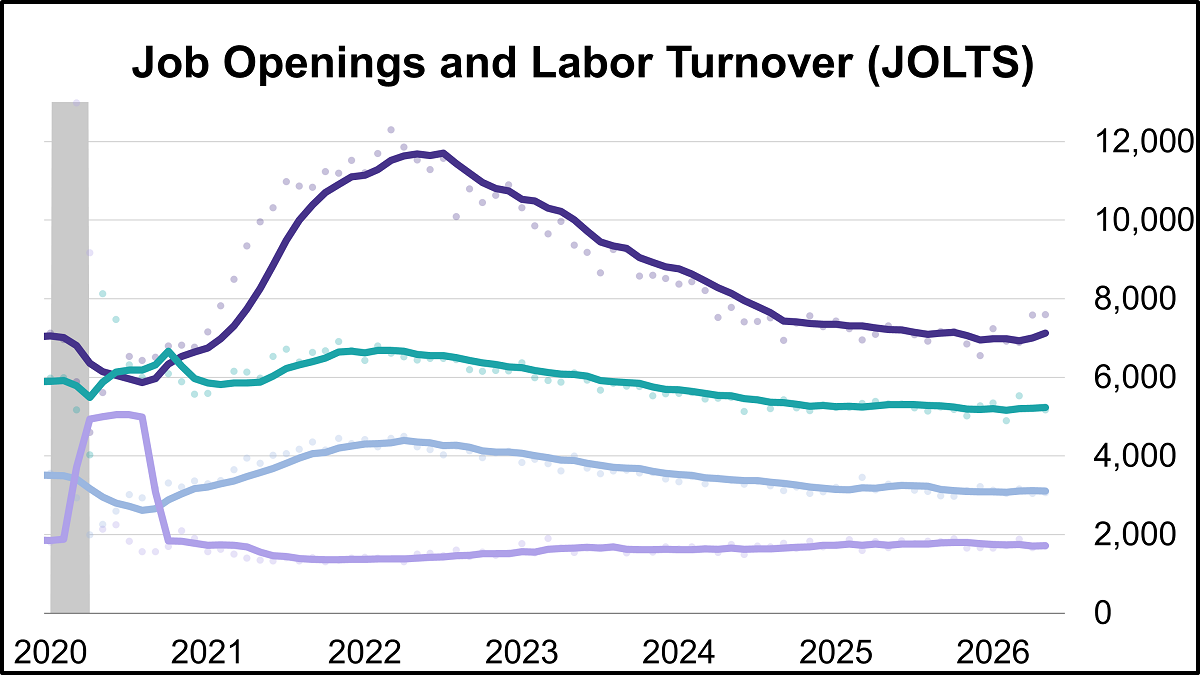
Job openings reached their highest level in two years in May, hitting 7.594 million vacancies according to the latest Job Openings and Labor Turnover Survey (JOLTS). The latest reading was higher than the projected 7.280 million openings.
The Conference Board's Consumer Confidence Index® inched up in June, rising 0.6 points to 91.2. Despite the improvement, the index came in below the forecast of 94.4.
The top 10 active ETFs YTD by fund flows show some intriguing trends and successful names that may pique the interest.
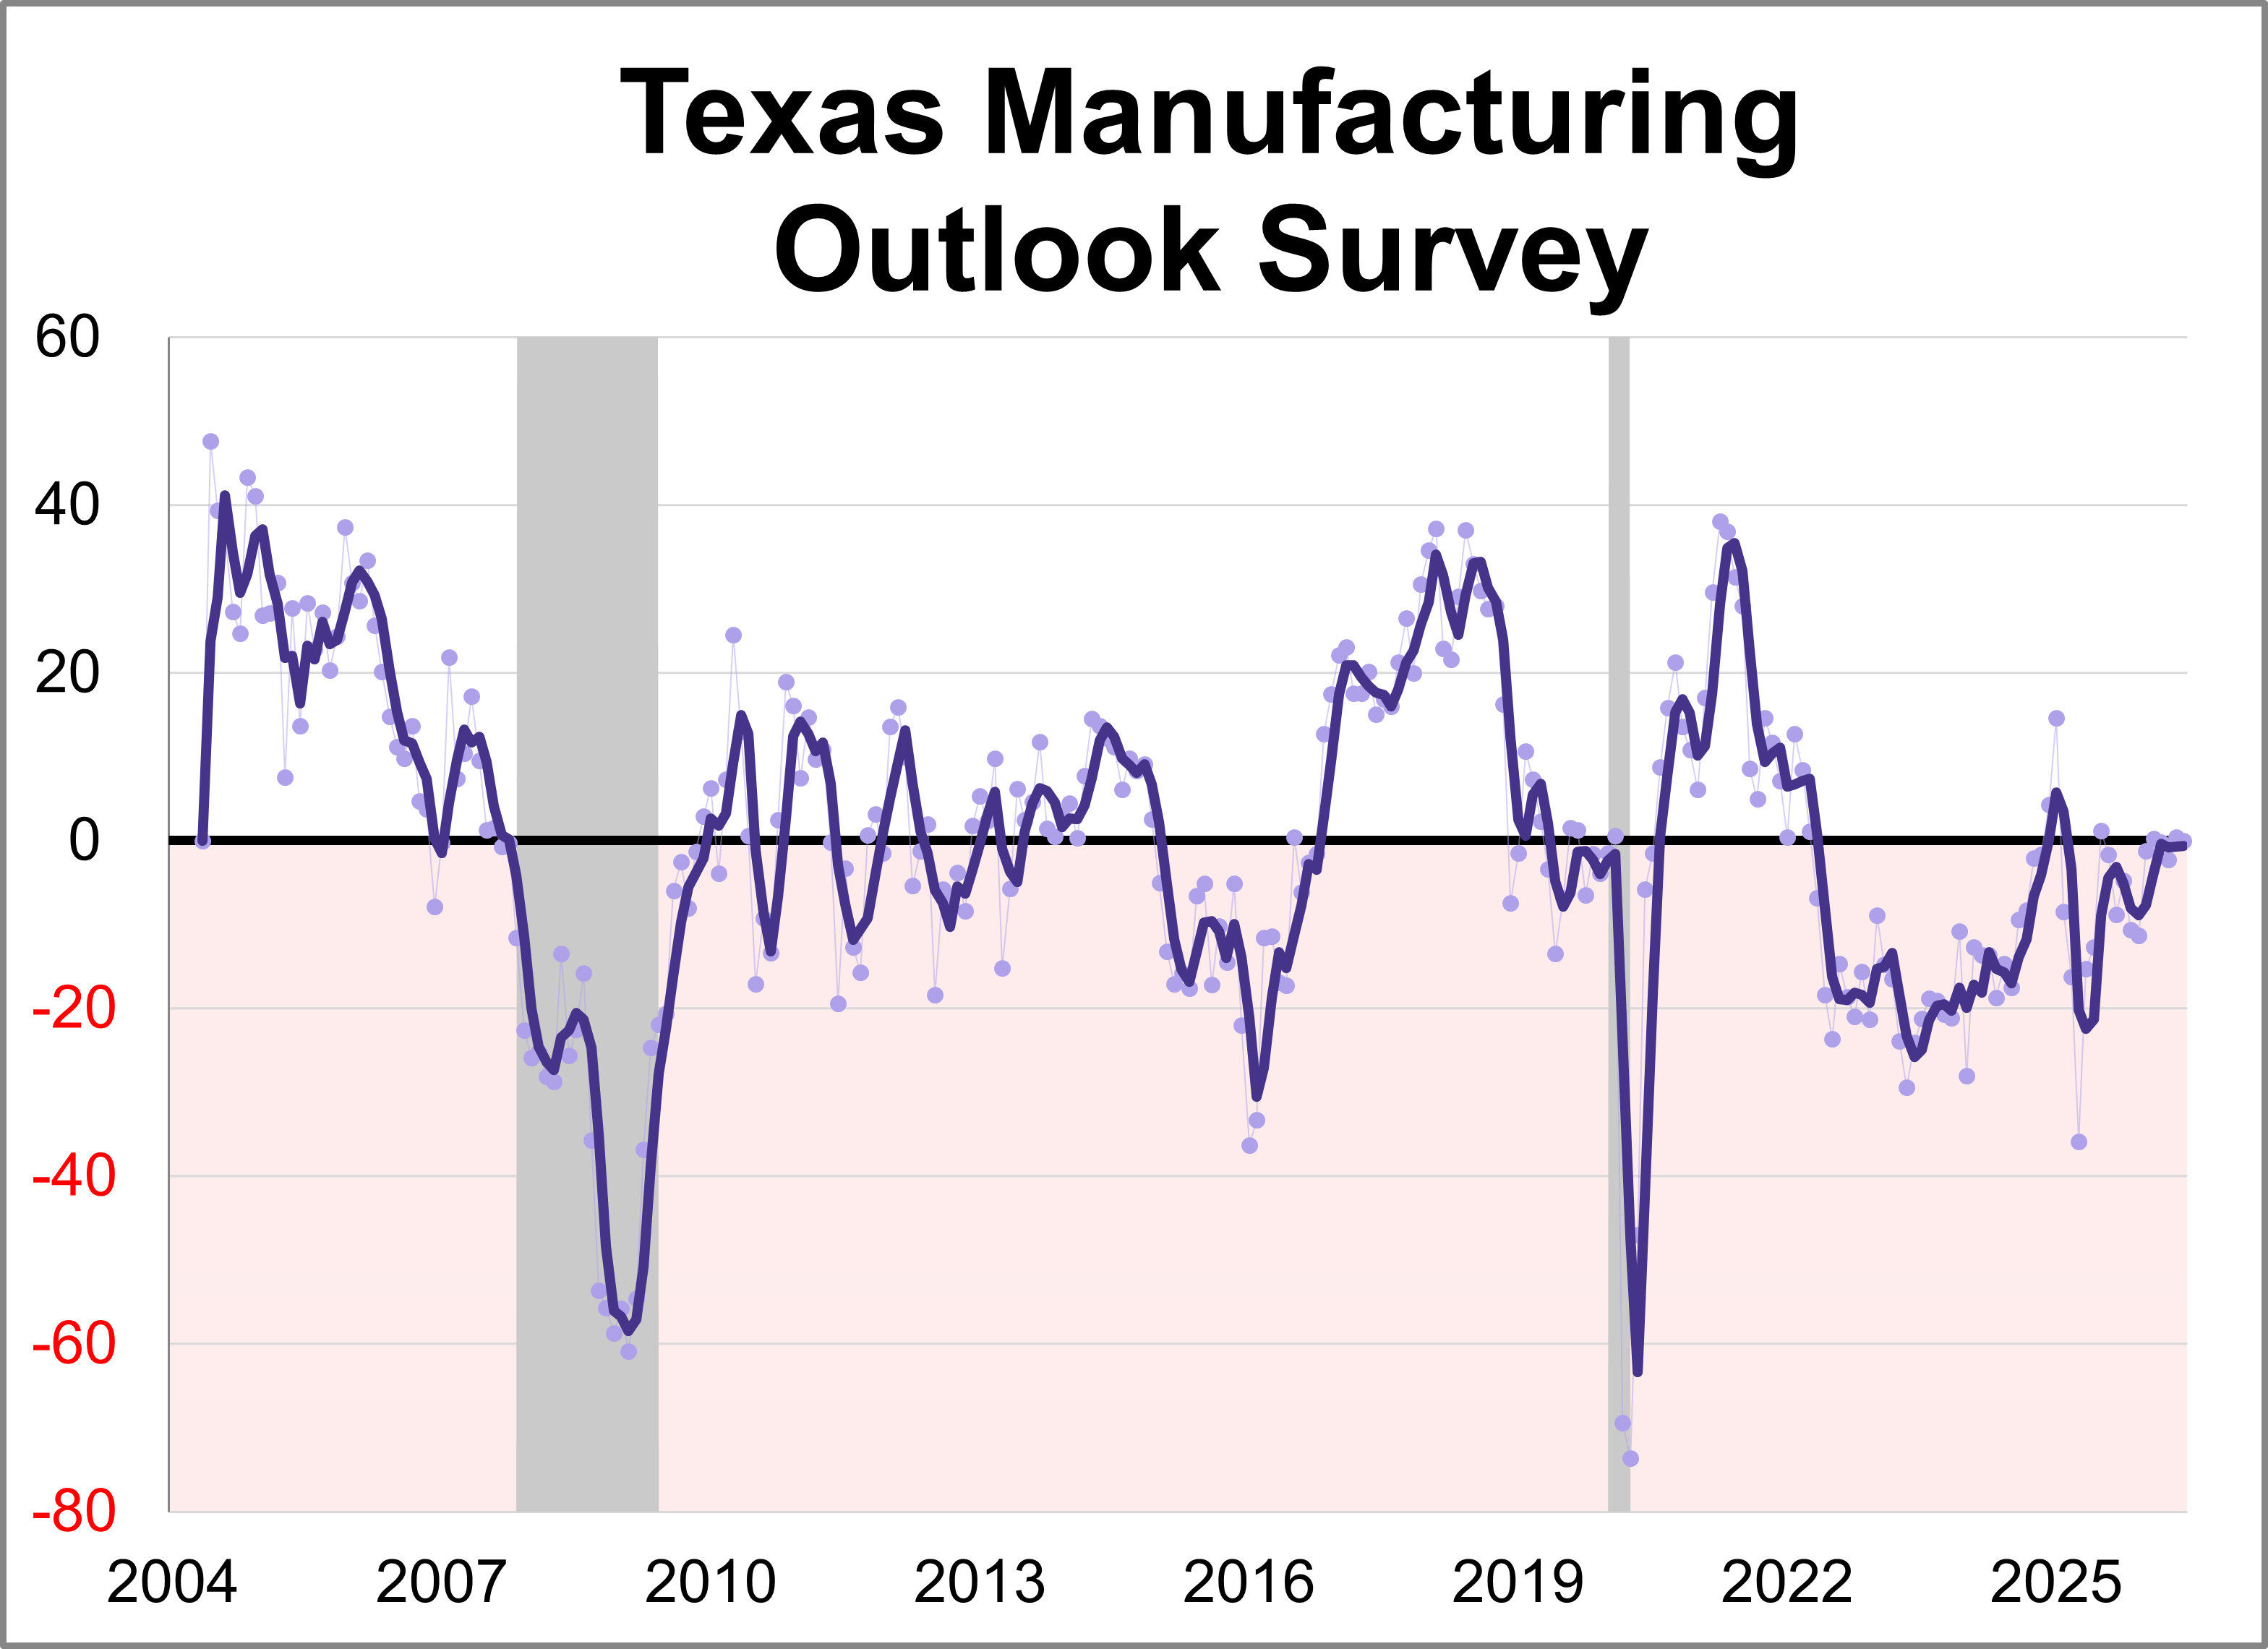
The Dallas Fed released its Texas Manufacturing Outlook Survey (TMOS) for June. The general business activity index fell 0.4 points to 0.0, indicating slower growth of manufacturing activity and stable business conditions perceptions.
Last week’s data reaffirmed that inflation pressures remain the defining narrative across the economic landscape.
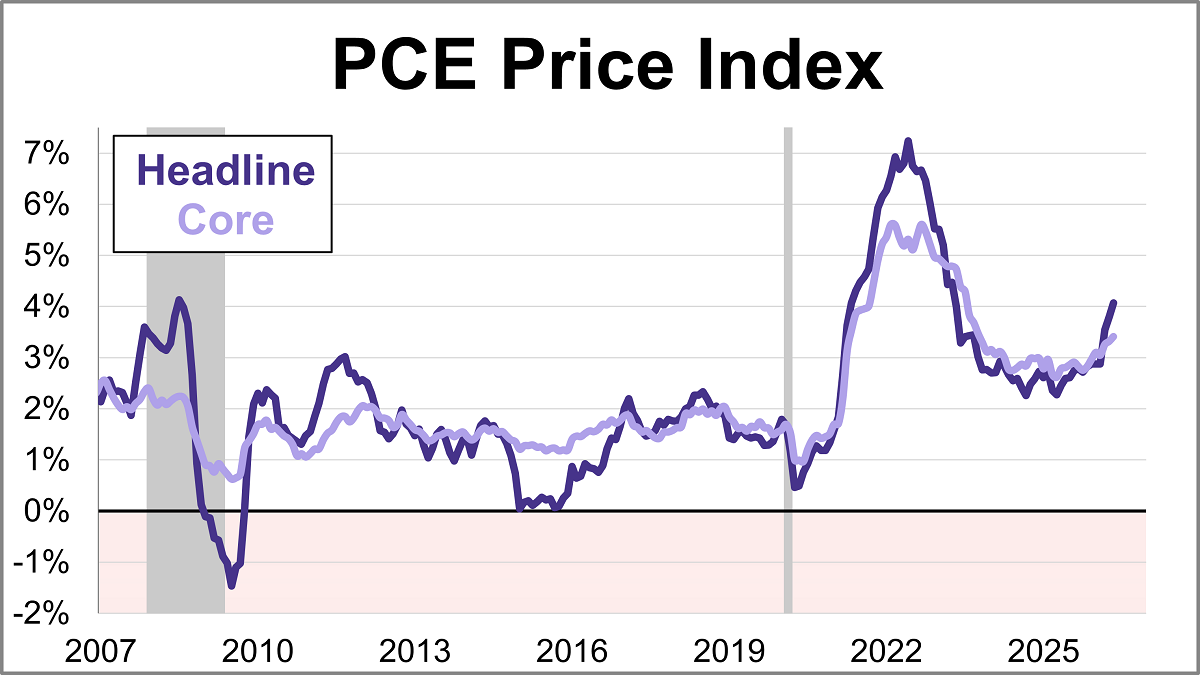
The Federal Reserve’s preferred inflation gauge, the core PCE price index, climbed 3.4% year-over-year in May. This marks the highest level since October 2023 and marks a pickup from April's 3.3% reading. On a monthly basis, core prices rose 0.3%.
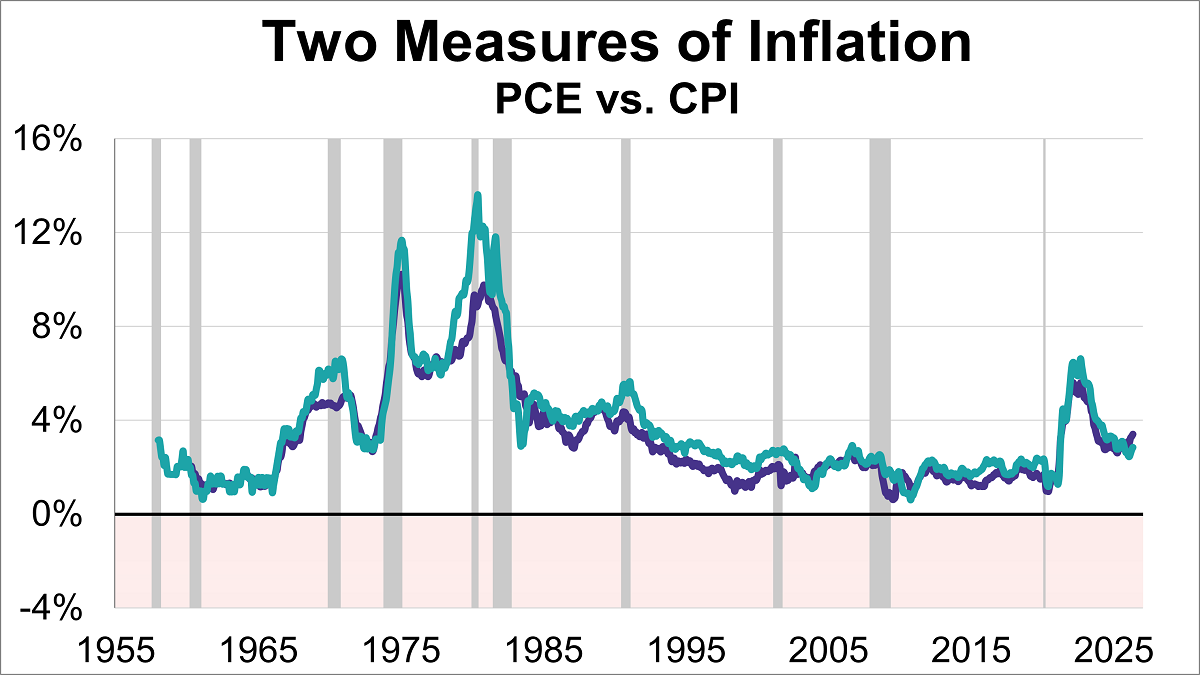
Inflation remains a hot topic, directly impacting everything from your grocery bill to interest rates. As of the latest data, two key inflation gauges — the Personal Consumption Expenditures (PCE) Price Index and the Consumer Price Index (CPI) — show that prices are still above the Federal Reserve's 2% target, with the core PCE at 3.4% and core CPI at 2.9%.
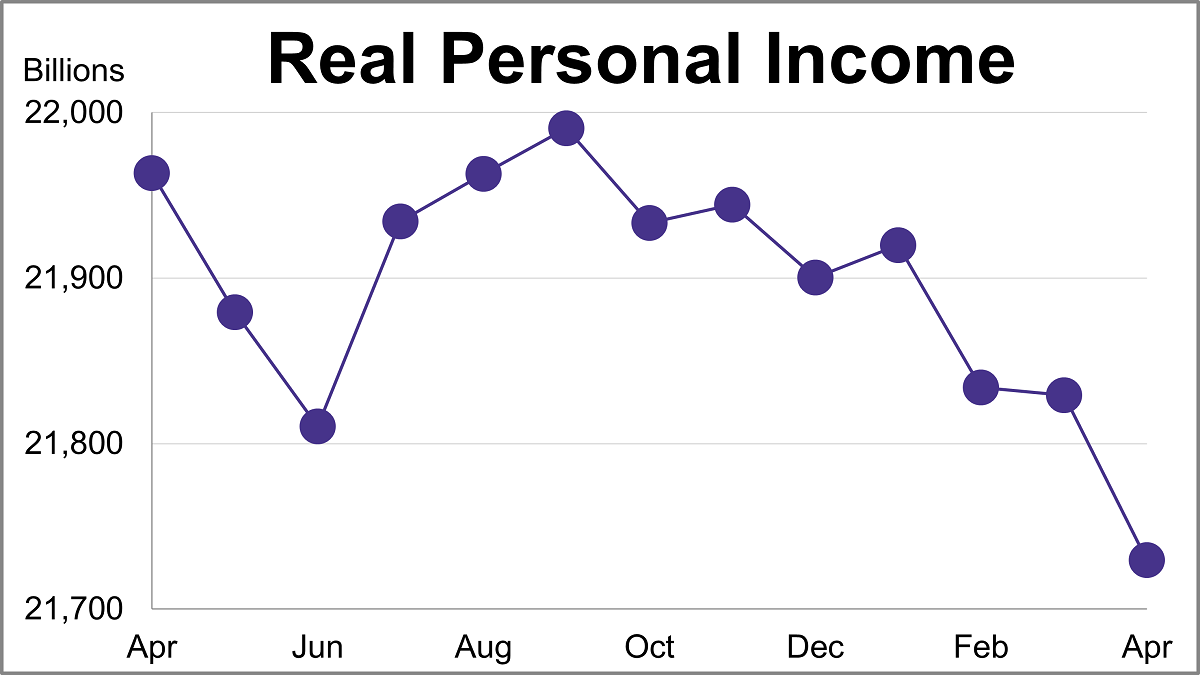
Personal income (excluding transfer receipts) was up 0.70% in May and was up 3.62% year-over-year. However, when adjusted for inflation using the BEA's PCE Price Index, real personal income (excluding transfer receipts) was up 0.25% month-over-month and down 0.43% year-over-year.
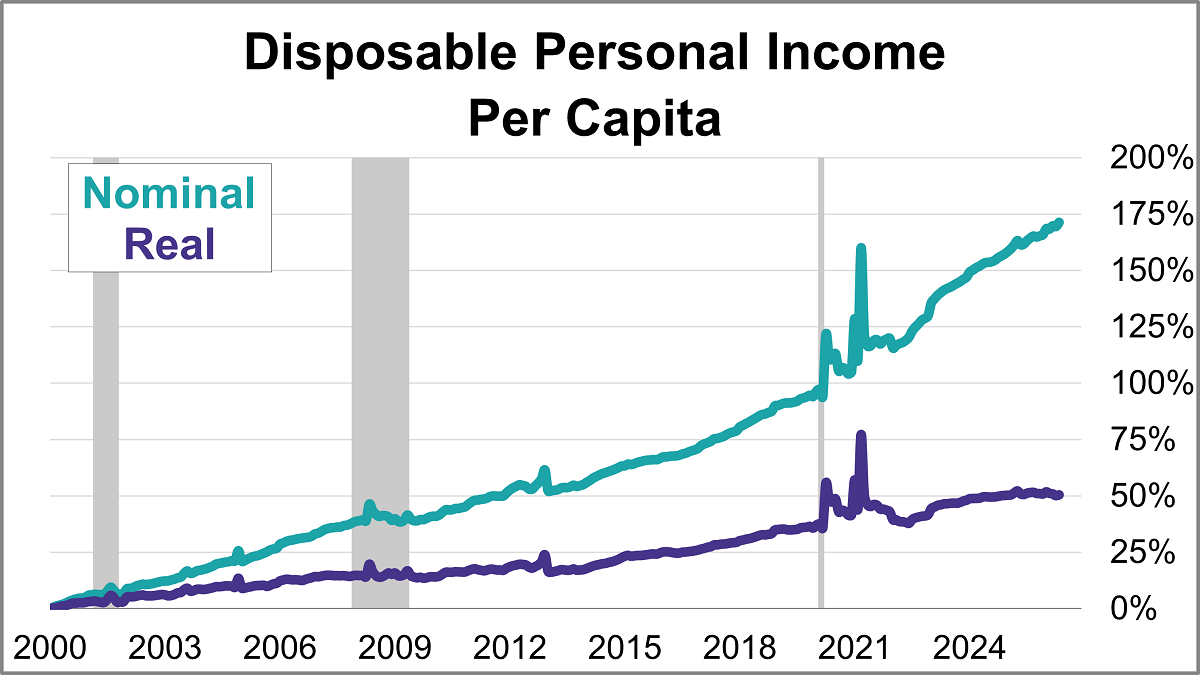
With the release of May's report on personal incomes and outlays, we can now take a closer look at "real" disposable personal income per capita. To two decimal places, disposable income per capita was up up 0.68% month-over-month. But when adjusted for inflation, real disposable income per capita was up 0.23%.
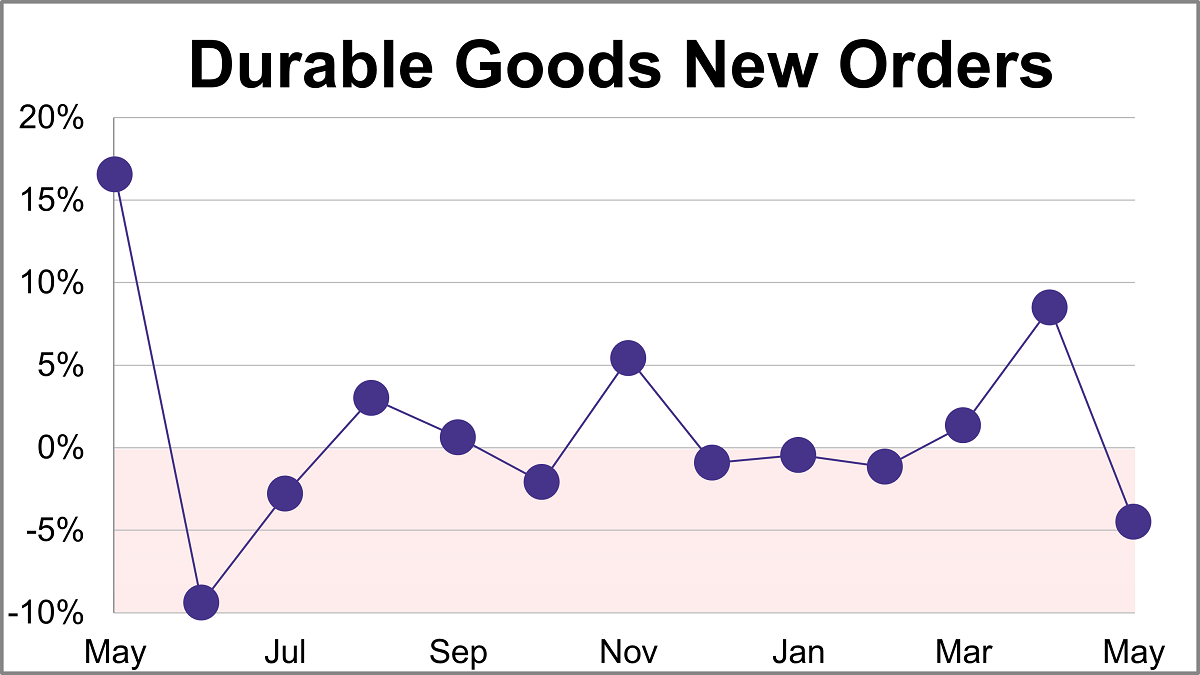
New orders for manufactured durable goods sank 4.5% in May to $332.05B, slightly less than the projected 5.0% monthly decline.
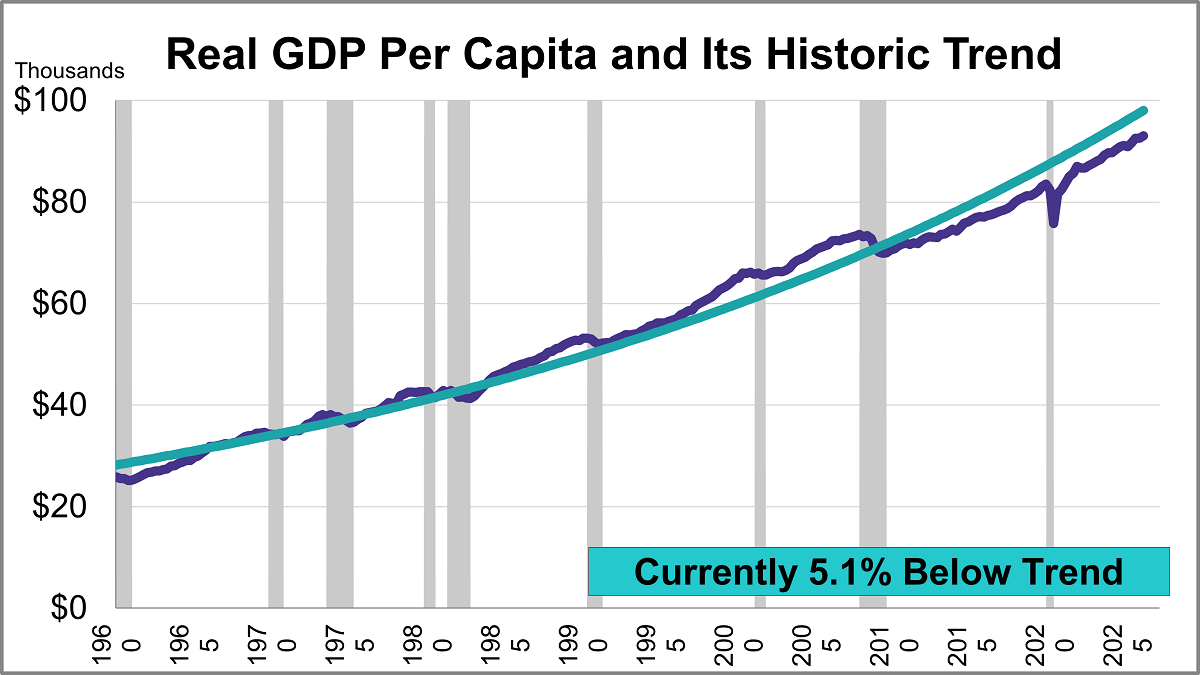
The third estimate for Q1 GDP came in at 2.09%, an acceleration from 0.48% for the Q4 final estimate. With a per-capita adjustment, the headline number is lower at 1.91%, a pickup from 0.18% for the Q4 headline number.
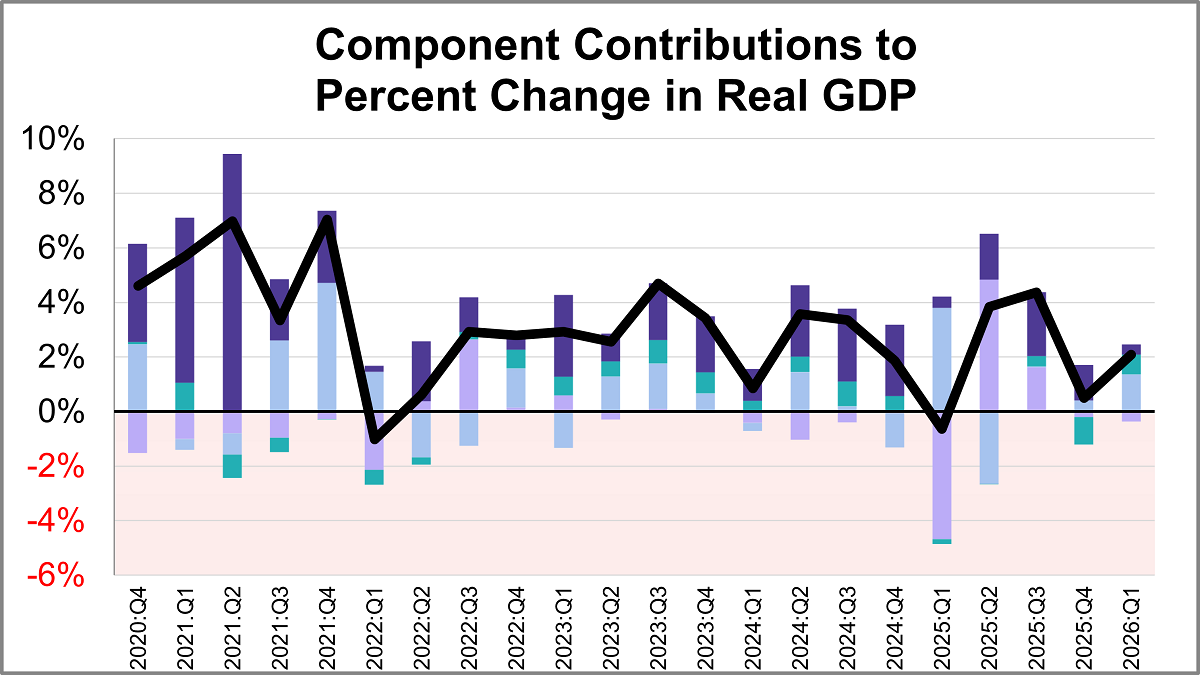
Real gross domestic product (GDP) is comprised of four major subcomponents. In the Q1 2026 GDP third estimate, three of the four components made positive contributions.
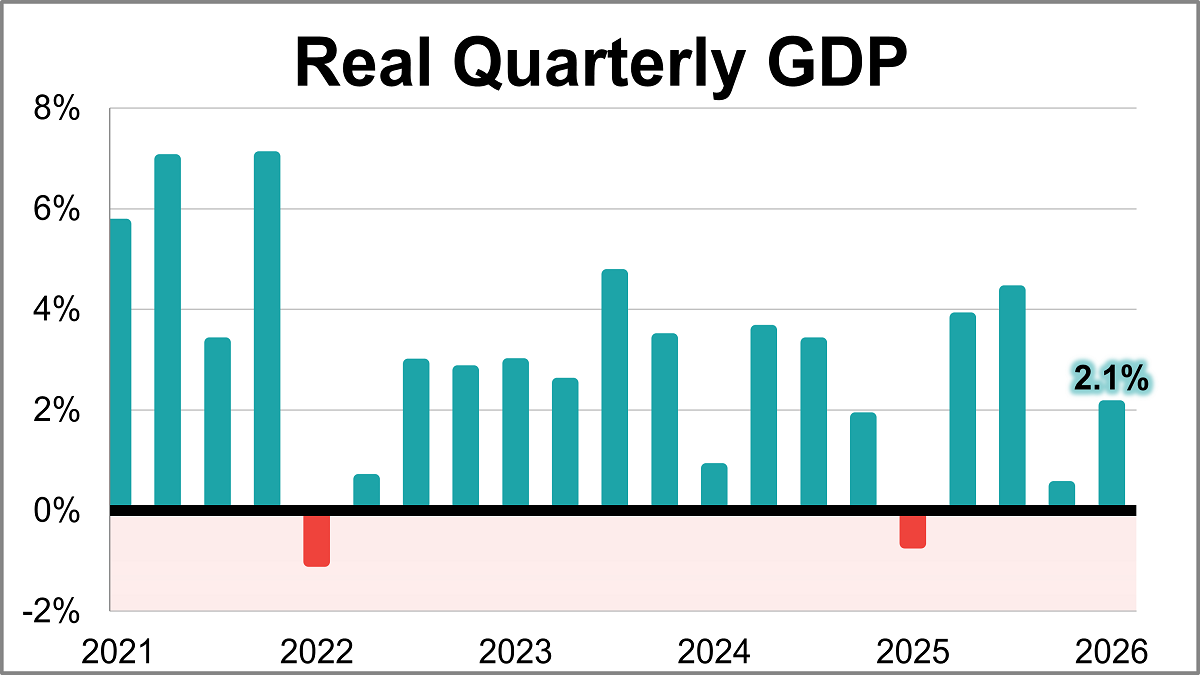
U.S. economic growth rebounded at the beginning of 2026, according to the BEA’s latest estimate. Real GDP rose at a 2.1% annual rate in Q1, exceeding the 1.6% forecast and marking a sharp acceleration from the 0.5% final estimate seen in Q4 of last year.
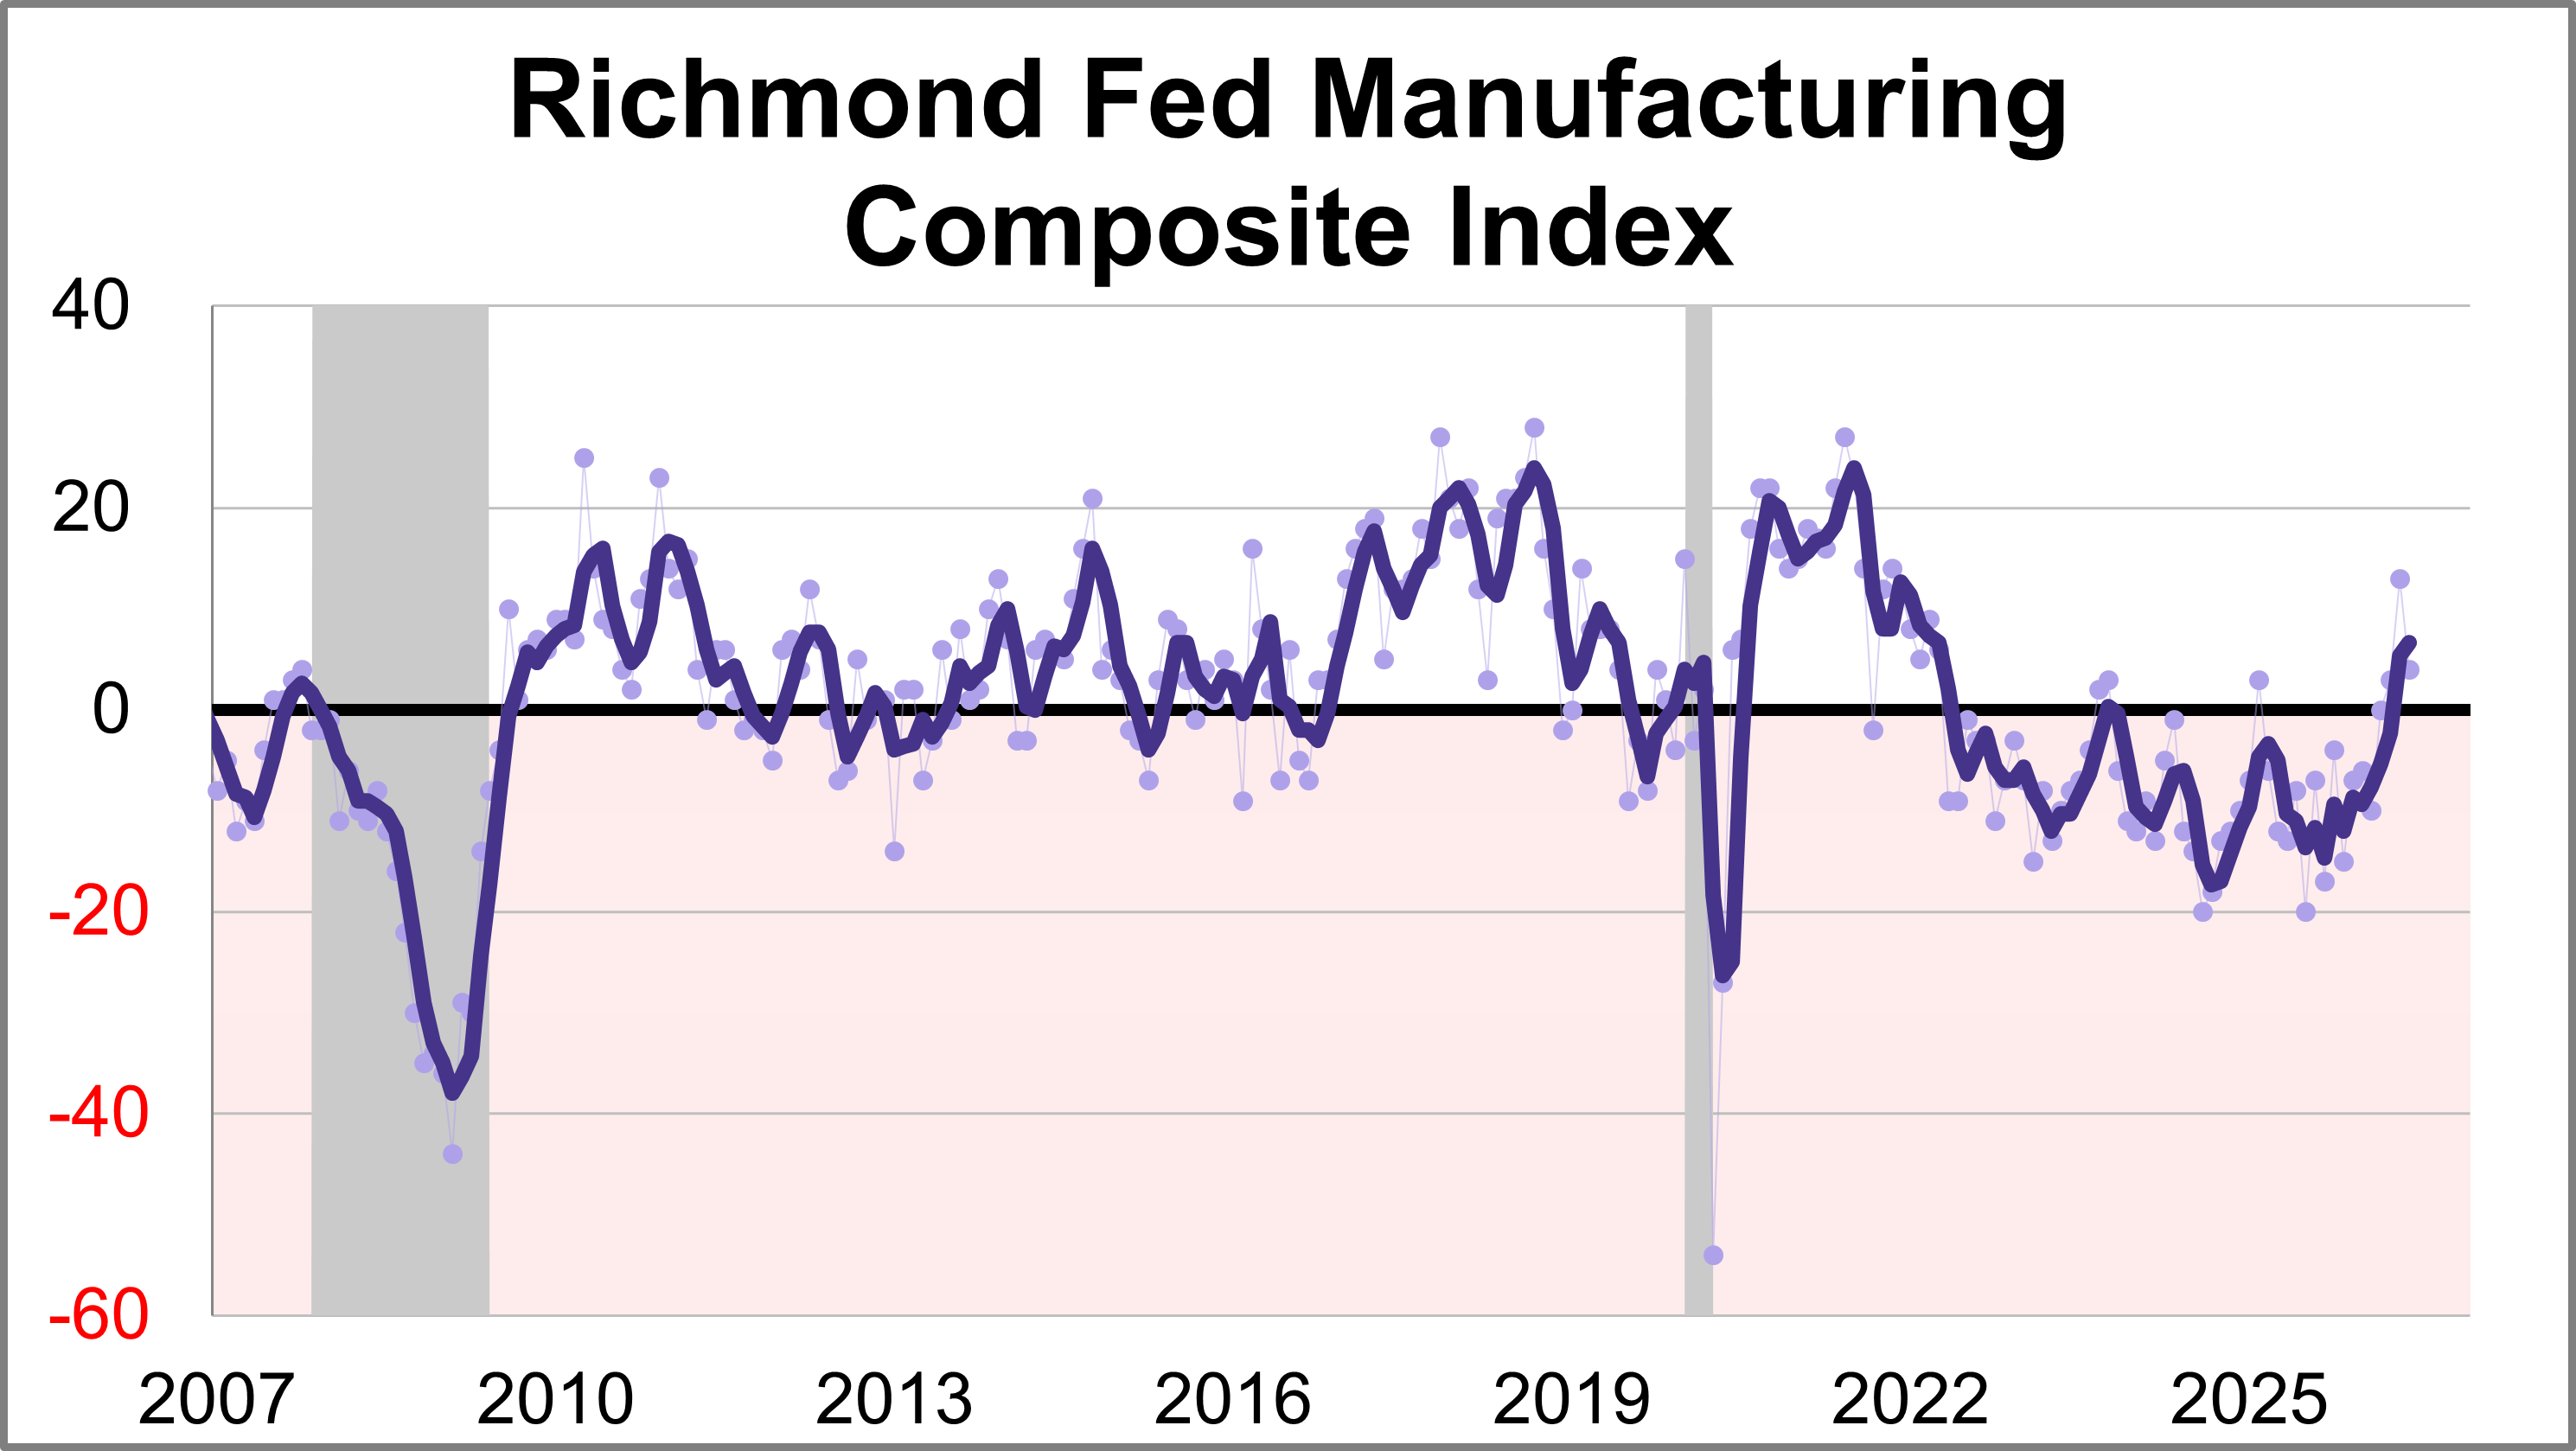
Fifth district manufacturing activity was flat in June, according to the most recent survey from the Federal Reserve Bank of Richmond. The composite manufacturing index fell nine points points to 4, marking the third consecutive positive reading. This month's reading was below the forecast of 8.
As the summer economic landscape takes shape, investors are navigating shifting monetary policy, stubborn inflation pressures, and unexpected market momentum. This week’s snapshot breaks down the most critical updates and data releases from the past week to give you a clear view of where the economy is heading.
In an effort to streamline retirement income planning, MassMutual Strategic Distributors has launched a behavioral framework.
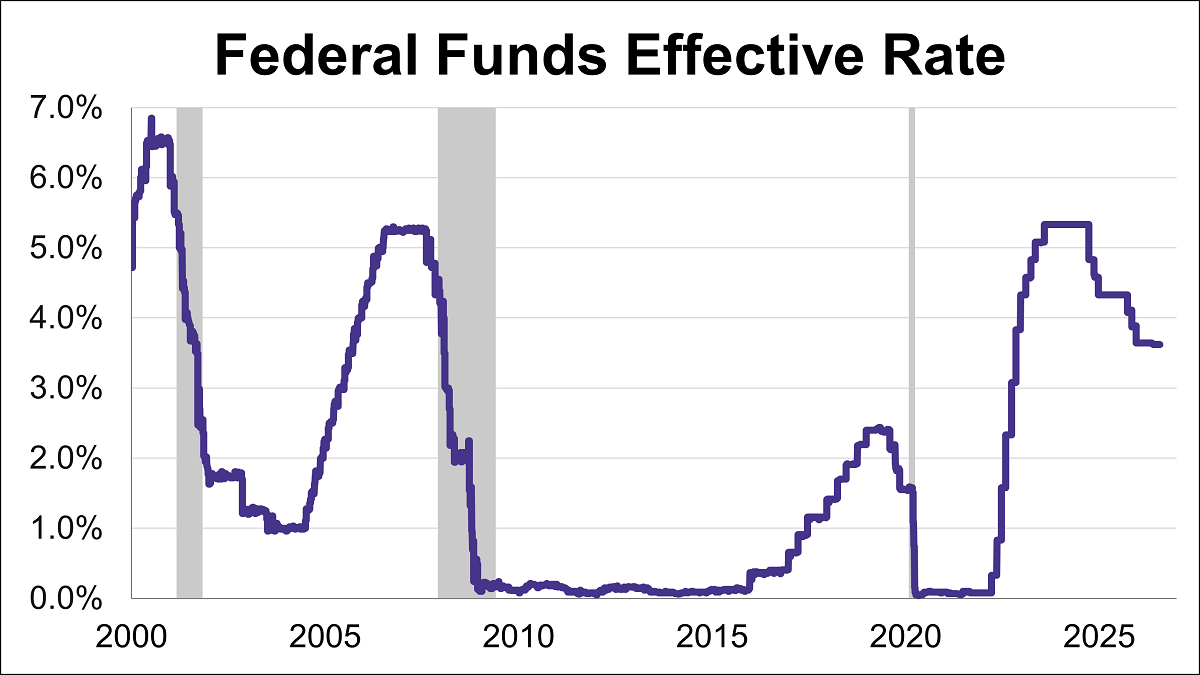
The Federal Reserve concluded its fourth meeting of the year by holding the federal funds rate (FFR) steady in the 3.50%-3.75% range.
A massive advisor retirement wave is reshaping wealth management. Discover how $2.5 trillion in assets may fuel industry transformation.
The U.S. economy faced intensifying headwinds in May as both consumer and wholesale inflation metrics surged to multi-year highs.
With the latest CPI report showing that inflation is likely here to stay, it could be time to pivot towards ETFs with downside protection.
Several articles enjoyed strong performance during the month of May, though there does not seem to have been a unifying theme, unless it is pointing out mistaken beliefs or unexamined conventions.
The U.S. labor market took center stage last week as three major labor market indicators outperformed forecasts. Robust payroll additions in both the public and private sectors, paired with a massive surge in job openings, point to a workforce on solid footing.
Ride the momentum wave. Discover how tech-fueled factors propelled momentum and high-beta ETFs to historic, benchmark-crushing gains.
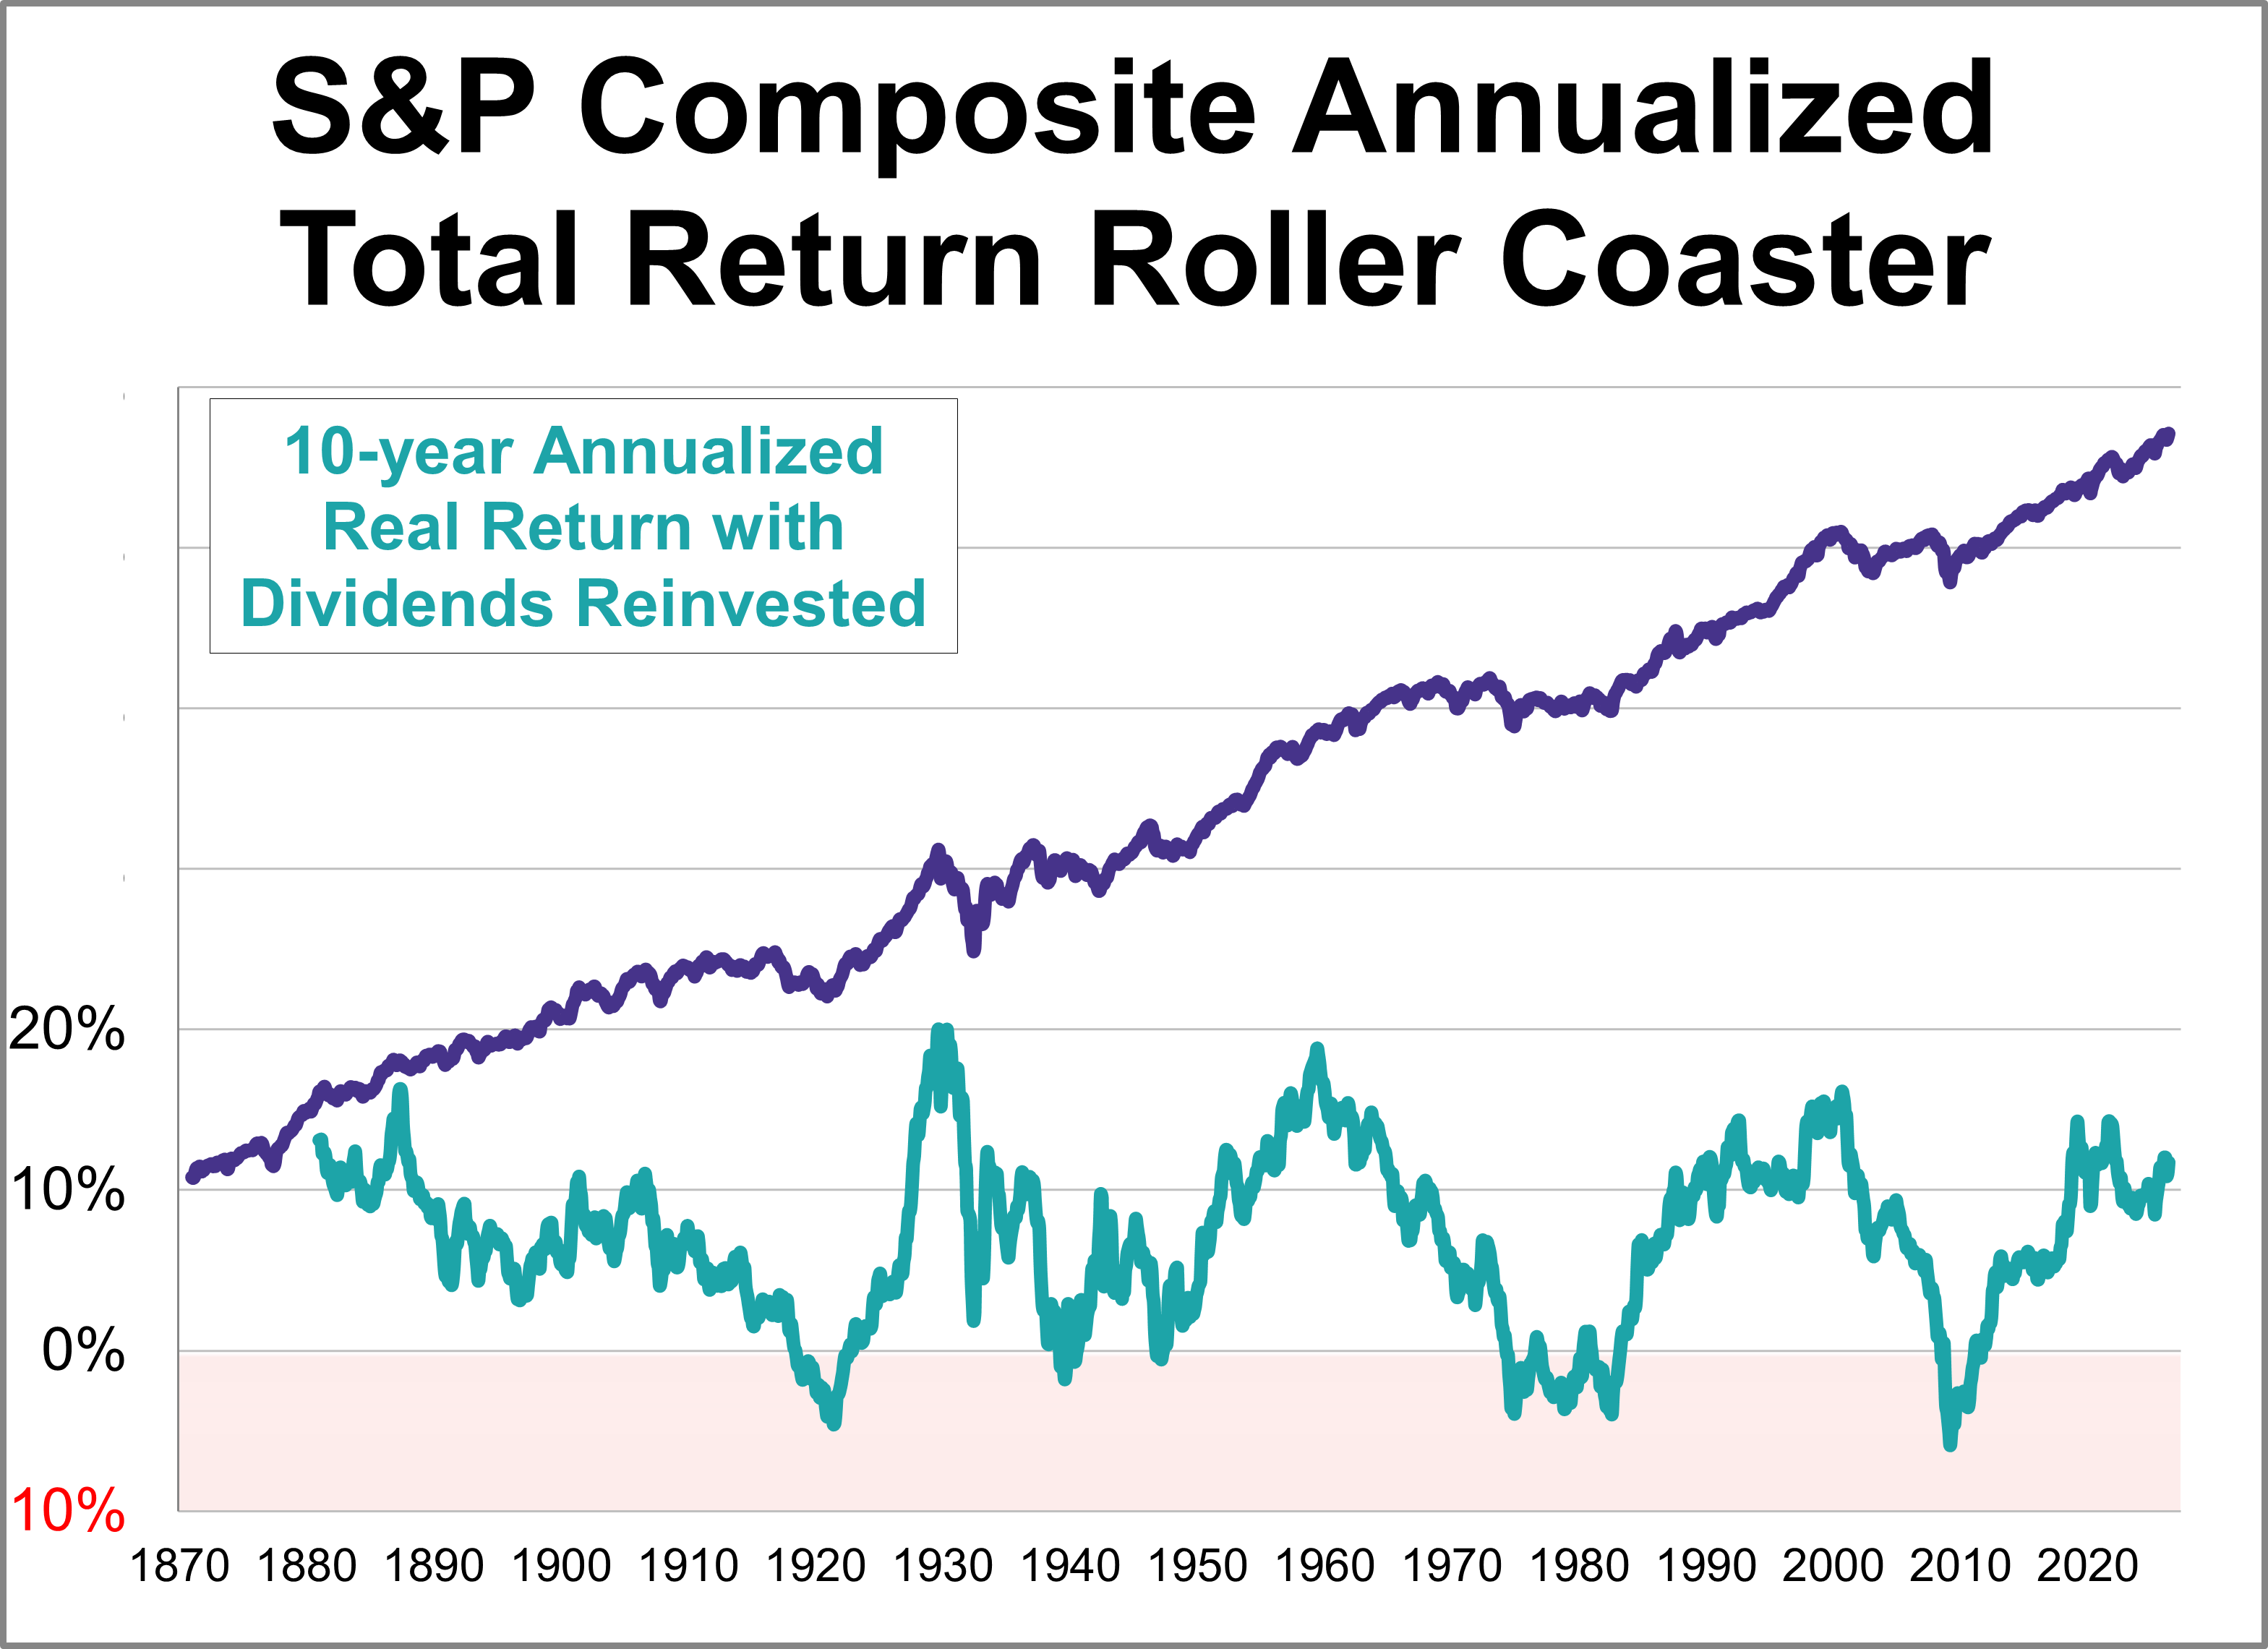
Here's an interesting set of charts that will especially resonate with those of us who follow economic and market cycles. Imagine that five years ago you invested $10,000 in the S&P 500. How much would it be worth today, with dividends reinvested but adjusted for inflation?
Closed-end funds may not be a hot topic right now, but they offer a highly compelling means to solve today's macroeconomic woes.
Last week’s data tracked a shifting economic trajectory over the last several months. While the latest reading on first-quarter GDP confirms the economy started the year with steady growth, subsequent inflation metrics moved higher and ultimately weighed on consumer confidence.
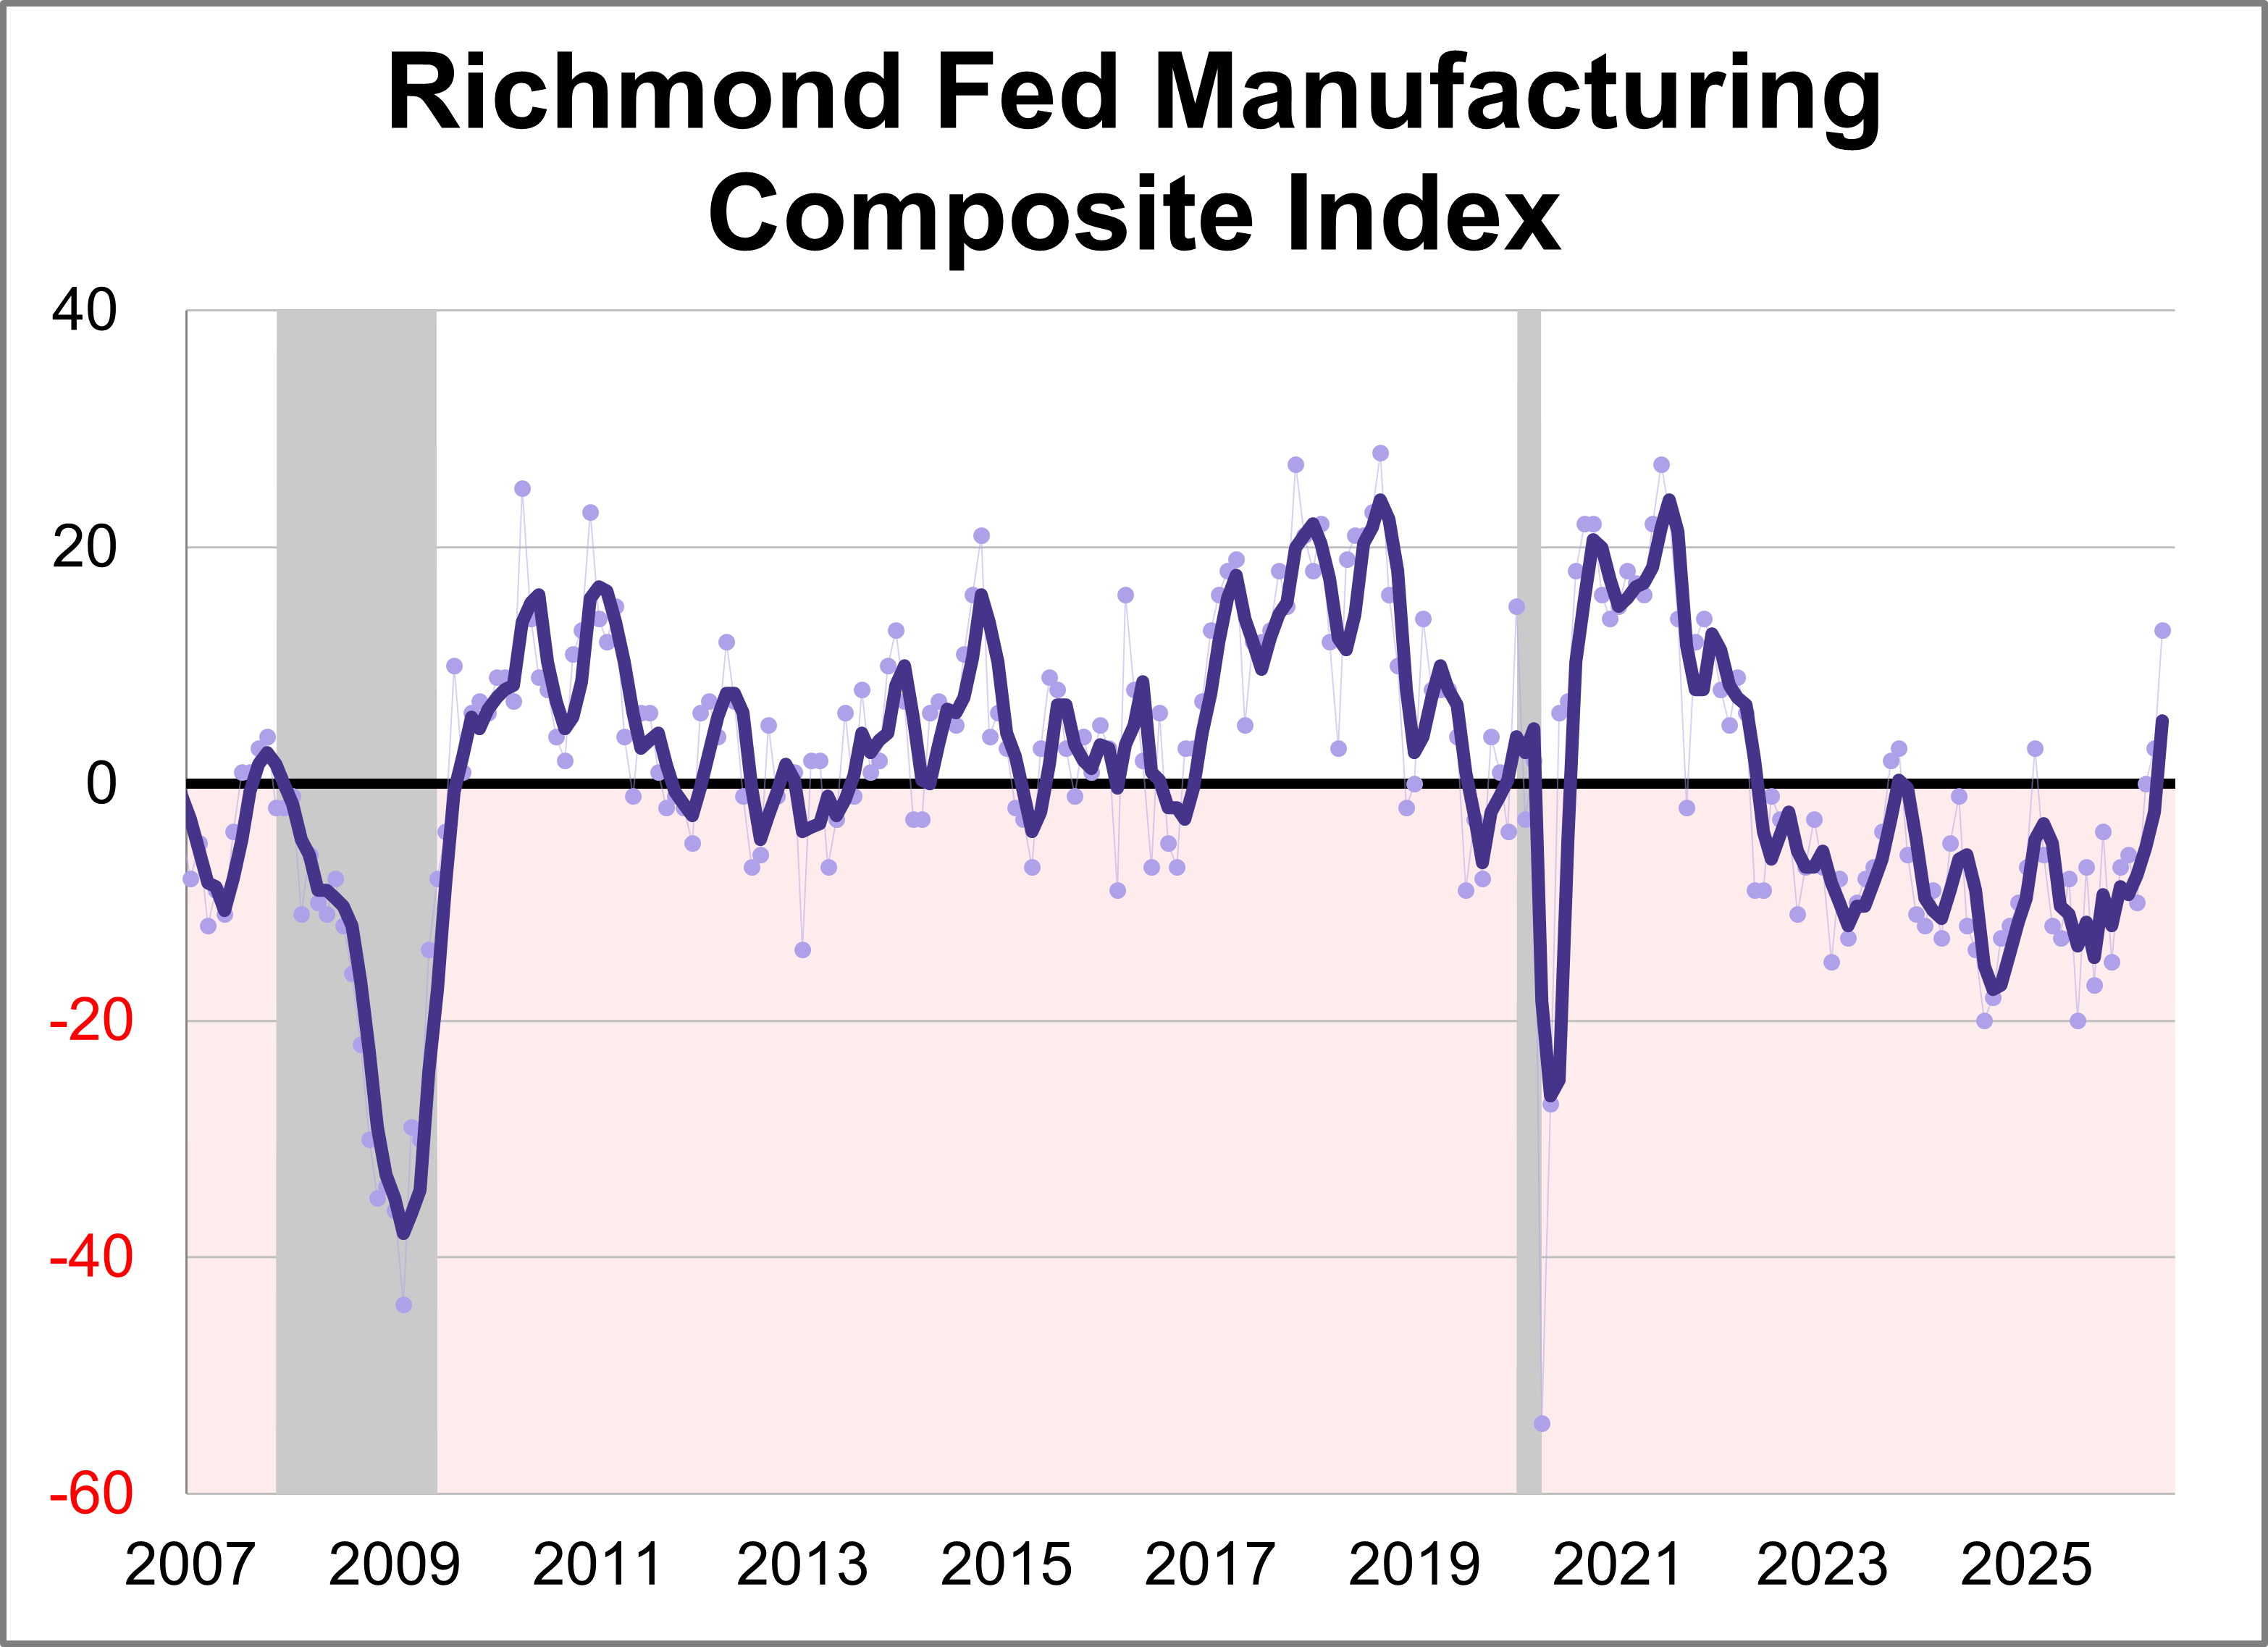
Fifth district manufacturing activity increased in May according to the most recent survey from the Federal Reserve Bank of Richmond. The composite manufacturing index rose ten points points to 13, marking the highest level in nearly five years. This month's reading was above the forecast of 4.
The Dallas Fed released its Texas Manufacturing Outlook Survey (TMOS) for May. The general business activity index rose 2.7 points to 0.4, indicating slower growth of manufacturing activity and stable business conditions perceptions.
There is currently a stark contrast between everyday consumer confidence and financial market behavior. On one hand, persistent inflation and elevated living costs have driven consumer sentiment to historic lows. On the other hand, financial market participants are exhibiting aggressive risk appetite, with margin debt surging to an all-time high record on the heels of major equity market gains.
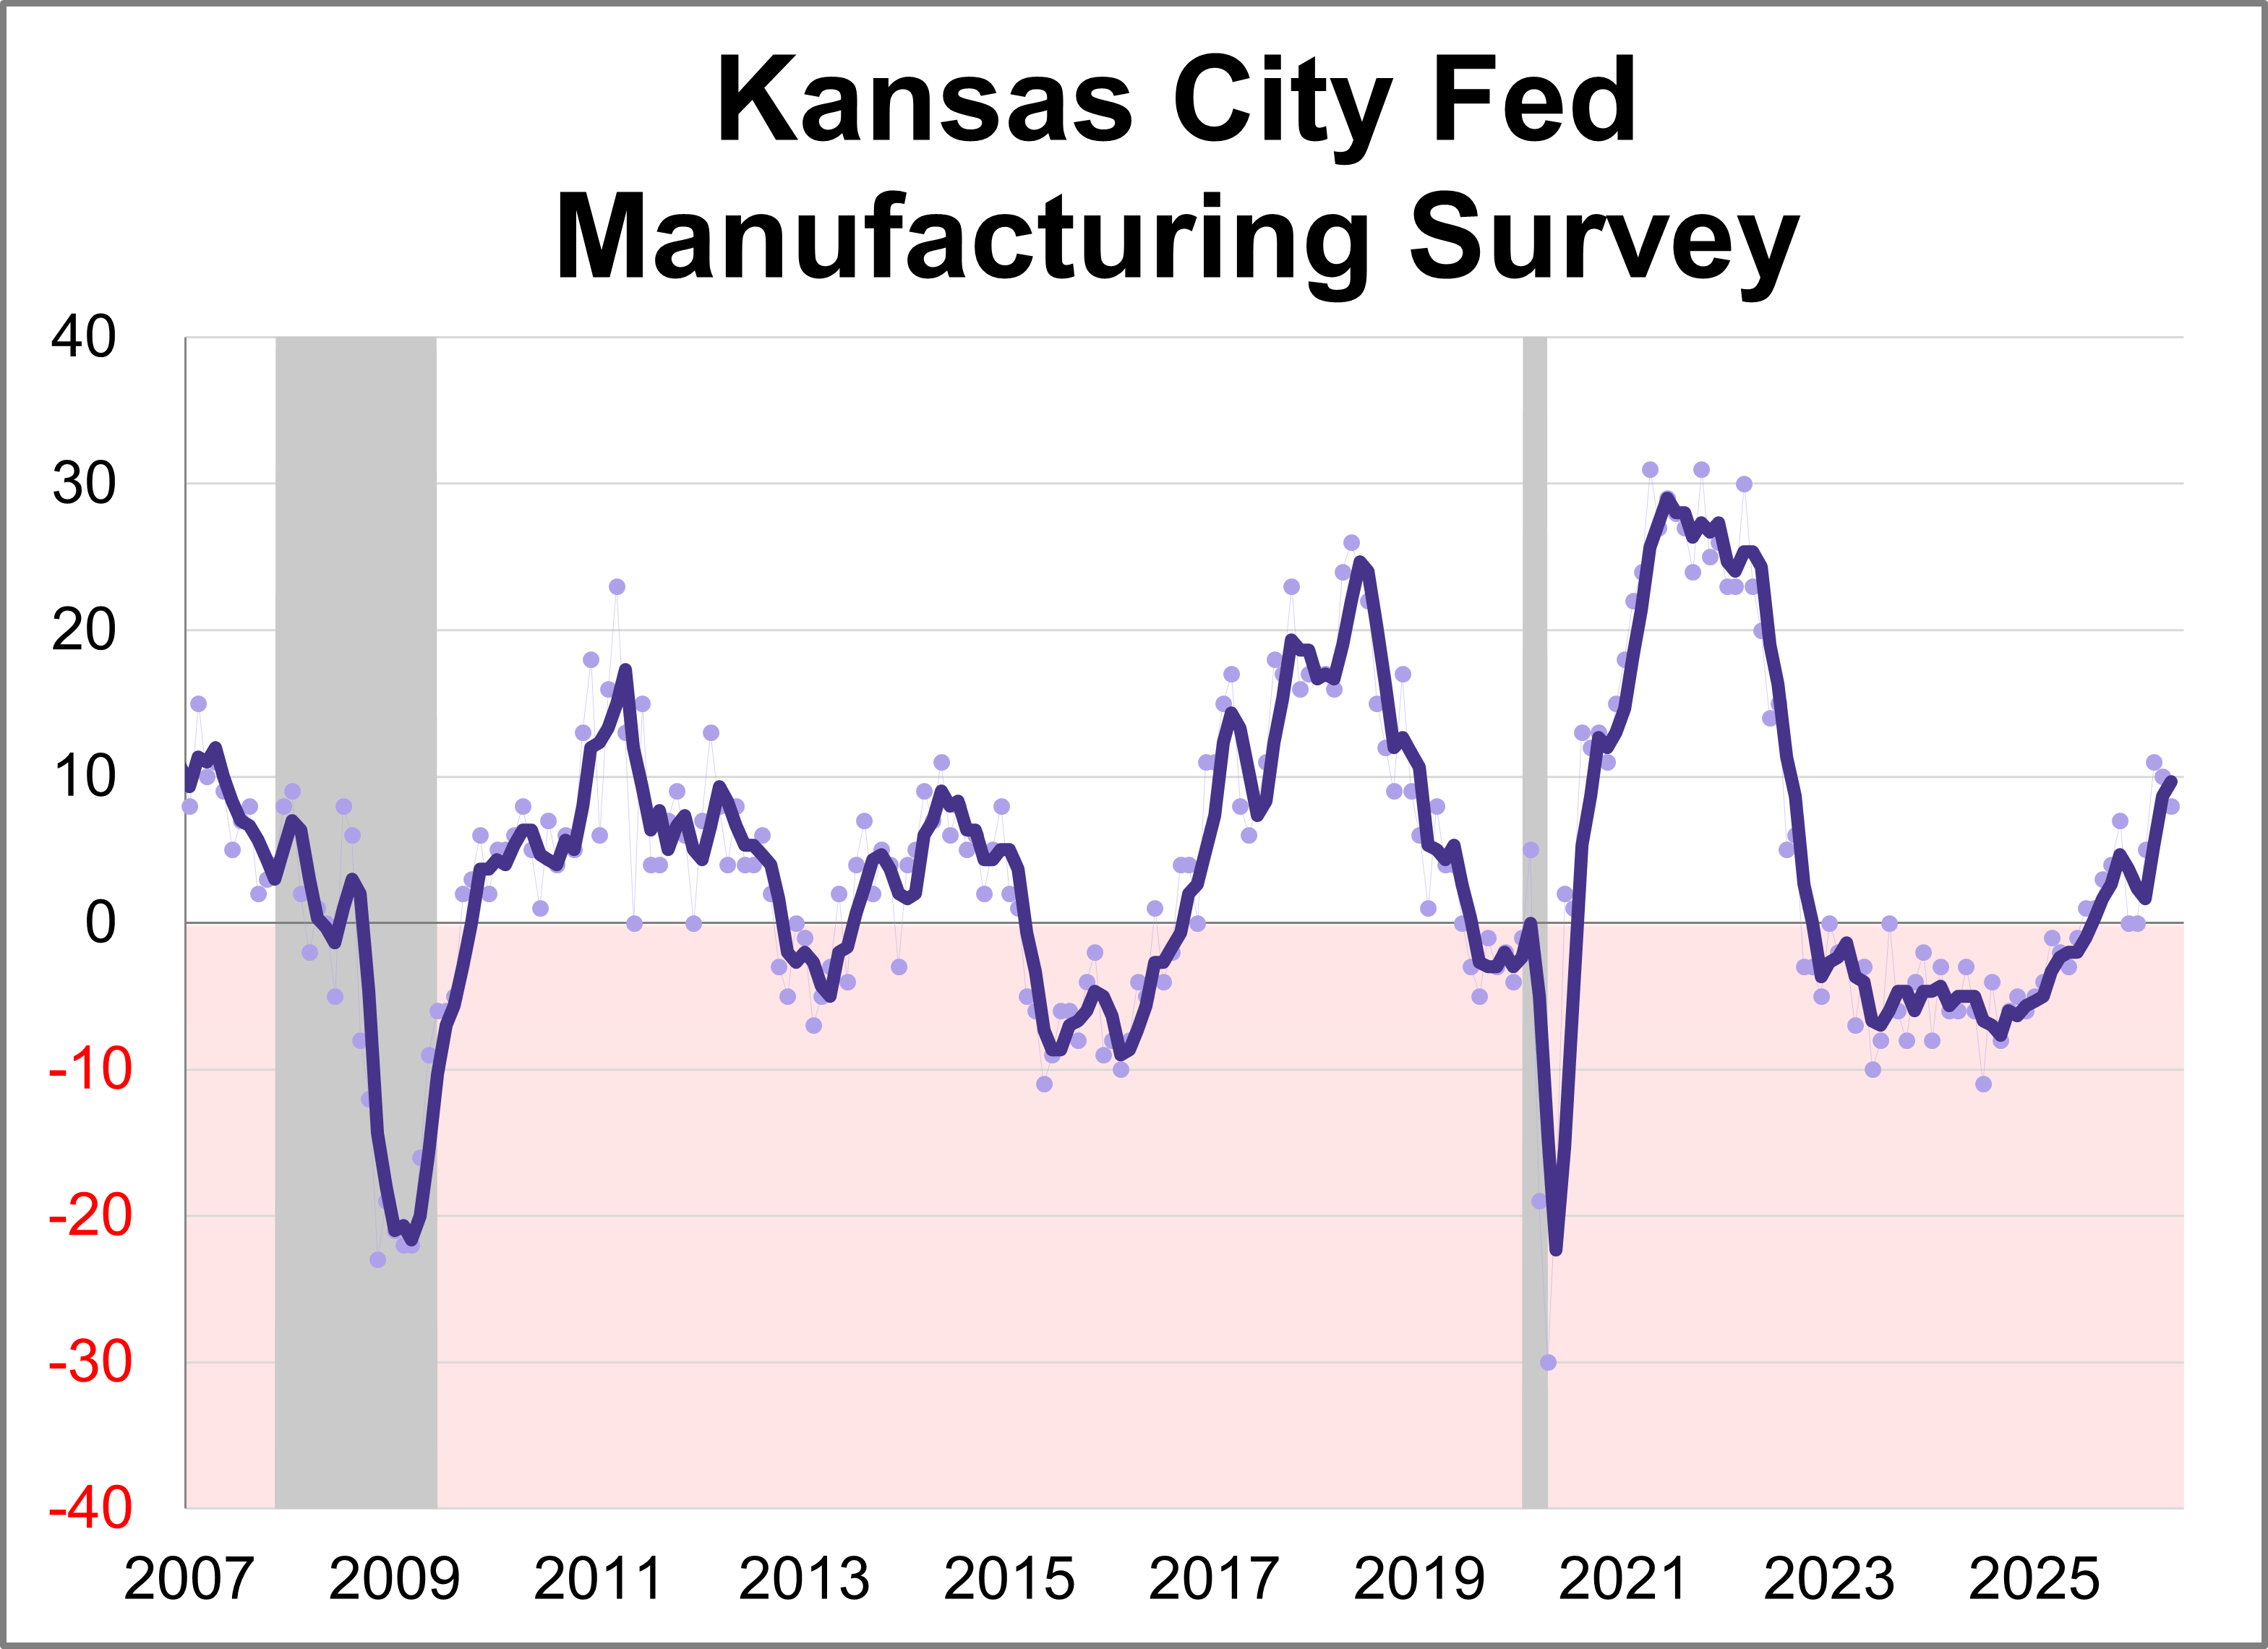
The Kansas City Fed Manufacturing Survey revealed regional activity continued to increase in May. The composite index came in at 8 this month, down slightly from 10 in April but still indicating continued expansion.
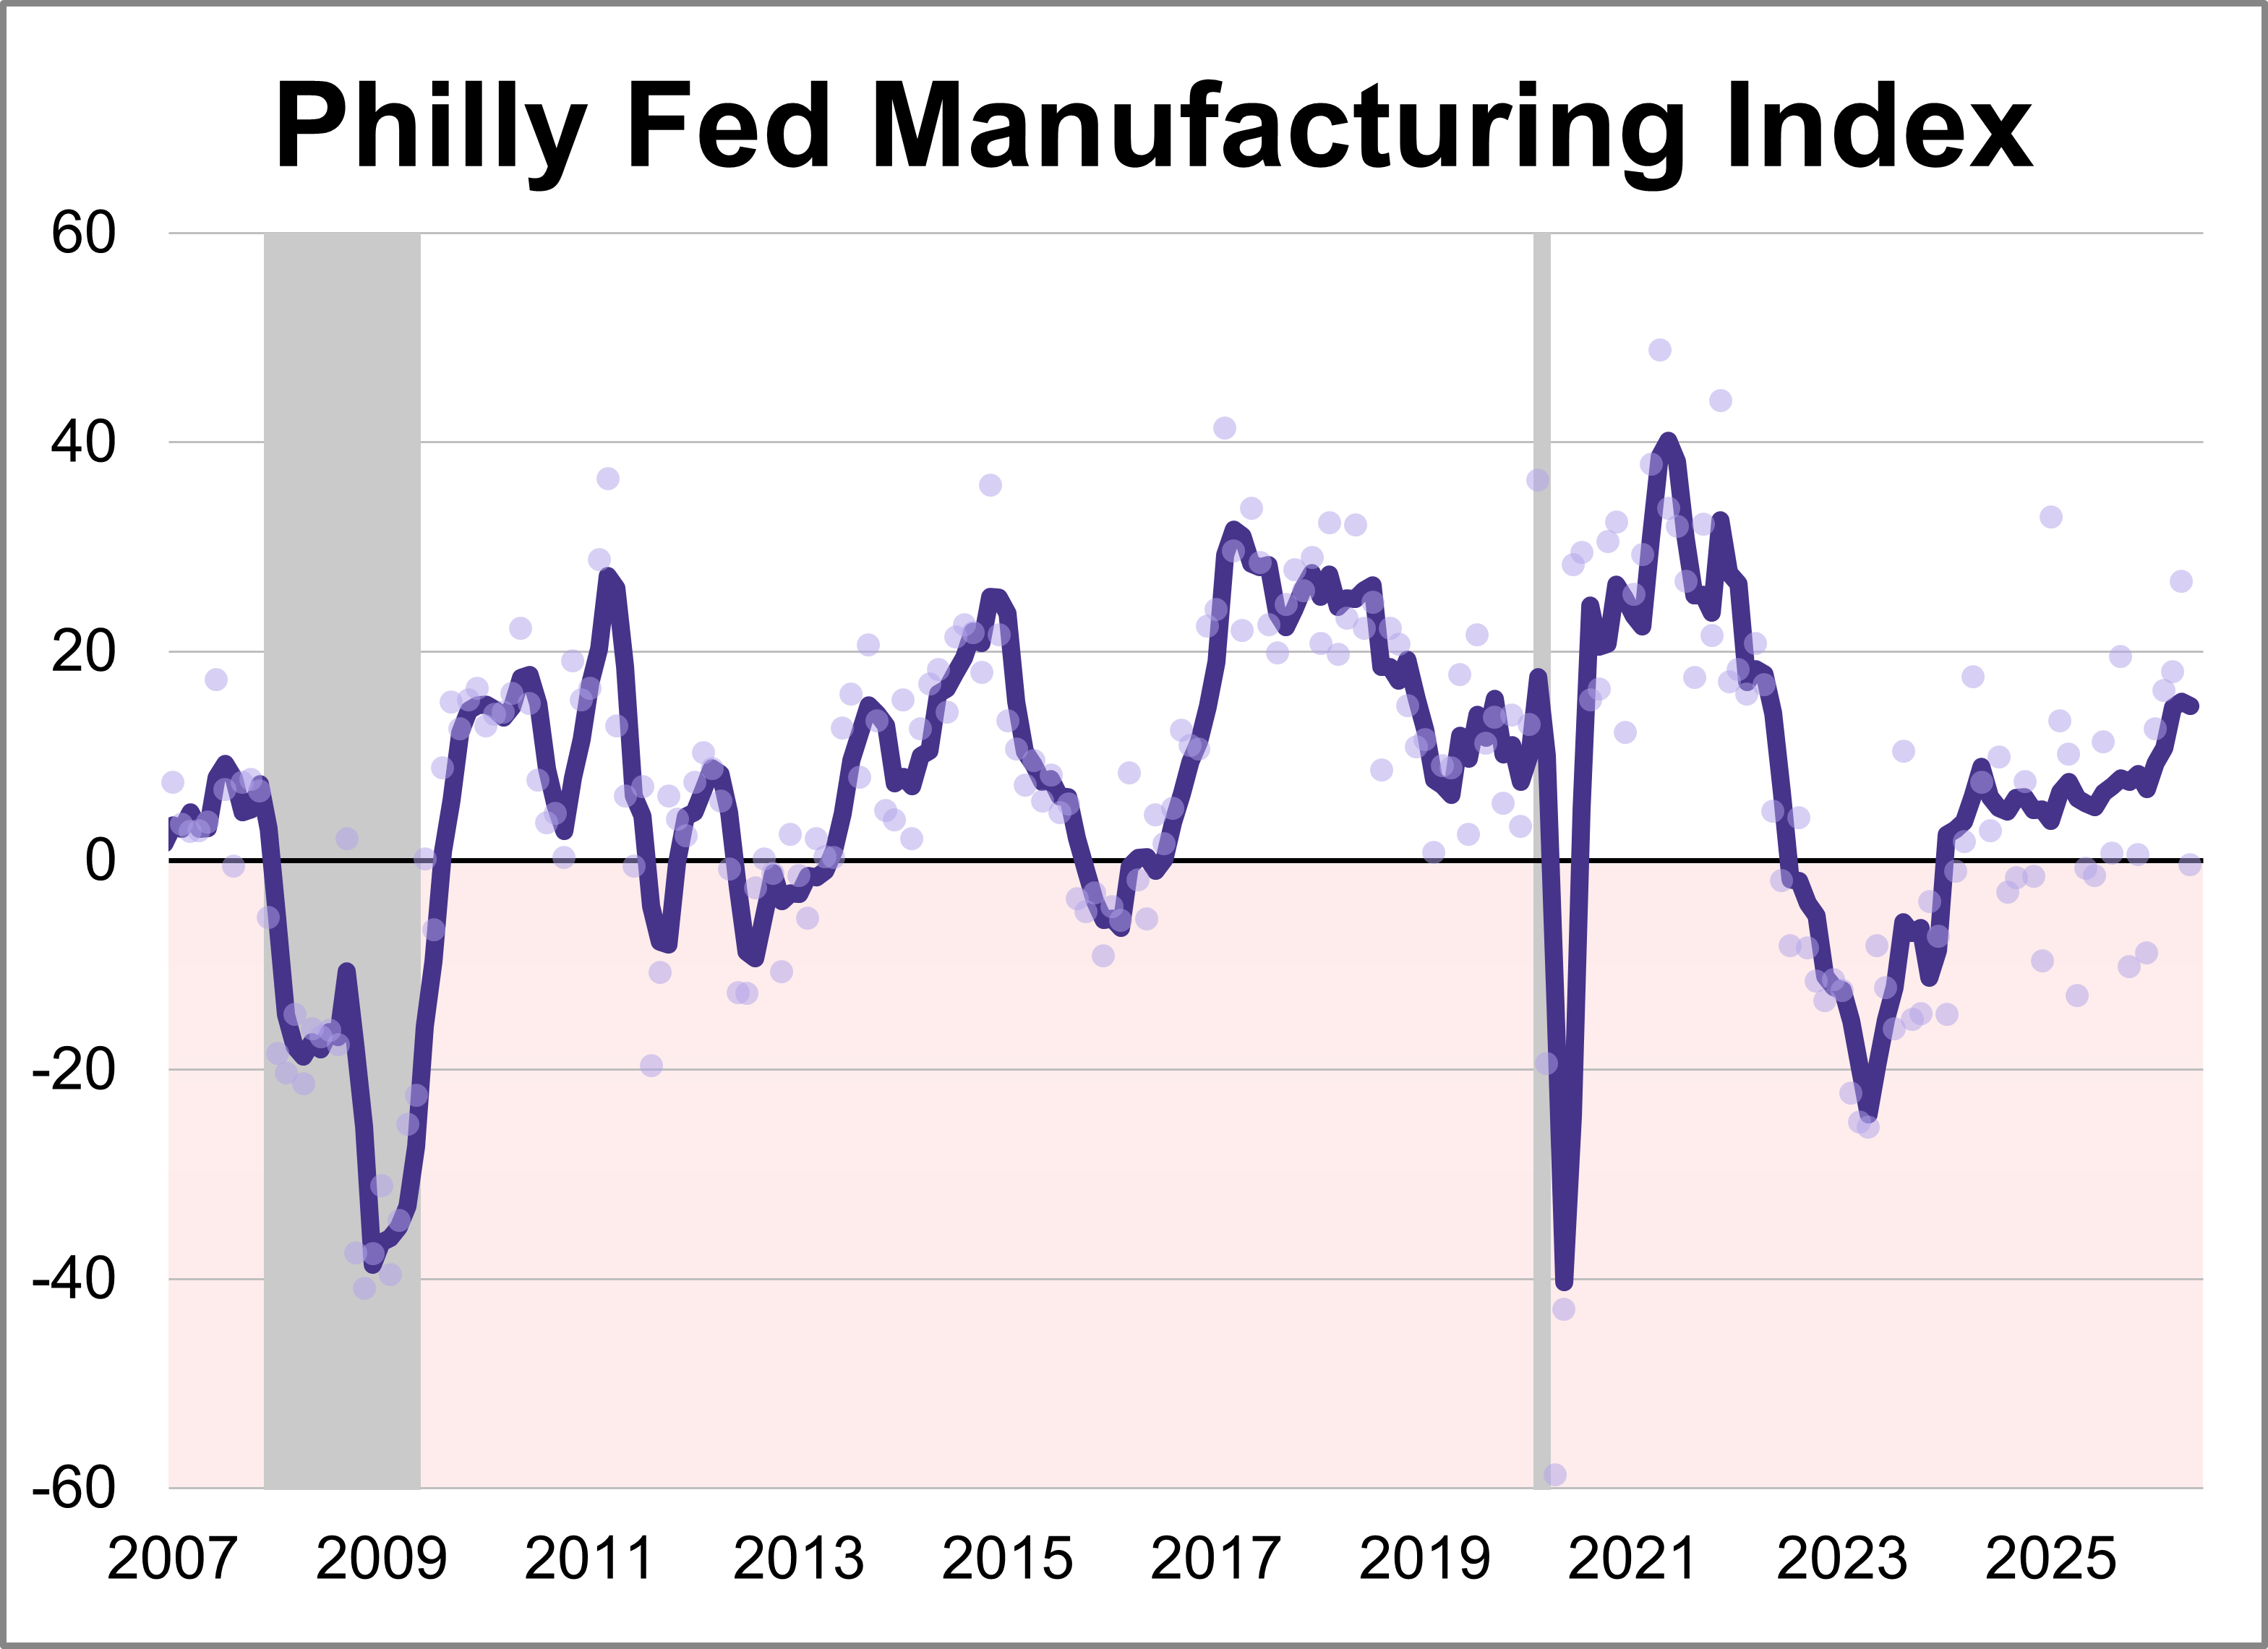
The latest Philadelphia Fed manufacturing index showed activity weakened in May, with the index sinking 27.1 points to -0.4. The latest reading marked the lowest level for the index this year and was worse than the forecast of 17.6.
As inflation lingers and market dynamics shift, advisors are rethinking the 60/40 portfolio with managed futures and options income ETFs.