VettaFi | Advisor Perspectives

S&P 500 Snapshot: Index Ends Choppy Week in the Red
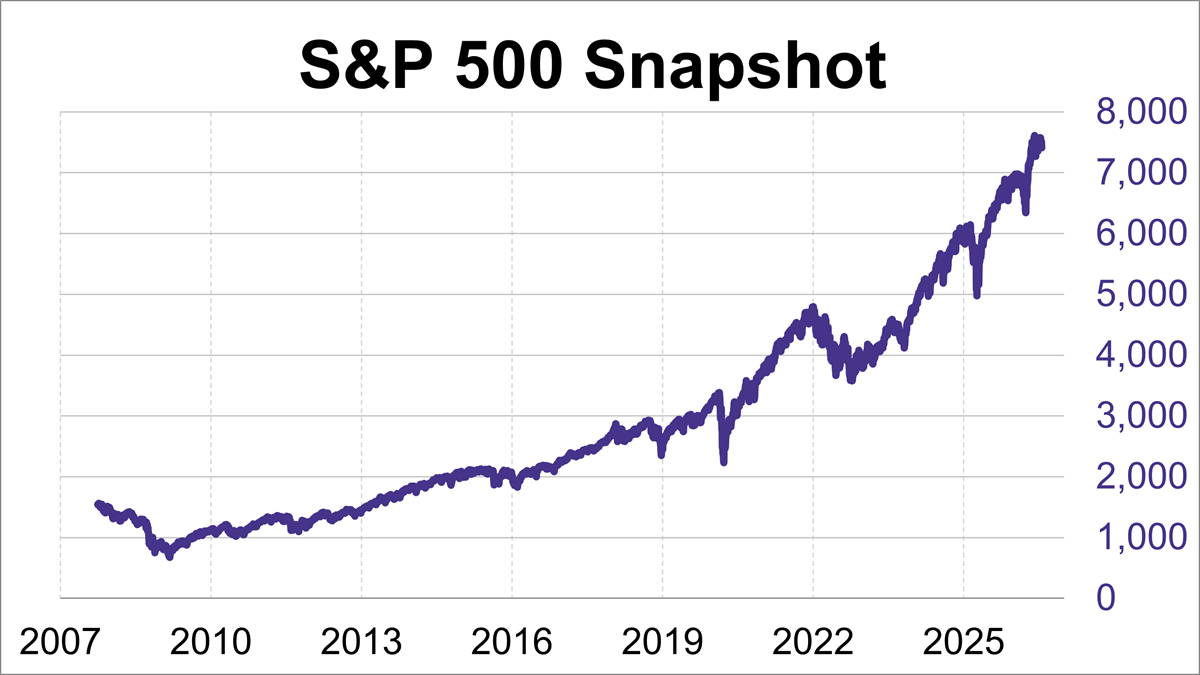
The S&P 500 ended its choppy week in the red, ultimately finishing with a loss of 0.6%.
Treasury Yields Snapshot: July 24, 2026
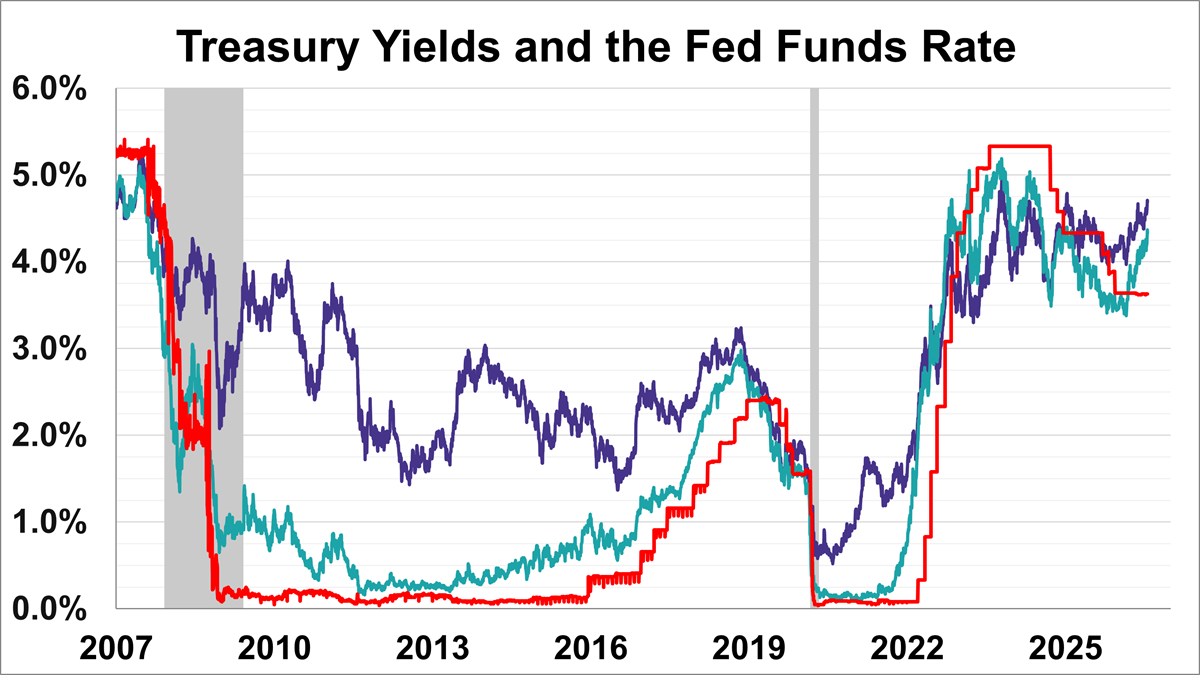
The yield on the 10-year note finished July 24, 2026 at 4.69% while the 2-year note ended at 4.33%.
A Call for Diversification: Research Affiliates-PIMCO Midyear Recap

Research Affiliates and PIMCO leadership analyze key 2026 midyear market shifts, warning of elevated U.S. and AI equity valuations.
New Home Sales Unexpectedly Rise 1.6% in June
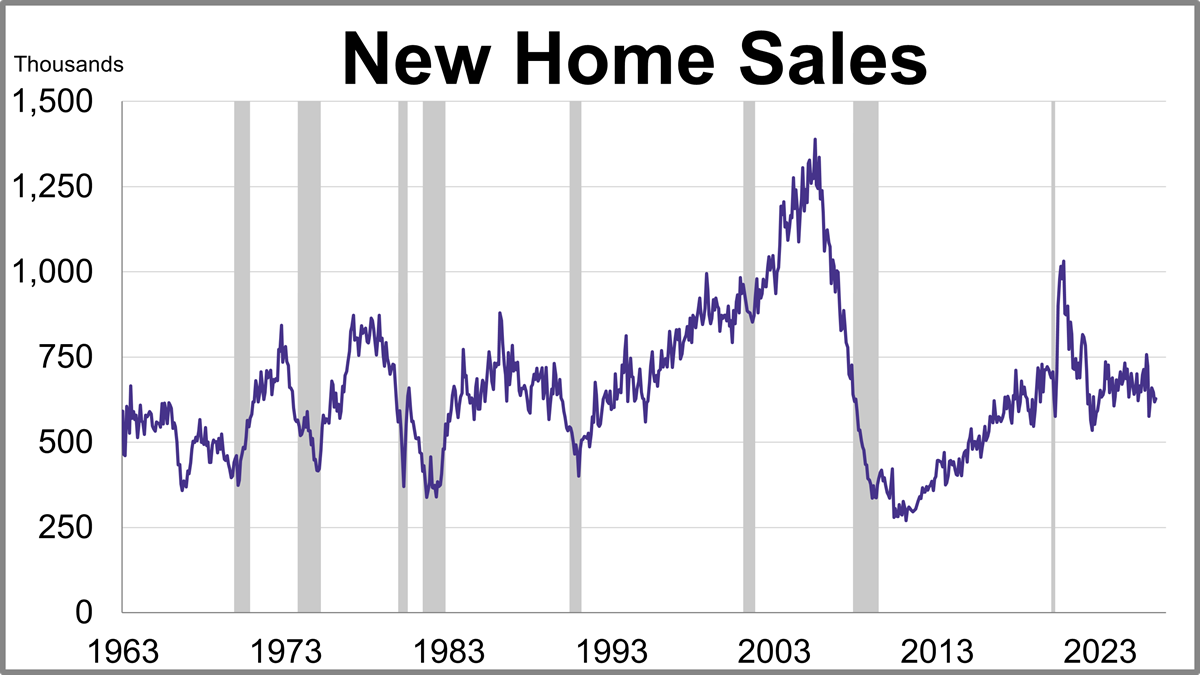
New home sales unexpectedly rose in June while the median price fell to its lowest level in almost a year.
Kansas City Fed Manufacturing Index: Steady Growth in July
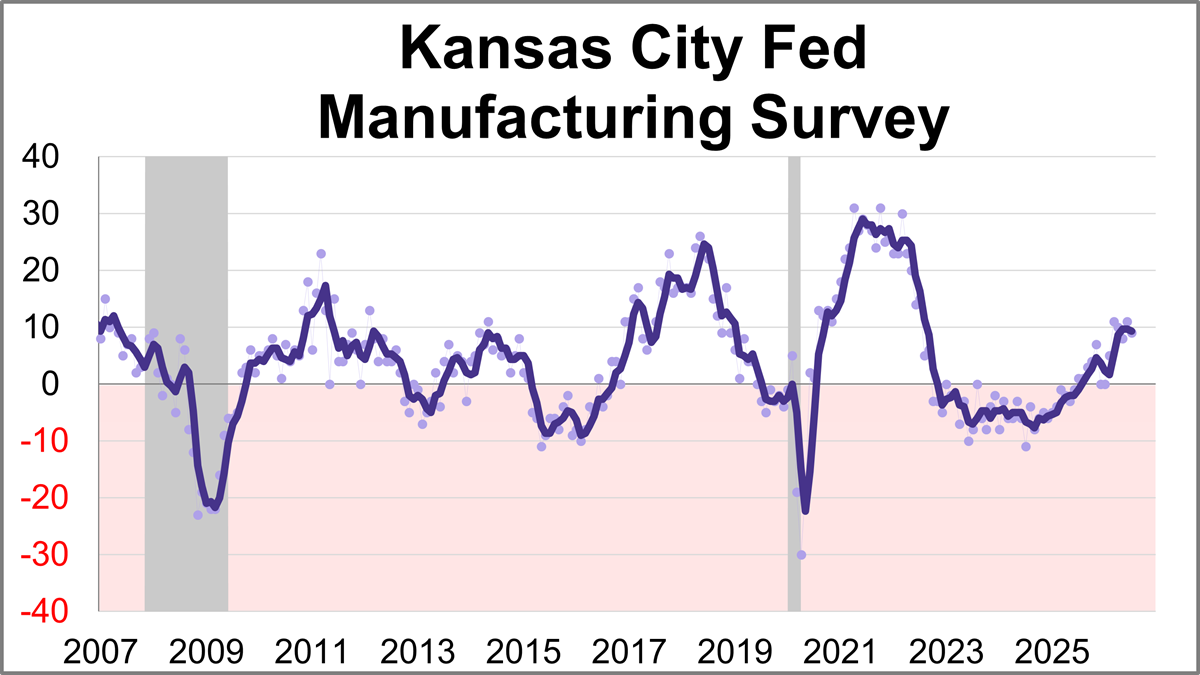
The Kansas City Fed Manufacturing Survey revealed regional activity remained steady in June. The composite index came in at 9 this month, down slightly from 11 in June but still indicating continued expansion.
Chicago Fed National Activity Index: Economic Growth Increased in June
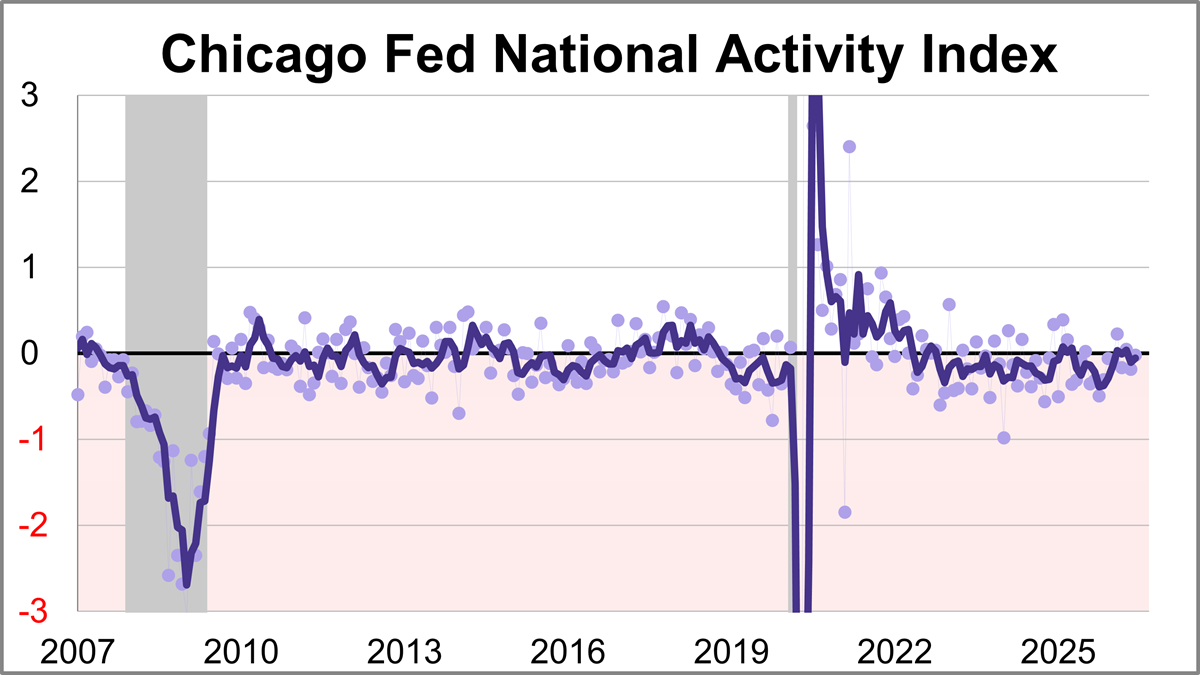
The Chicago Fed National Activity Index (CFNAI) rose to -0.02 in June from -0.19 in May. One of the four broad categories of indicators used to construct the index decreased from May, and two categories made negative contributions.
Initial Jobless Claims Fall to Lowest Level Since 1969
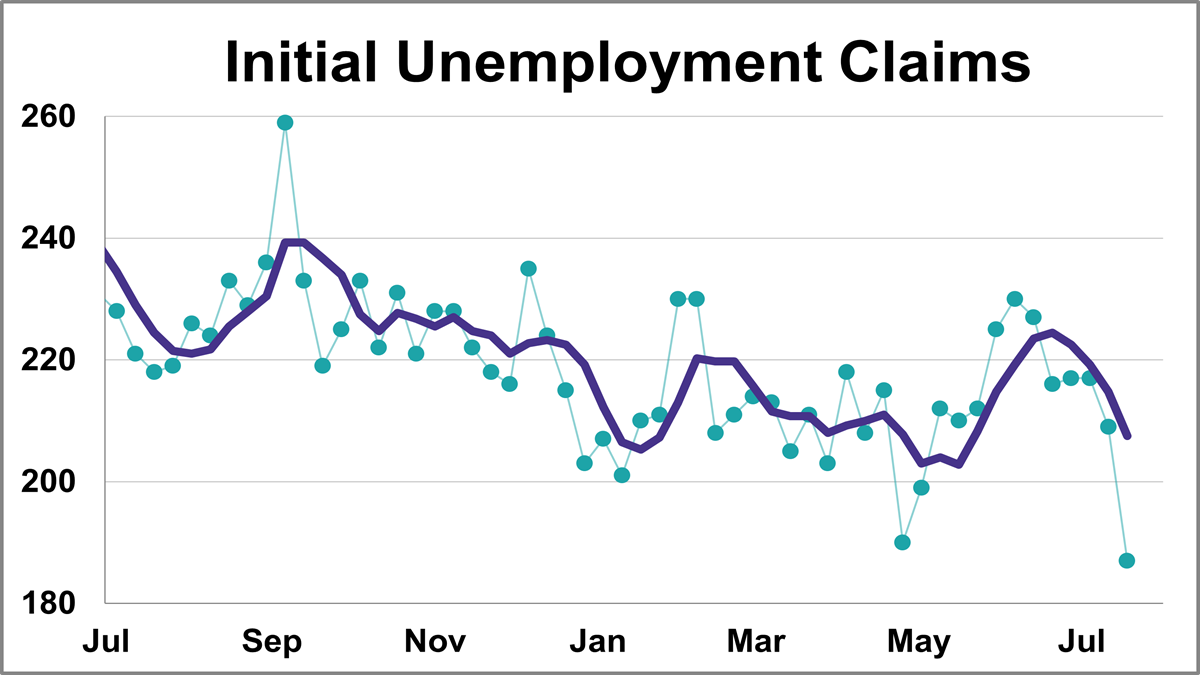
In the week ending July 18th, initial jobless claims were at a seasonally adjusted level of 187,000, the lowest level since 1969. This represents a decrease of 22,000 from the previous week's figure and was significantly lower than the forecast of 211,000.
Market Valuation: Is the Market Still Overvalued?
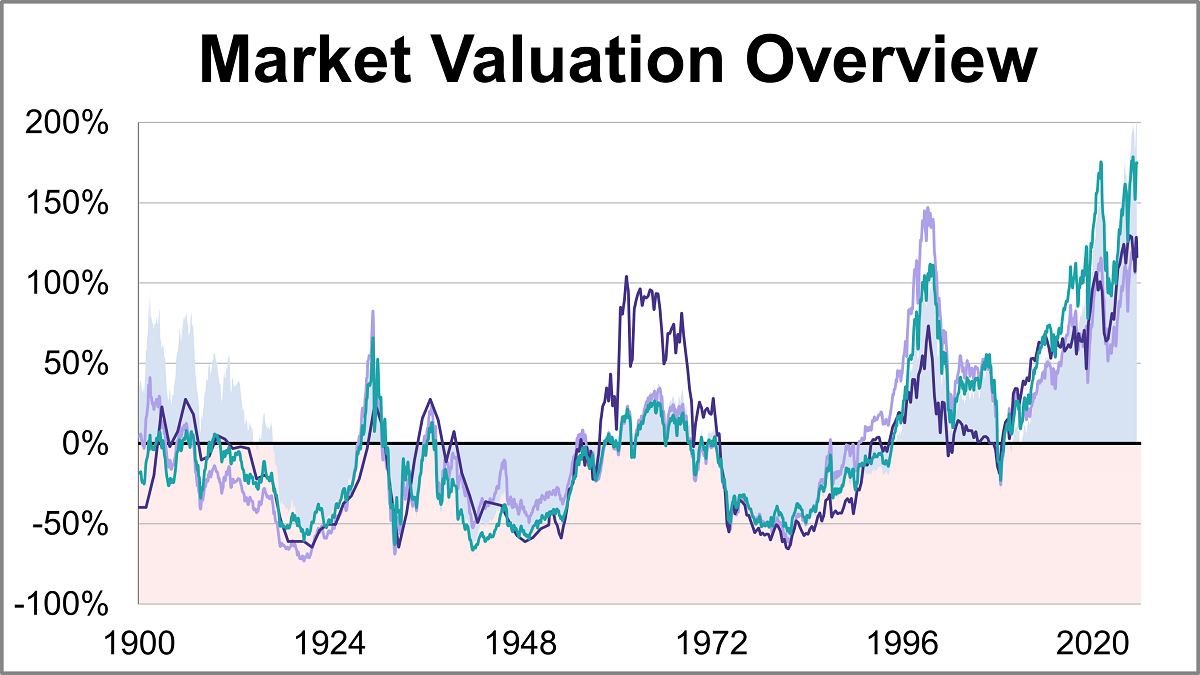
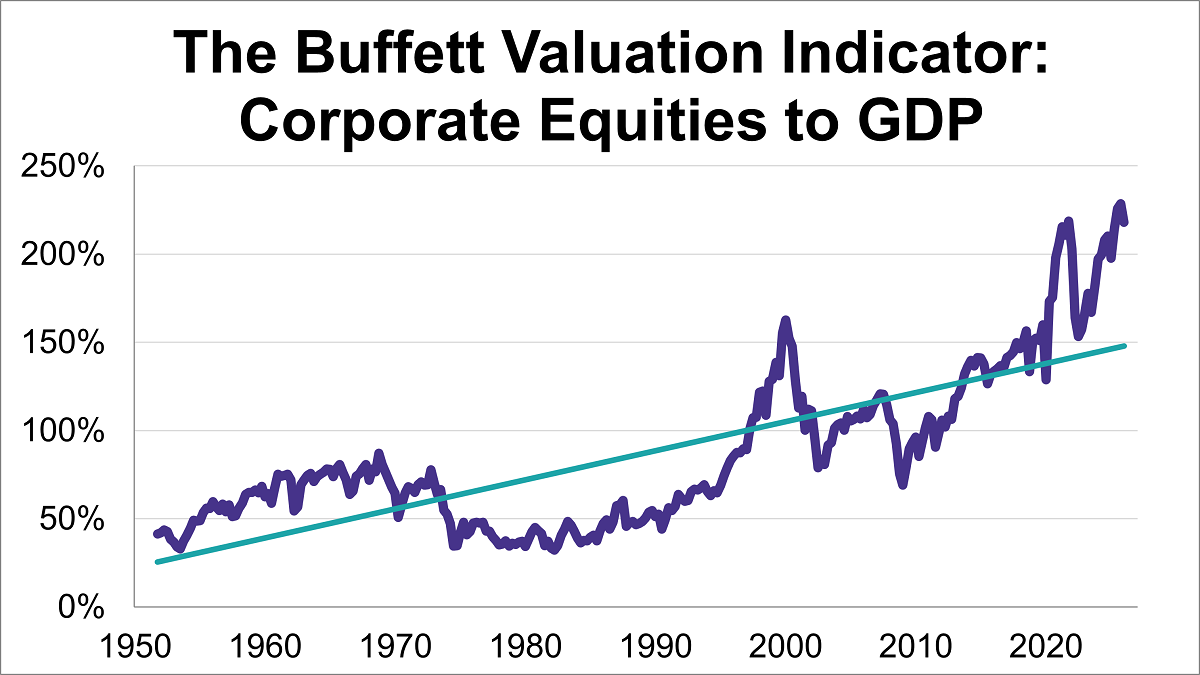
Here is a summary of the four market valuation indicators we update on a monthly basis.
- The Crestmont Research P/E ratio
- The cyclical P/E ratio using the trailing 10-year earnings as the divisor
- The Q ratio, which is the total price of the market divided by its replacement cost
- The relationship of the S&P composite price to a regression trendline
Cryptocurrencies: Bitcoin Climbs to 7-Week High
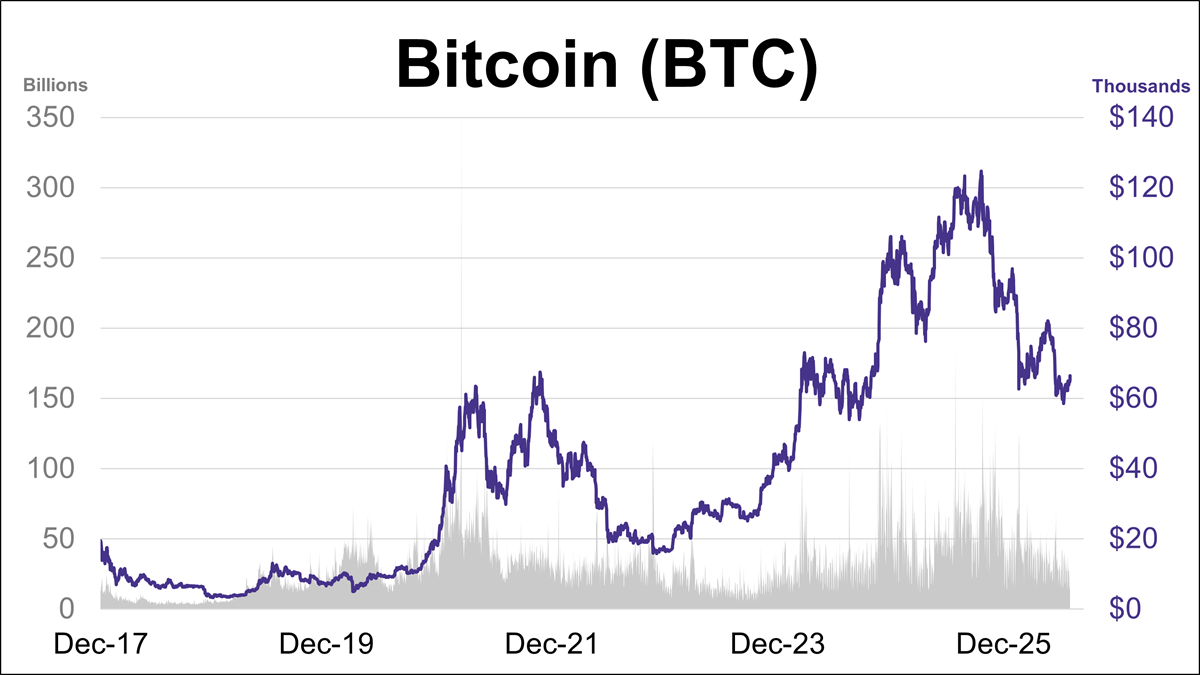
Bitcoin's closing price continued to edge higher this week, rising nearly 5% to its highest level in seven weeks. However, BTC is currently down approximately 24% year-to-date and sits about 47% below its October 2025 record high.
Risk-Wary Family Offices Double Down on Infrastructure

A Roland Berger study finds family offices moving capital into infrastructure and private equity while retreating from riskier bets abroad.
Gasoline Prices Jump Back Above $4.00
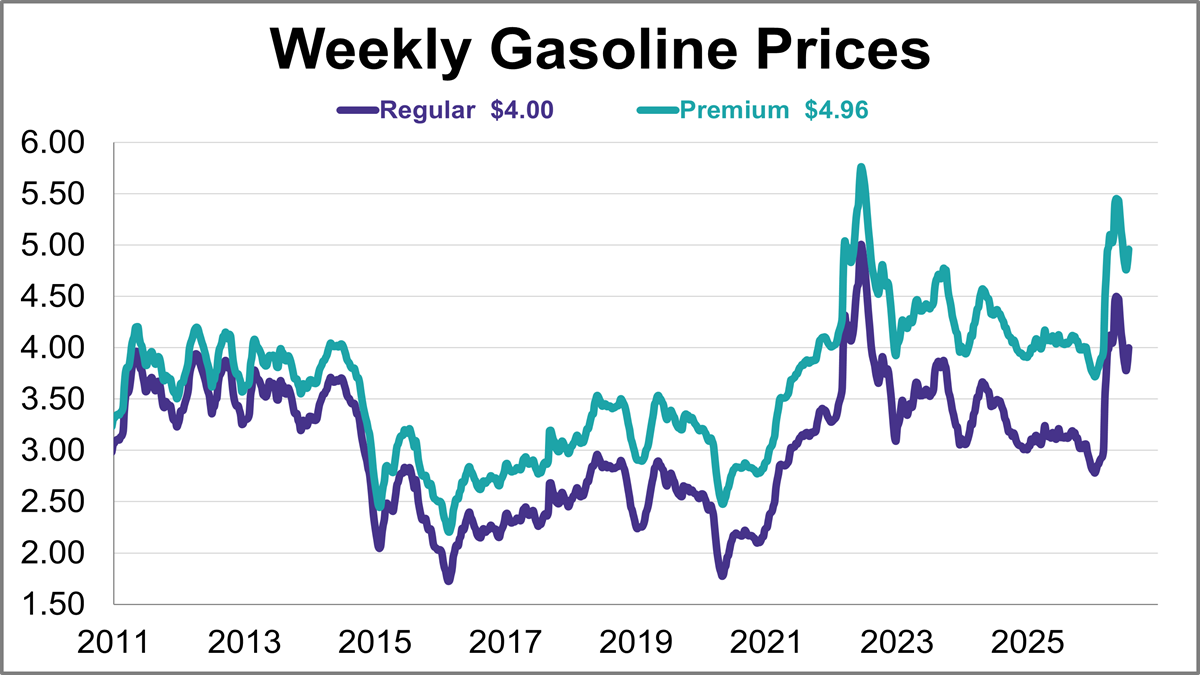
Gasoline prices rose for a second straight week, jumping back above $4.00 for the first time in over a month.
World Markets Watchlist: July 20, 2026
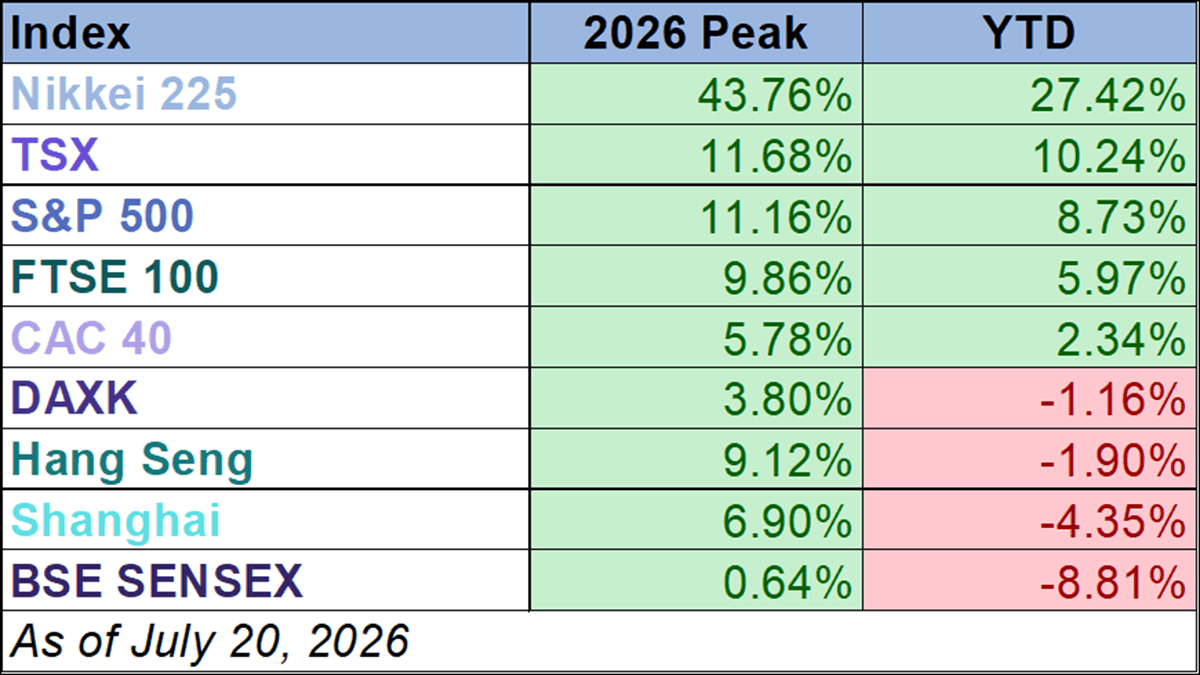
Five of the nine indexes on our world markets watch list posted year-to-date gains through July 20, 2026.
Margin Debt Jumps 7.9% in June to Another Record High
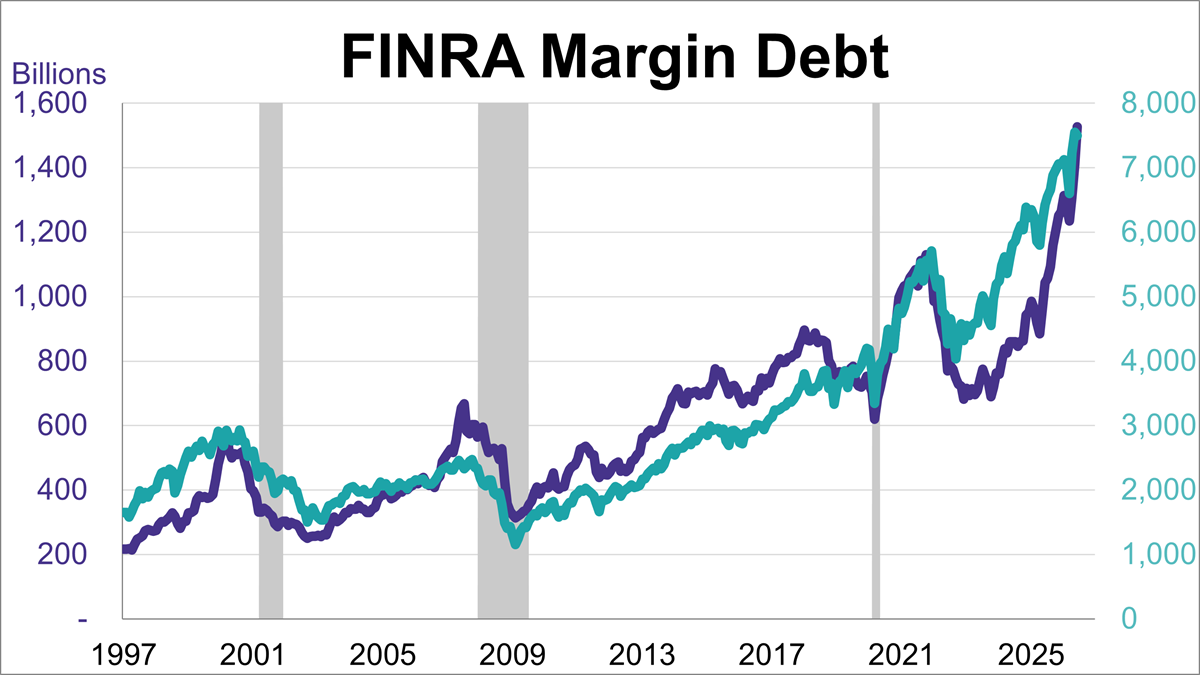
Margin debt rose for a third straight month in June, reaching a new record high of $1.53 trillion. This marked a 7.9% increase from May and a 51.5% rise compared to the previous year.
Weekly Economic Snapshot: Inflation Cools, But Energy Headwinds Loom

A handful of key economic data points dropped last week, painting a picture of an economy that is successfully downshifting from its recent inflation peaks even as consumers keep their footing.
The Big Four Recession Indicators
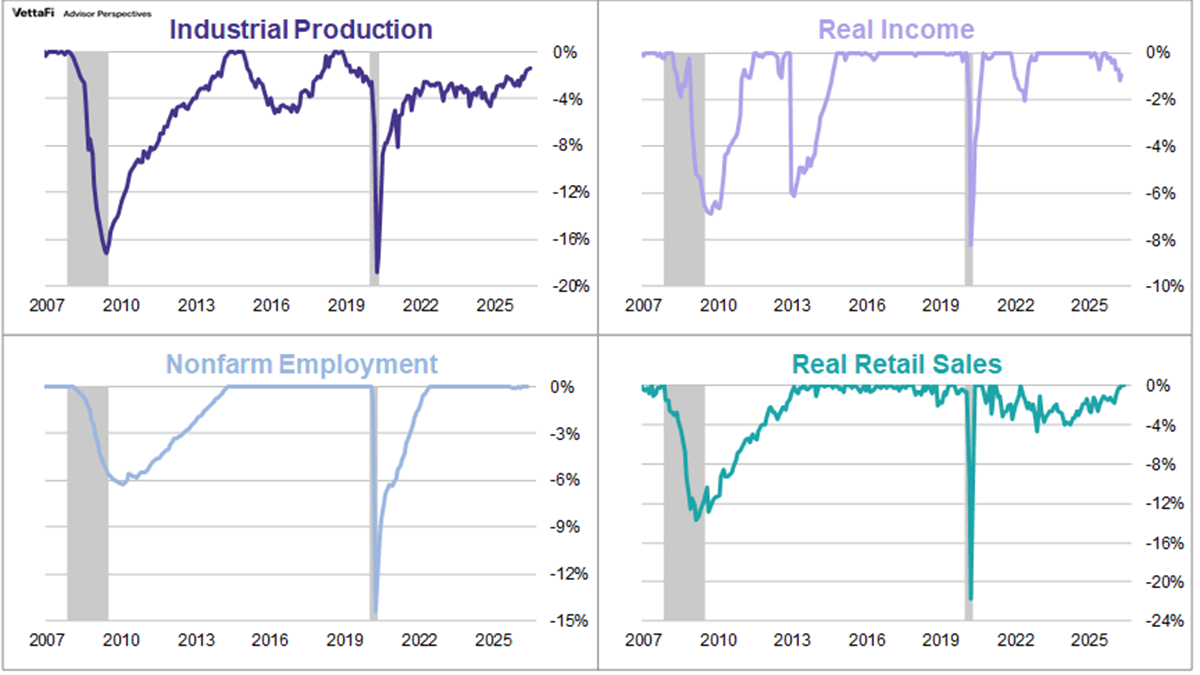
Official recession calls are the responsibility of the NBER Business Cycle Dating Committee, which is understandably vague about the specific indicators on which they base their decisions. There is, however, a general belief that there are four big indicators that the committee weighs heavily in their cycle identification process.
Zillow Home Value Index: "Real" Home Values Hit 5-Year Low
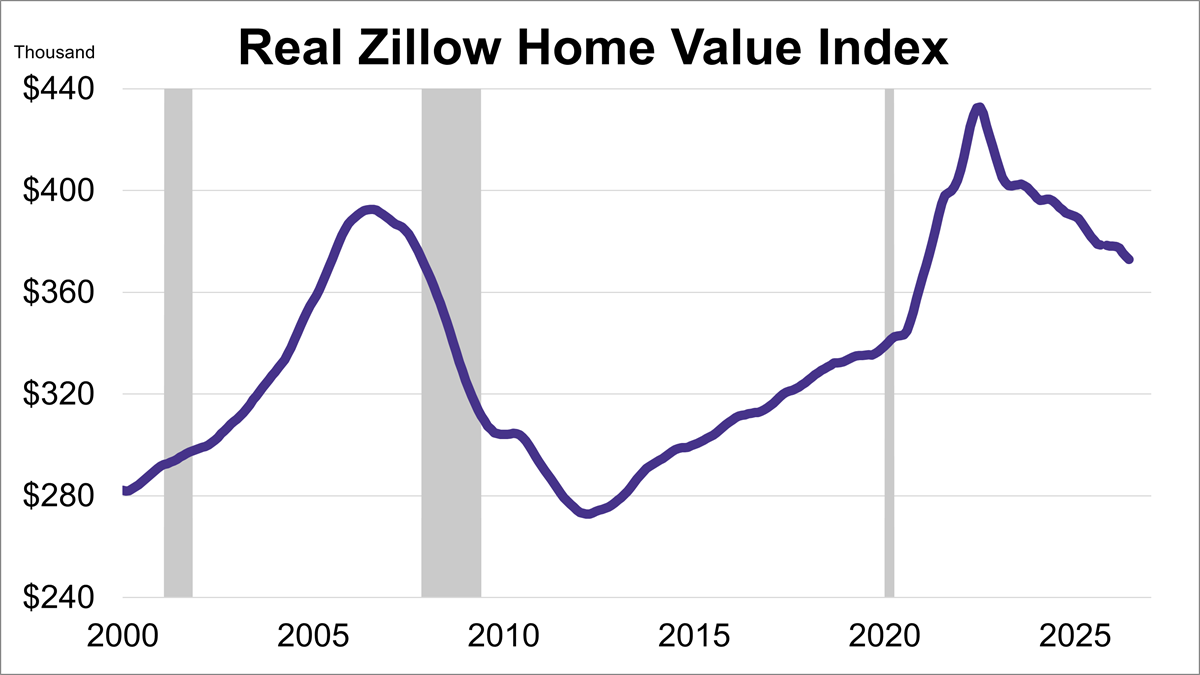
Home values fell for a second straight month in June, according to the Zillow Home Value Index. Additionally, after adjusting for inflation, real home values dropped even more sharply, hitting their lowest level in over five years.
Consumer Sentiment Hits Highest Level Since February on Easing Gas Prices
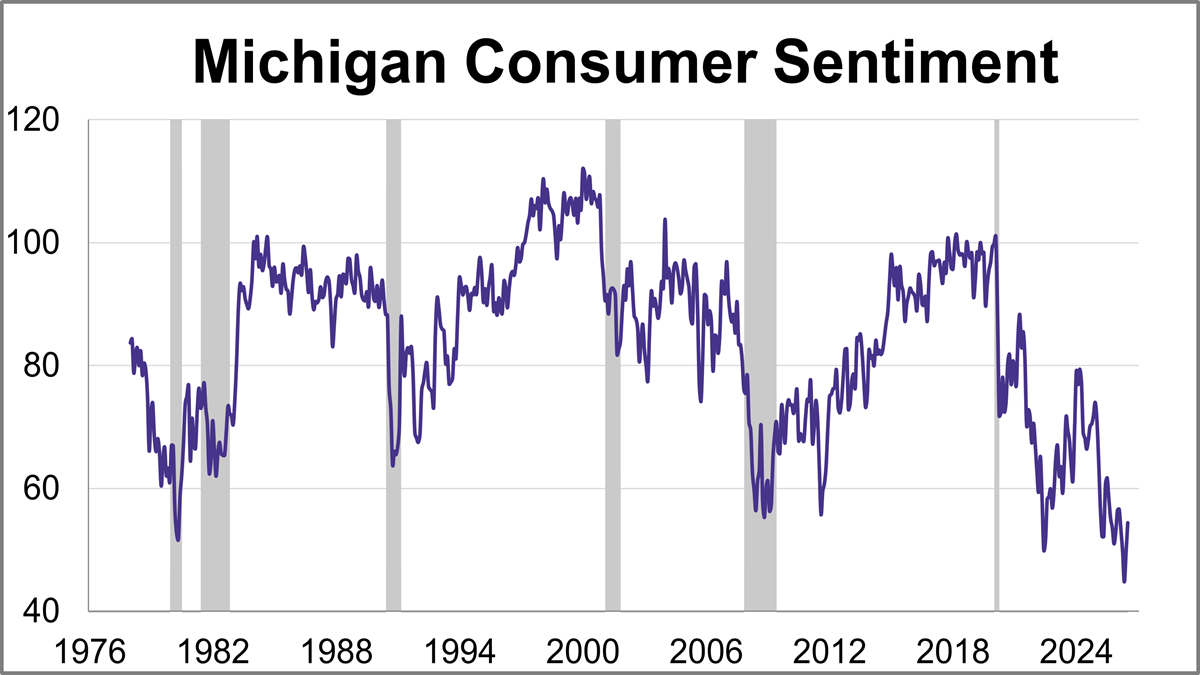
Consumer sentiment reached its highest level since February, driven by easing gas prices. The preliminary July reading for the University of Michigan Consumer Sentiment Index came in at 54.4. This marks a 9.9% (4.9 points) increase from June and beat the expected reading of 51.0.
The Big Four Recession Indicators: Industrial Production
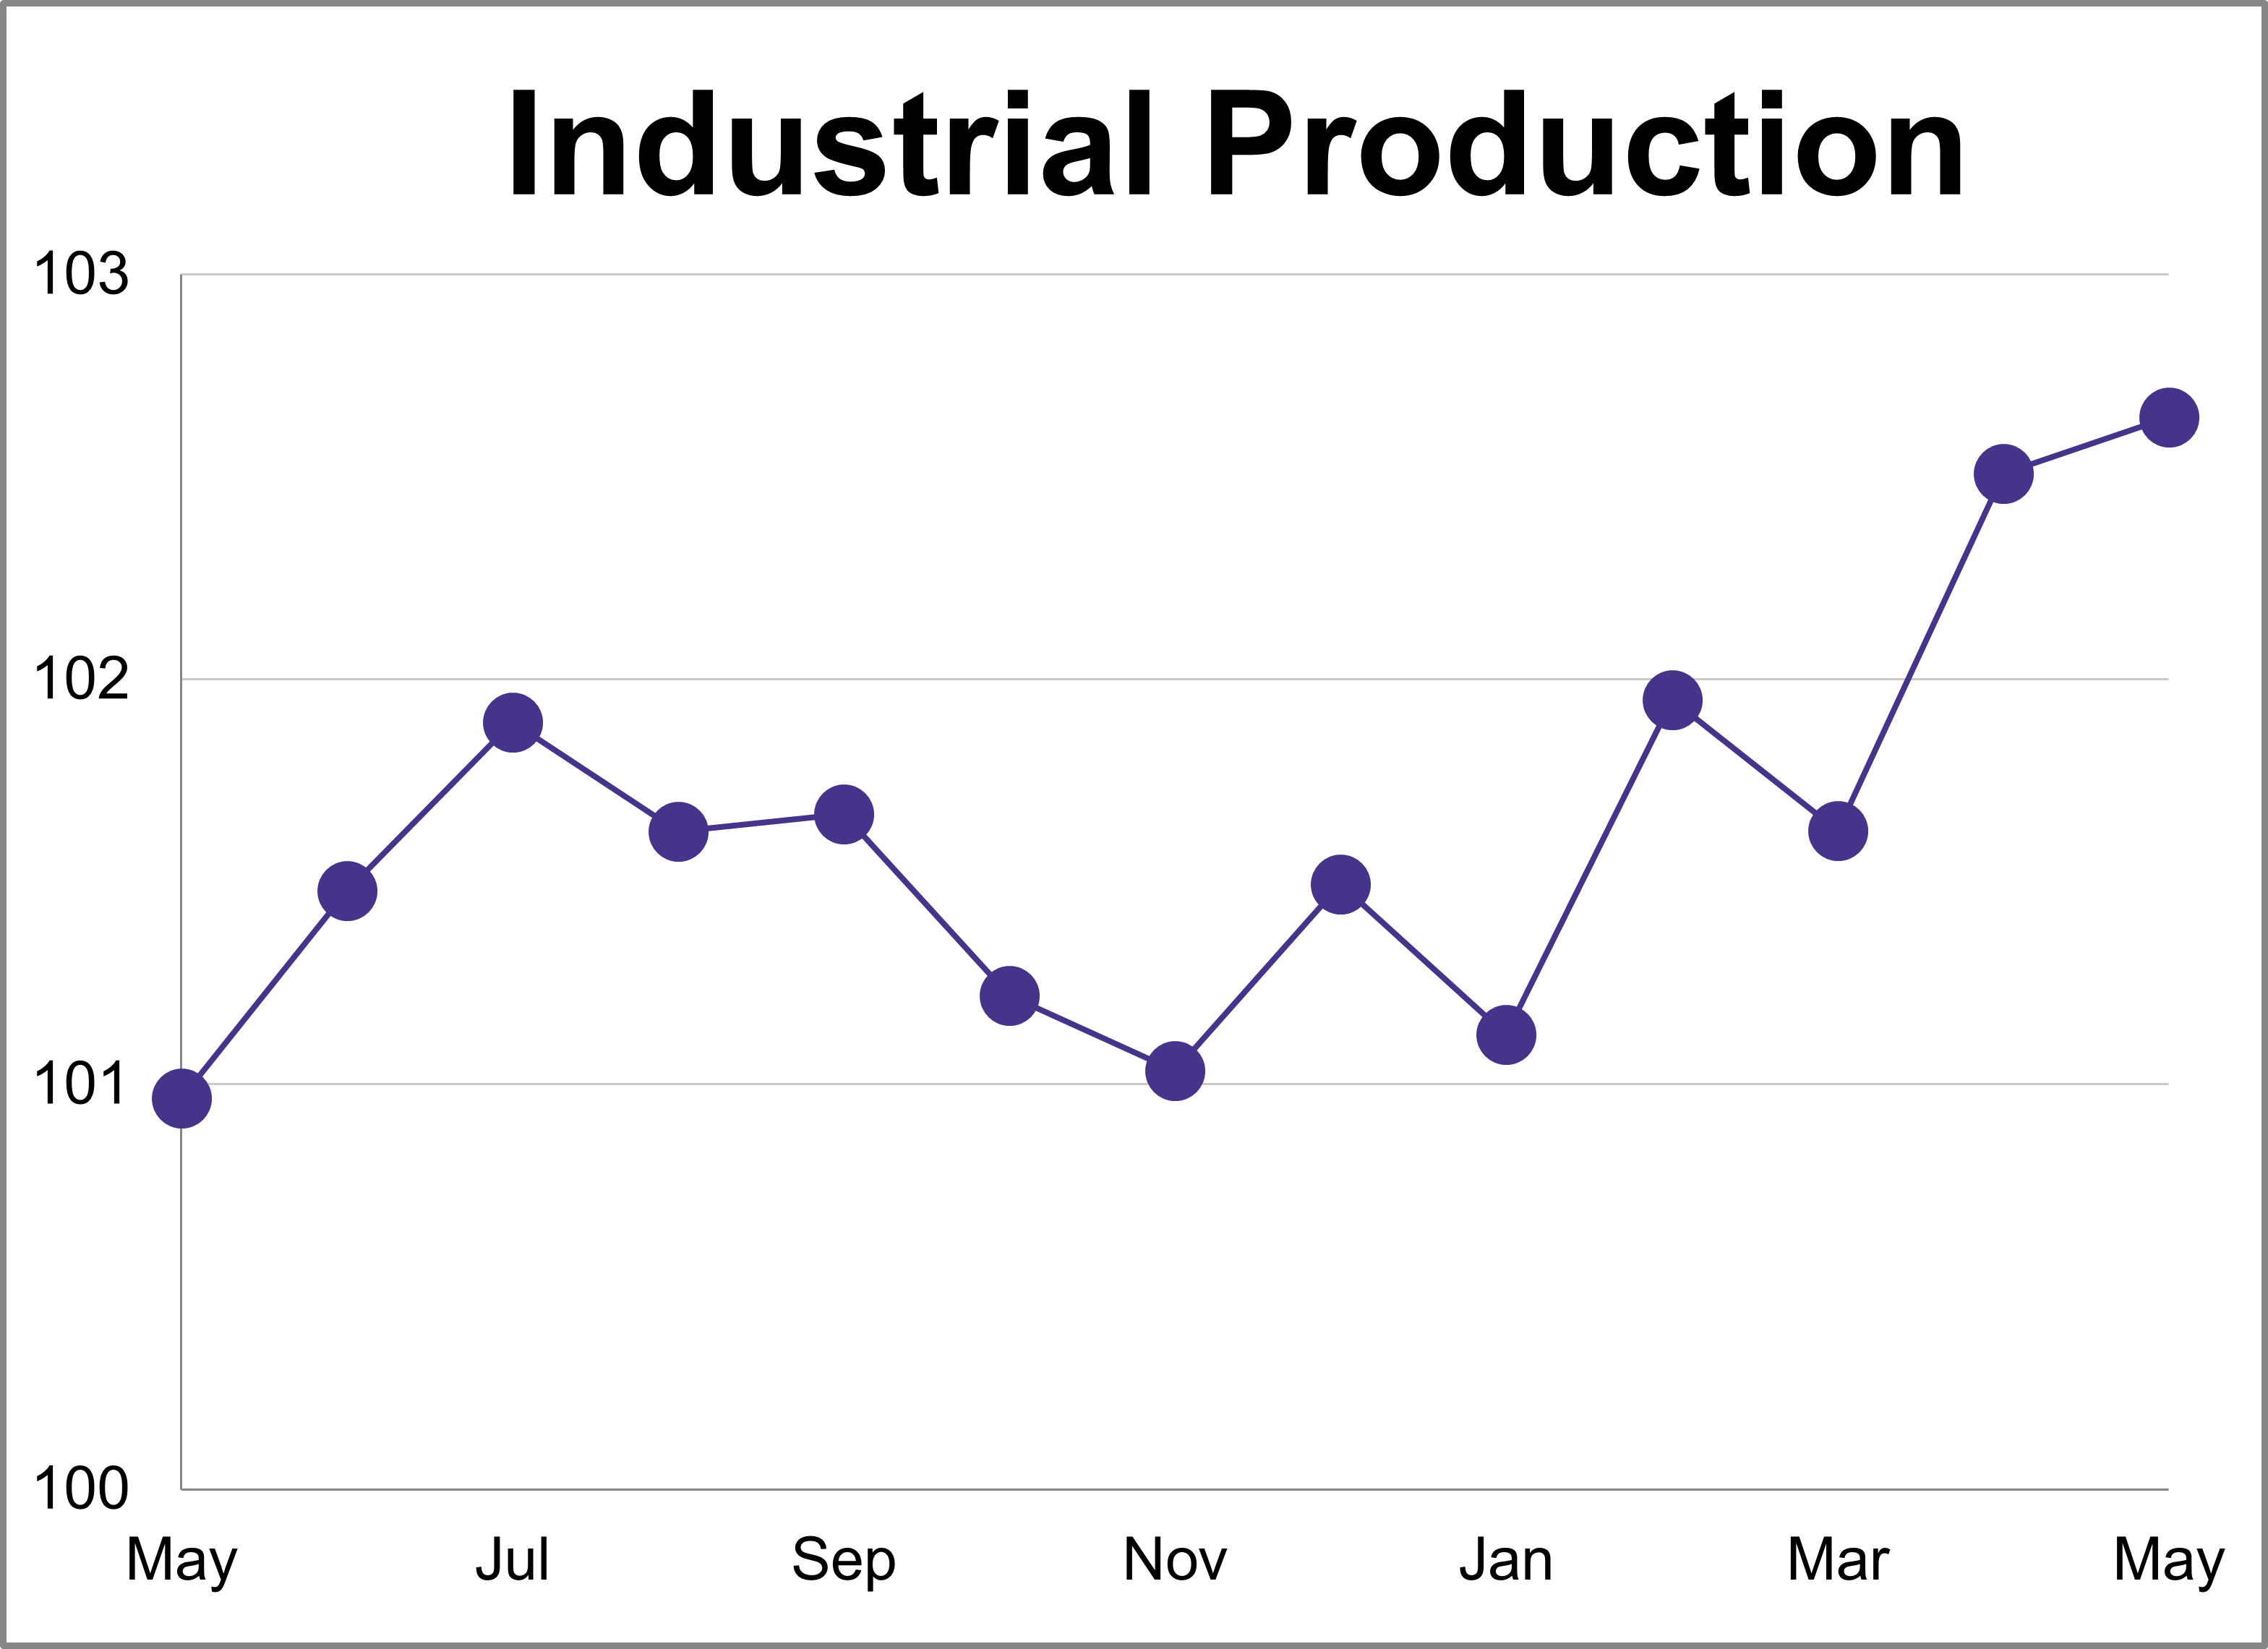
Industrial production rose less than expected in June, increasing 0.1% after May's 0.1% growth. This was lower than the expected 0.2% growth and marks a 1.1% increase compared to one year ago.
Building Permits Fall 3.0% in June
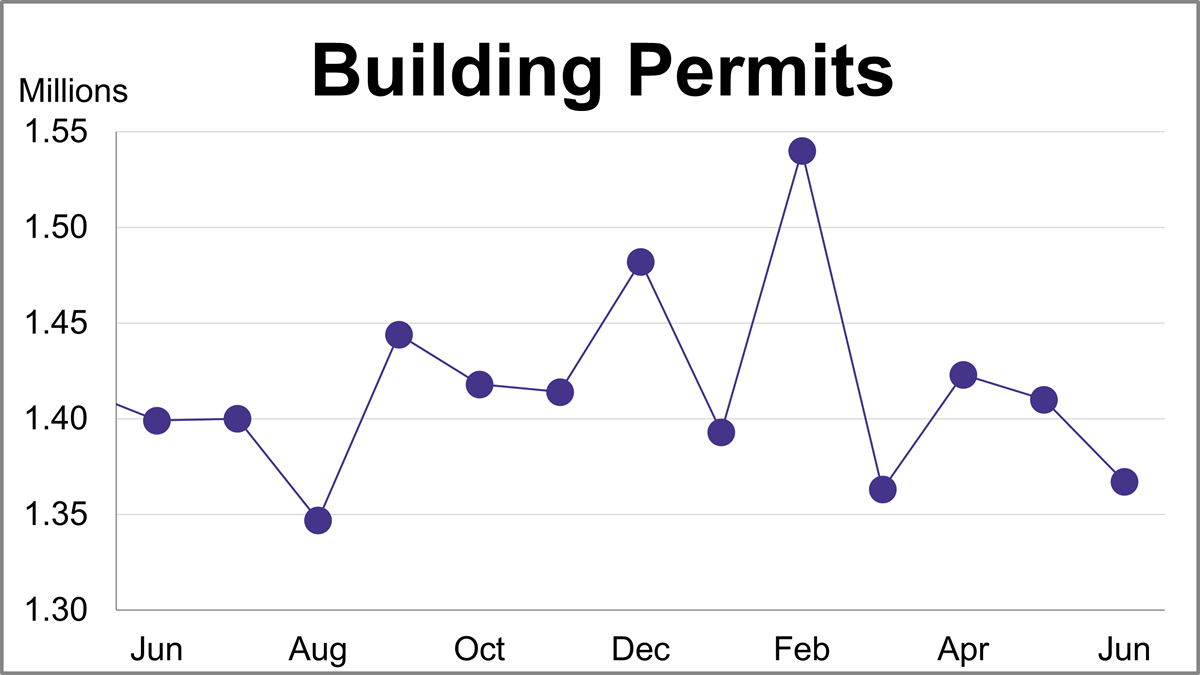
Building permits fell 3.0% in June to a seasonally adjusted annual rate of 1.367 million. The latest reading missed the forecast of 1.400 million.
Housing Starts Jump 19% in June
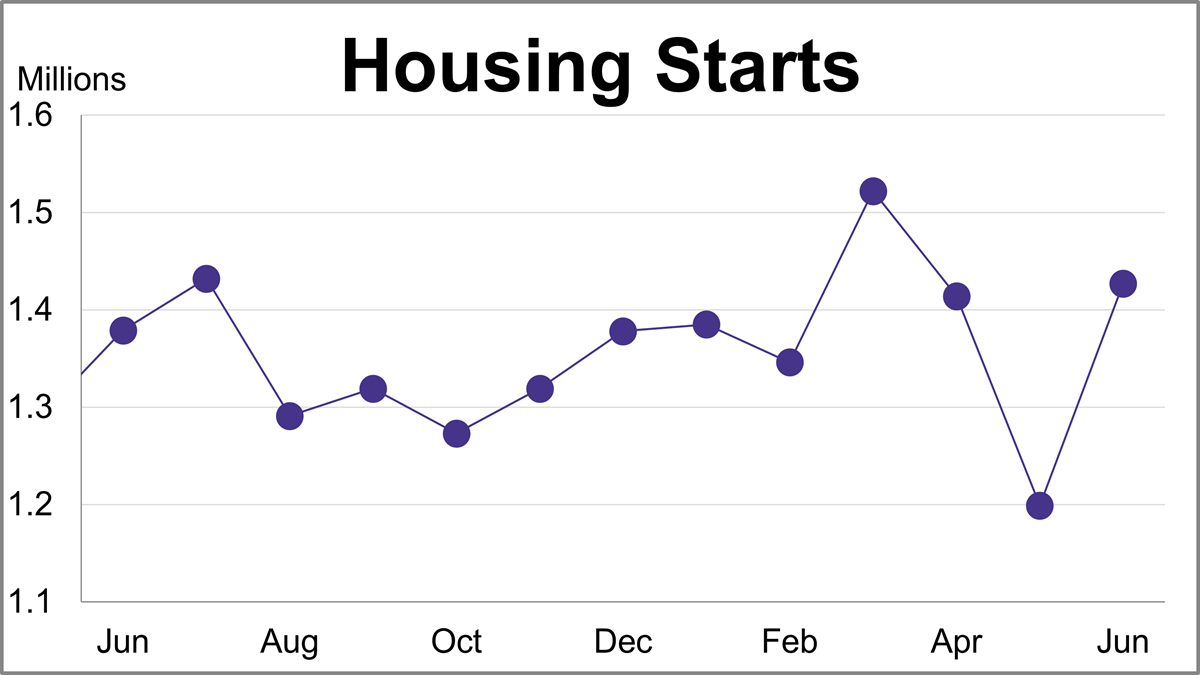
Housing starts jumped 19.0% in June to a seasonally adjusted annual rate of 1.427 million, beating forecasts driven by a massive surge in multi-family units.
Top 10 Charts of 2026: Mid-Year Review

Discover the top 10 most-read charts from the first half of 2026, covering historic market valuations, record margin debt, recession indicators, and global index performance.
The Big Four Recession Indicators: Real Retail Sales
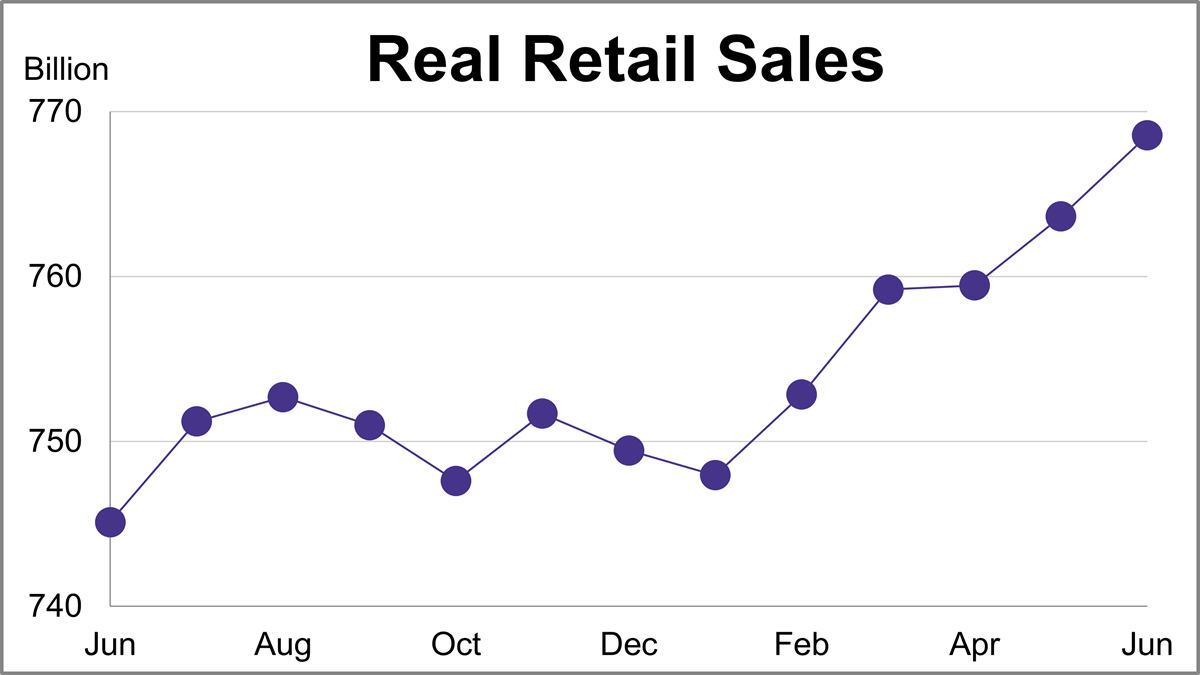
Nominal retail sales were up 0.22% month-over-month and up 6.72% year-over-year in May. However, after adjusting for inflation, real retail sales were up 0.64% month-over-month and up 3.15% year-over-year.
NAHB Housing Market Index: Affordability Challenges Pull Down Builder Sentiment
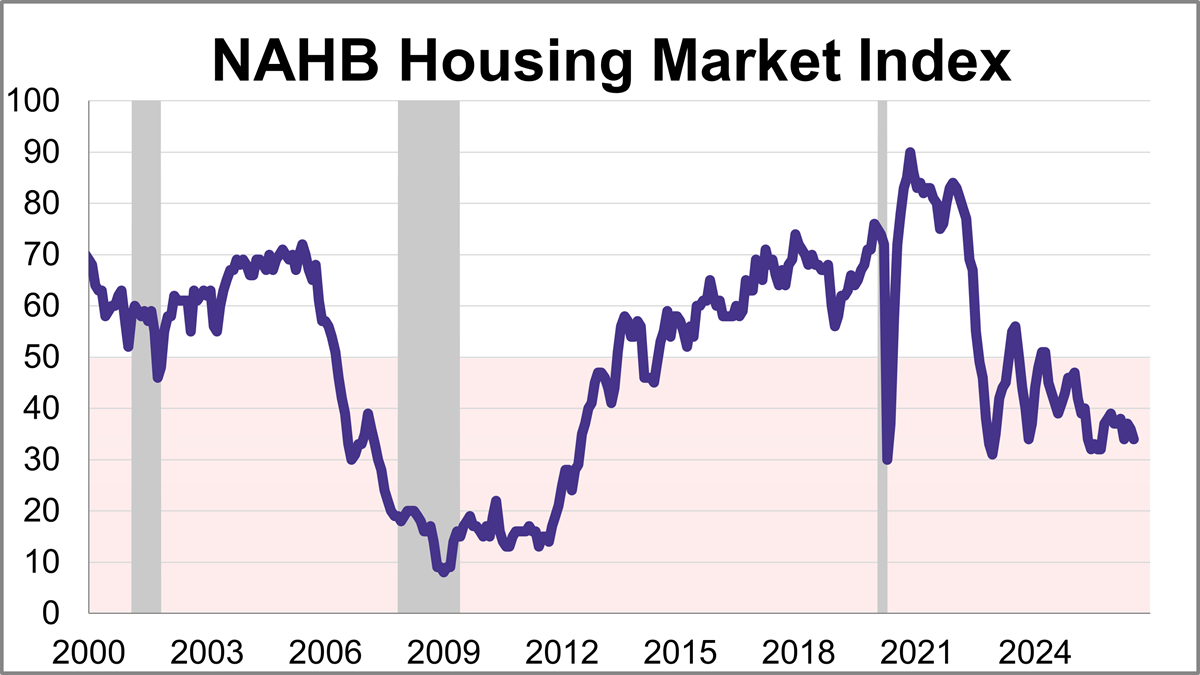
Builder confidence edged lower in July as ongoing affordability challenges continue to affect the housing market. The National Association of Home Builders (NAHB) Housing Market Index (HMI) fell 2 points from June to 34 this month, marking the 27th consecutive negative reading.
Pending Home Sales Sink 5% in June
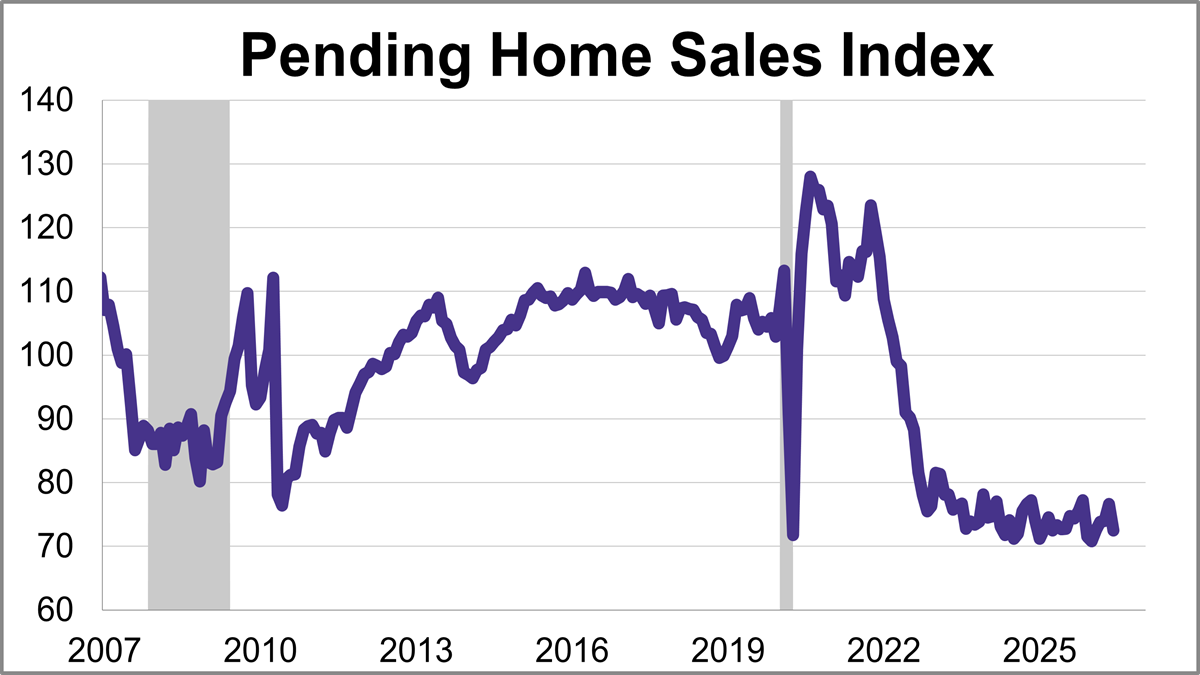
The National Association of Realtors® (NAR) pending home sales index sank 5.4% in June to 72.5, the lowest level since January.
Philadelphia Fed Manufacturing Index Jumps to Highest Level Since 2021
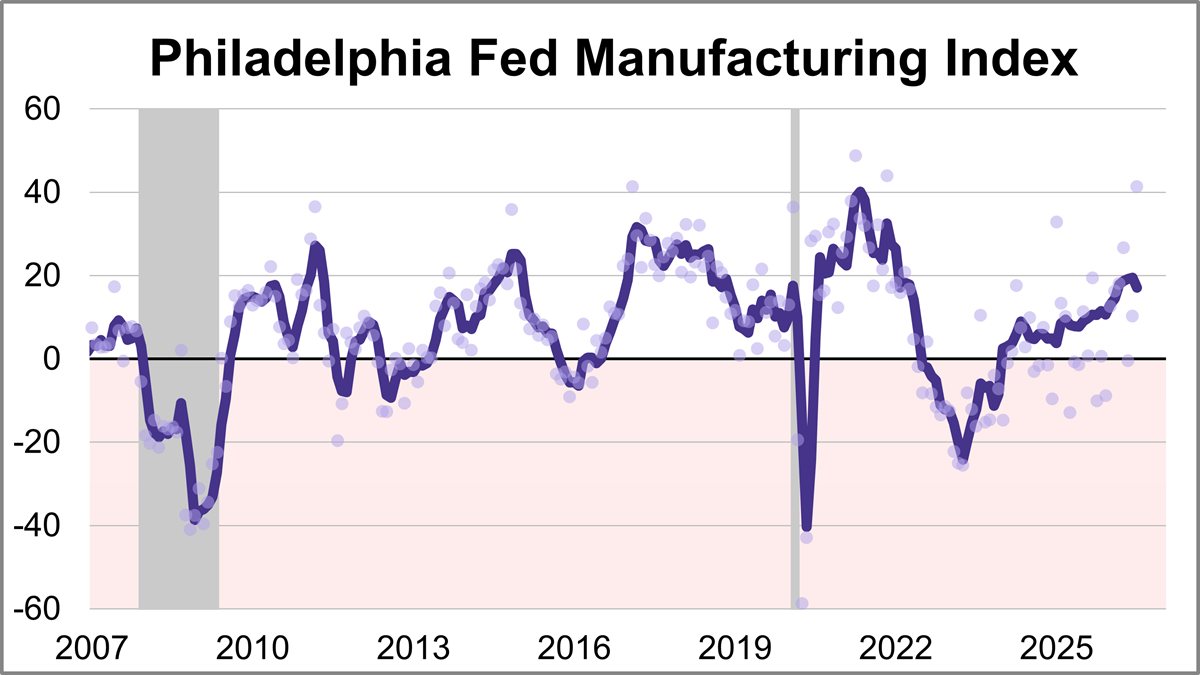
The Philadelphia Fed manufacturing index showed activity expanded significantly in July, with the index jumping 31.1 points to 41.4. This marks the highest level for the index since November 2021 and was more than triple the forecast of 12.7.
Retail Sales Rise for Fifth Straight Month
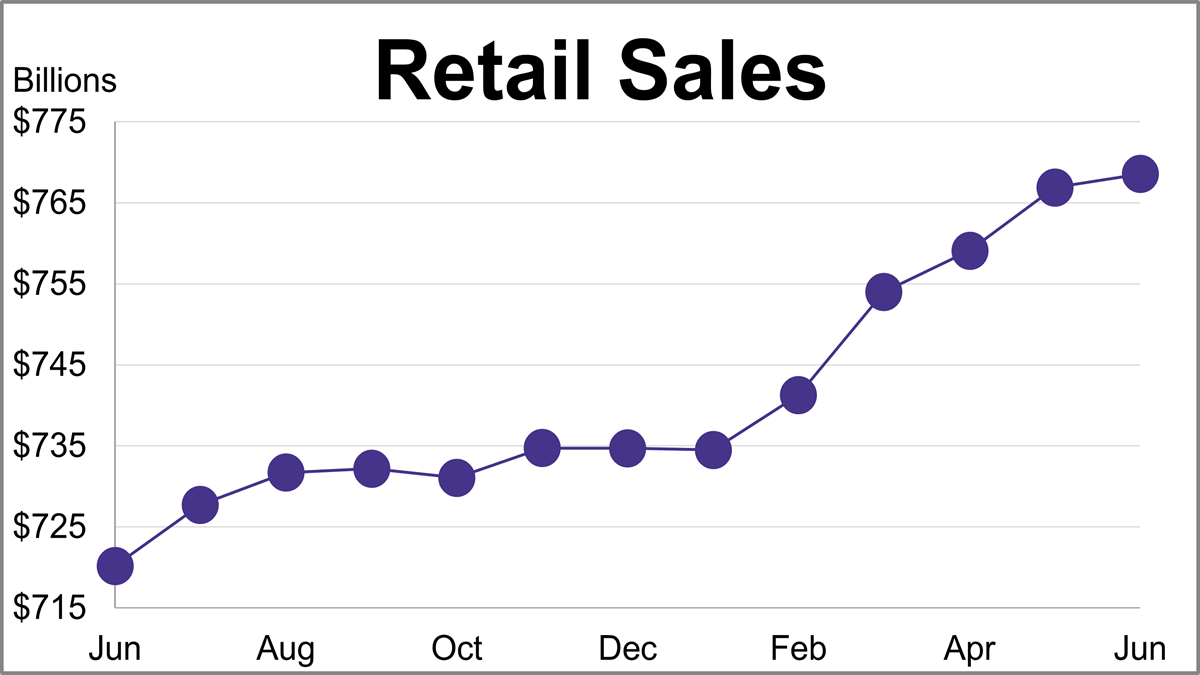
U.S. headline retail sales increased for a fifth straight month, rising 0.2% to $768.6B in June, while core retail sales fell unexpectedly by 0.2%.
Empire State Manufacturing Survey: Significant Growth in July
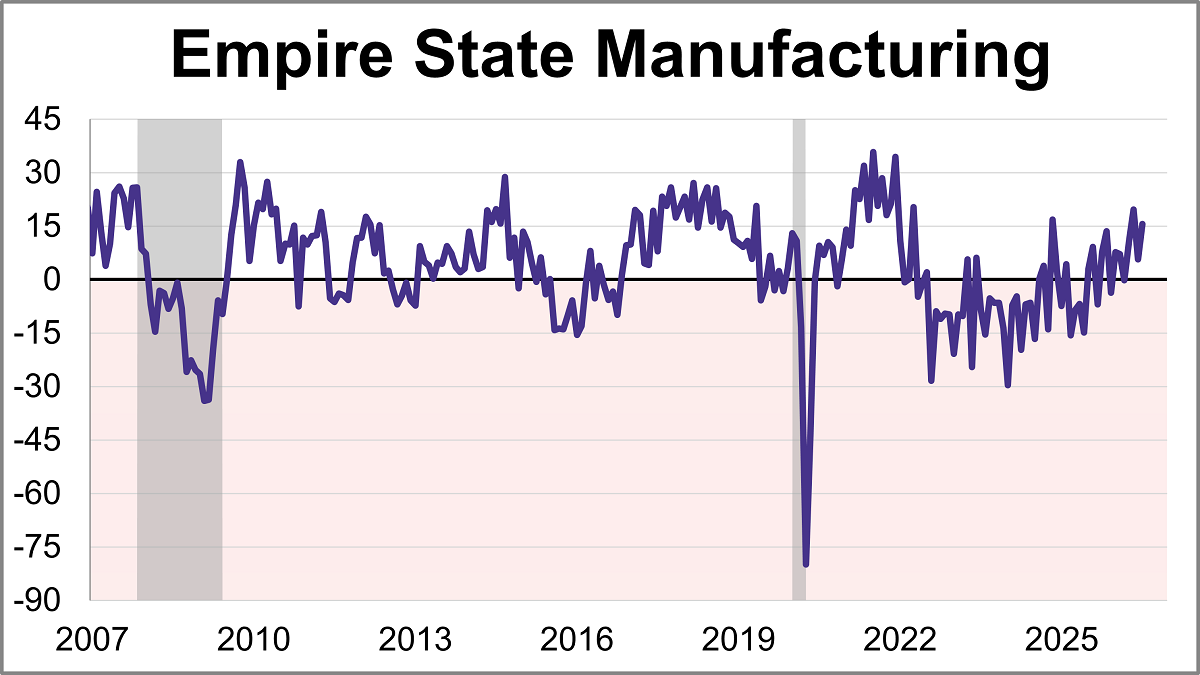
Manufacturing activity grew significantly in New York State, according to the Empire State Manufacturing July survey. The diffusion index for General Business Conditions remained in positive territory for a fourth straight month, jumping 9.9 points to 15.6 and coming in above the 9.3 forecast.
Producer Price Index: Wholesale Inflation Unexpectedly Falls in June
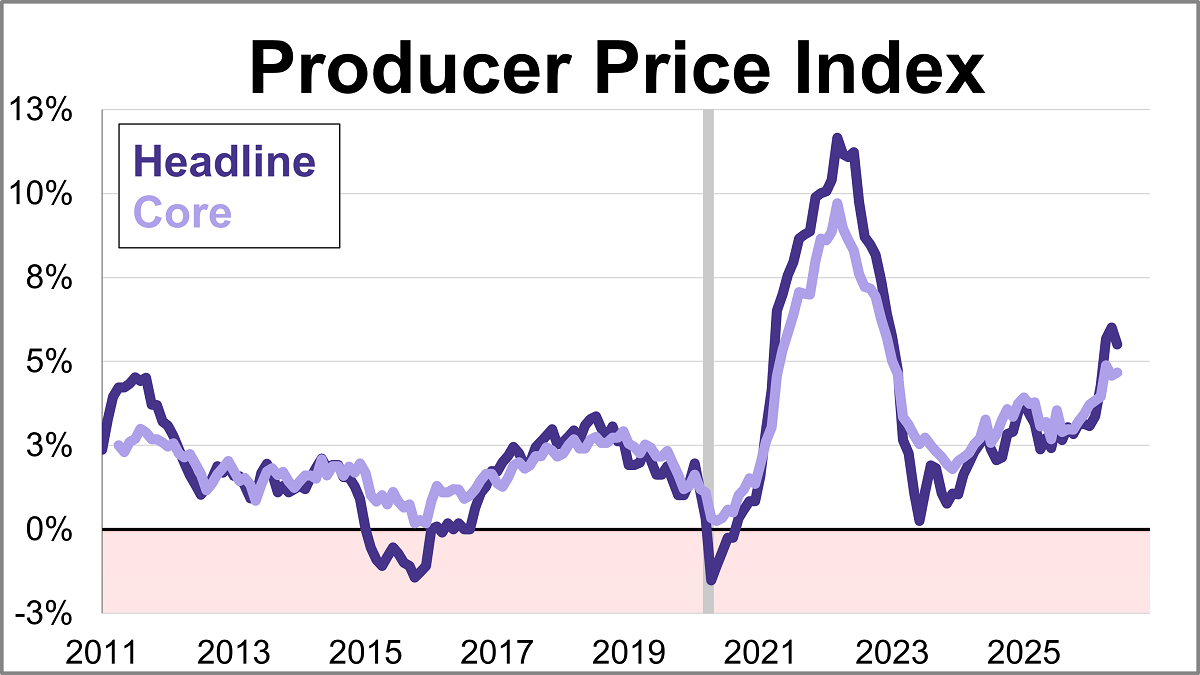
The Producer Price Index (PPI) experienced its largest decline in over a year in June, with wholesale inflation dropping 0.3%.
NFIB Small Business Survey: Optimism Picks Up in June
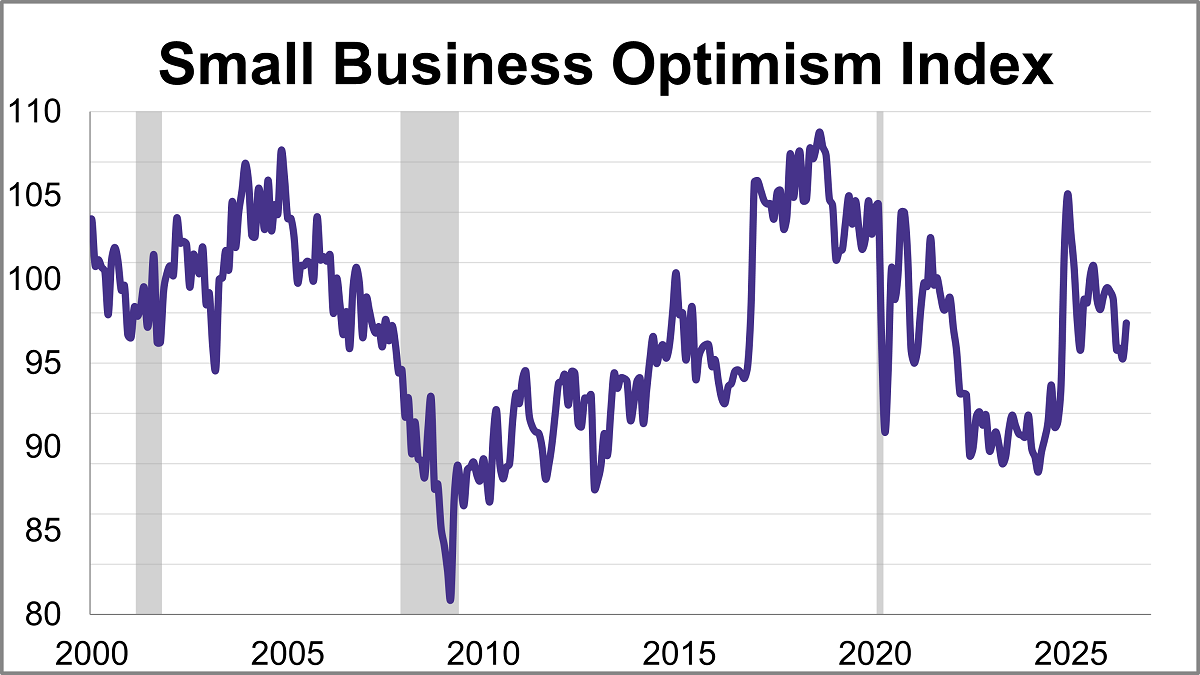
The NFIB Small Business Optimism Index rose 2.1 points to 97.4, reaching its highest level since February. However, the index remains below its historical average for a fourth straight month.
Inflation Since 1872: A Long-Term Look at the CPI
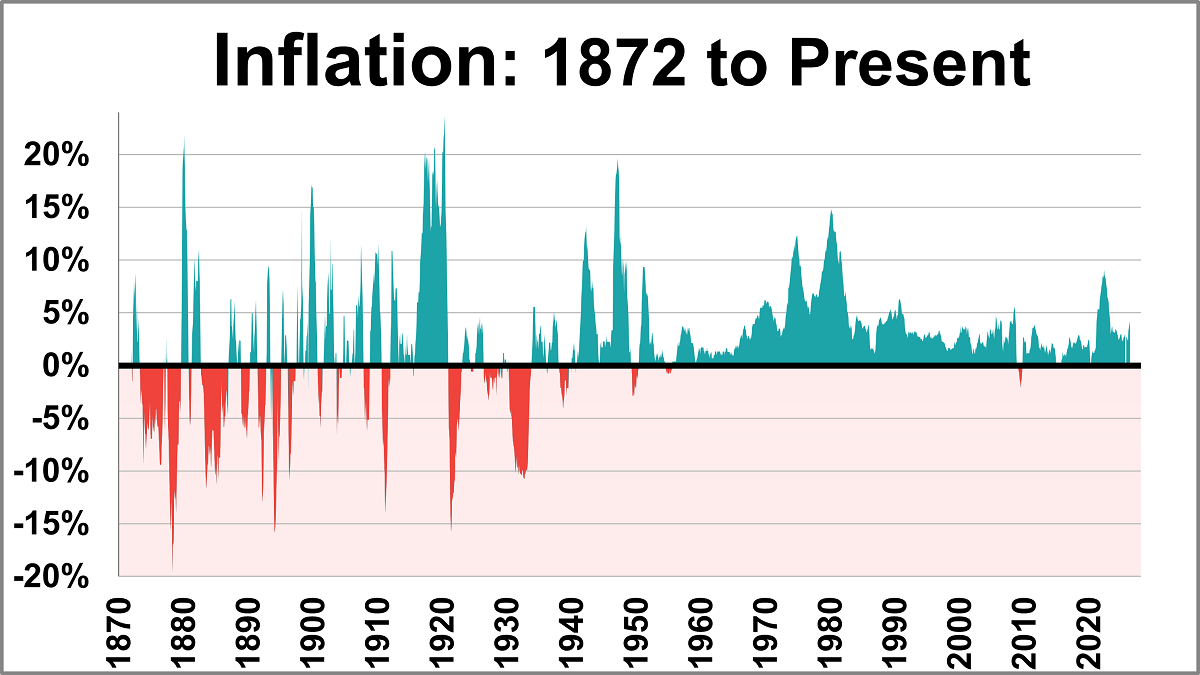
The June release of the Consumer Price Index for Urban Consumers (CPI-U) places the year-over-year inflation rate at 3.53%. This pushes inflation back below the post-WWII average of 3.72% for the first time since March. Meanwhile, this marks the fourth consecutive month that the current rate is above the 10-year moving average, which currently sits at 3.29%.
Real Middle Class Wages: June 2026
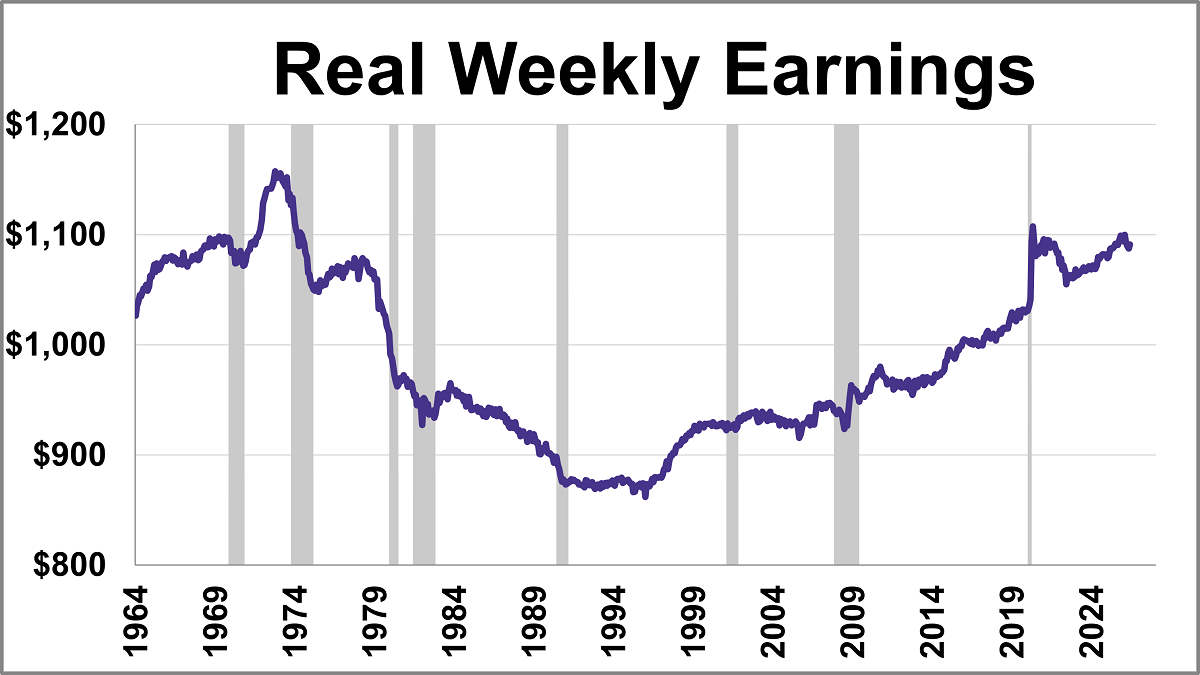
This series has been updated to include the June release of the consumer price index as the deflator and the monthly employment update. The latest hypothetical real (inflation-adjusted) annual earnings are at $54,560, down 5.7% from over 50 years ago.
Inside the Consumer Price Index: June 2026
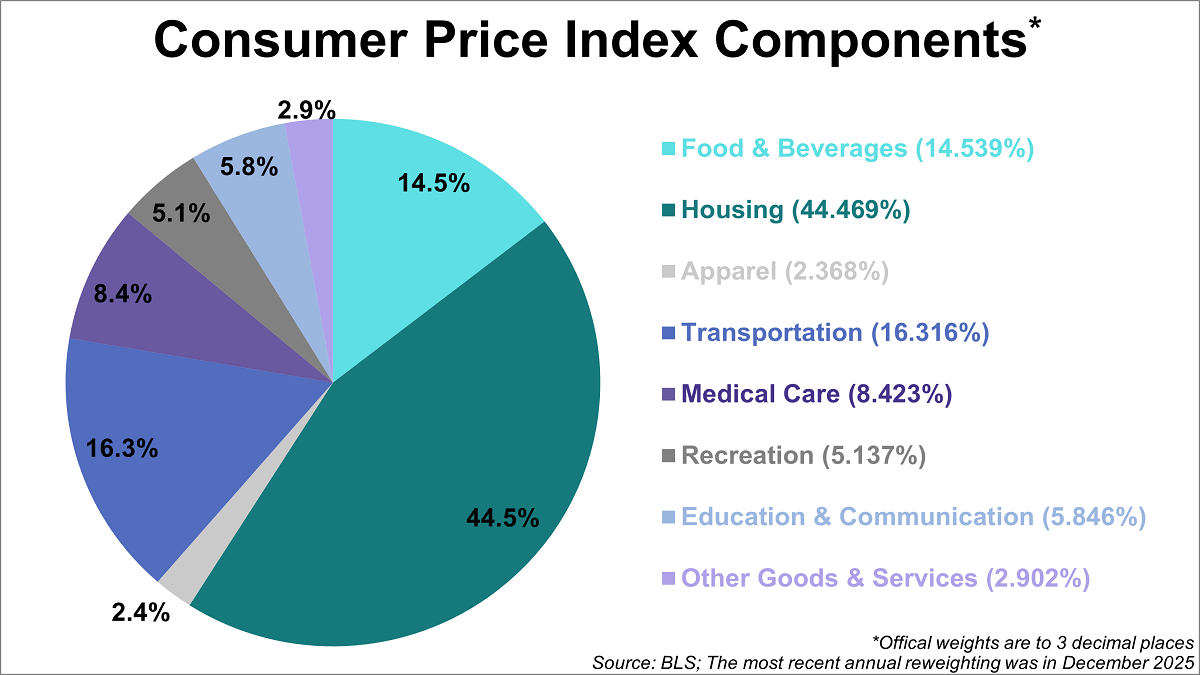
Inflation affects everything from grocery bills to rent, making the Consumer Price Index (CPI) one of the most closely watched economic indicators. The Bureau of Labor Statistics (BLS) tracks this by categorizing spending into eight categories, each weighted by its relative importance.
Consumer Price Index: Inflation at 3.5% in June
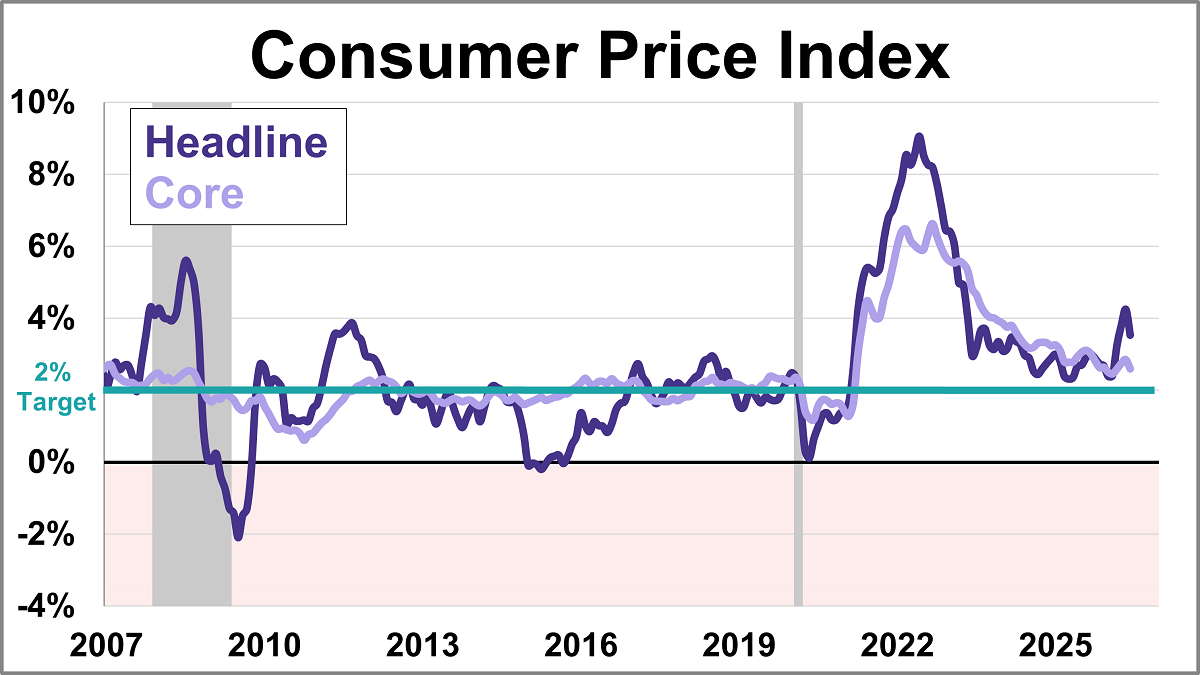
Inflation cooled for the first time in five months, coming in at 3.5% year-over-year in June. The headline figure for the Consumer Price Index (CPI) was lower than the 3.8% forecast.
Top 10 Charts of 2026: Mid-Year Review

Discover the top 10 most-read charts from the first half of 2026, covering historic market valuations, record margin debt, recession indicators, and global index performance.
The Great Migration: ICI Data Highlights Shift From Mutual Funds to ETFs

Unpack the latest ICI flow data as long-term mutual funds bleed billions directly into low-cost, model-ready ETFs.
Advisor Perspectives’ Top Articles in June Cover Practical Concerns

The articles that dominated the views in June were very much focused on the realities of investing, addressing everything from how inflation can affect your returns to incorporating AI into retirement evaluations.
Moving Averages of the Ivy Portfolio and S&P 500: June 2026
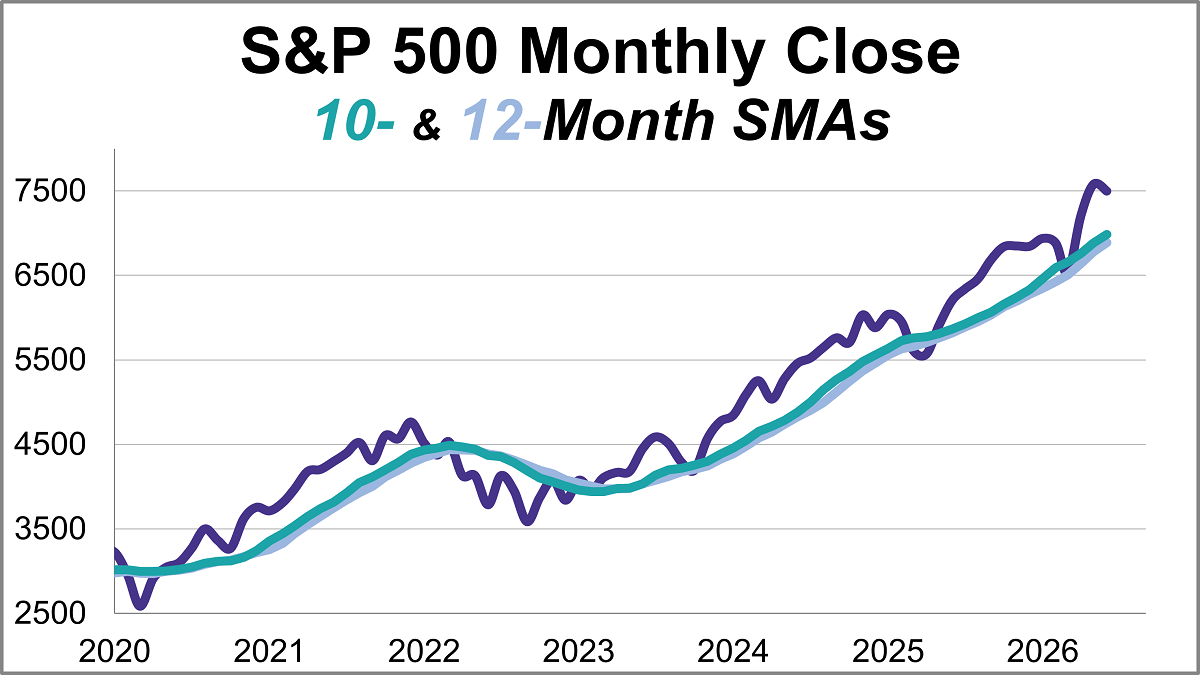
Valid until the market close on July 31, 2026
This article provides an update on the monthly moving averages we track for the S&P 500 and the Ivy Portfolio after the close of the last business day of the month.
Long-Term Trends for Multiple Jobholders in the US: June 2026
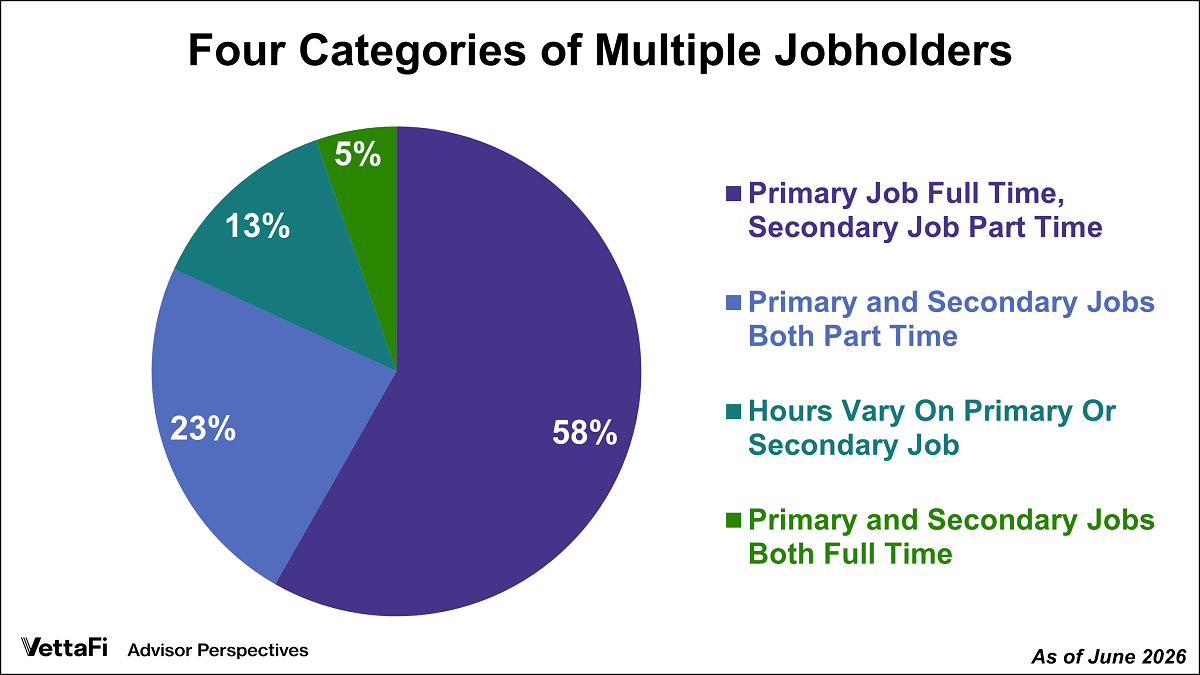
Multiple jobholders accounted for 5.2% of civilian employment in June.
A Closer Look at Full-time and Part-time Employment: June 2026
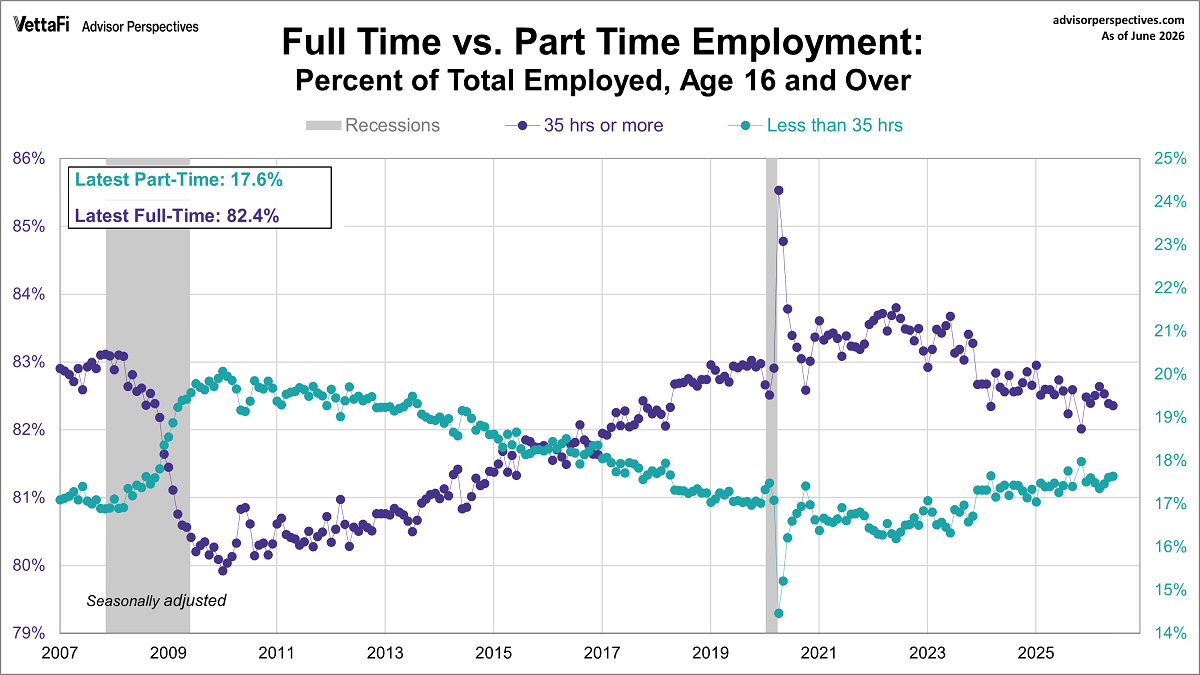
June's employment report showed that 17.6% of total employed workers were part time and 82.4% of total employed workers were full-time.
Unemployment Claims and the CLF as a Recession Indicator: June 2026
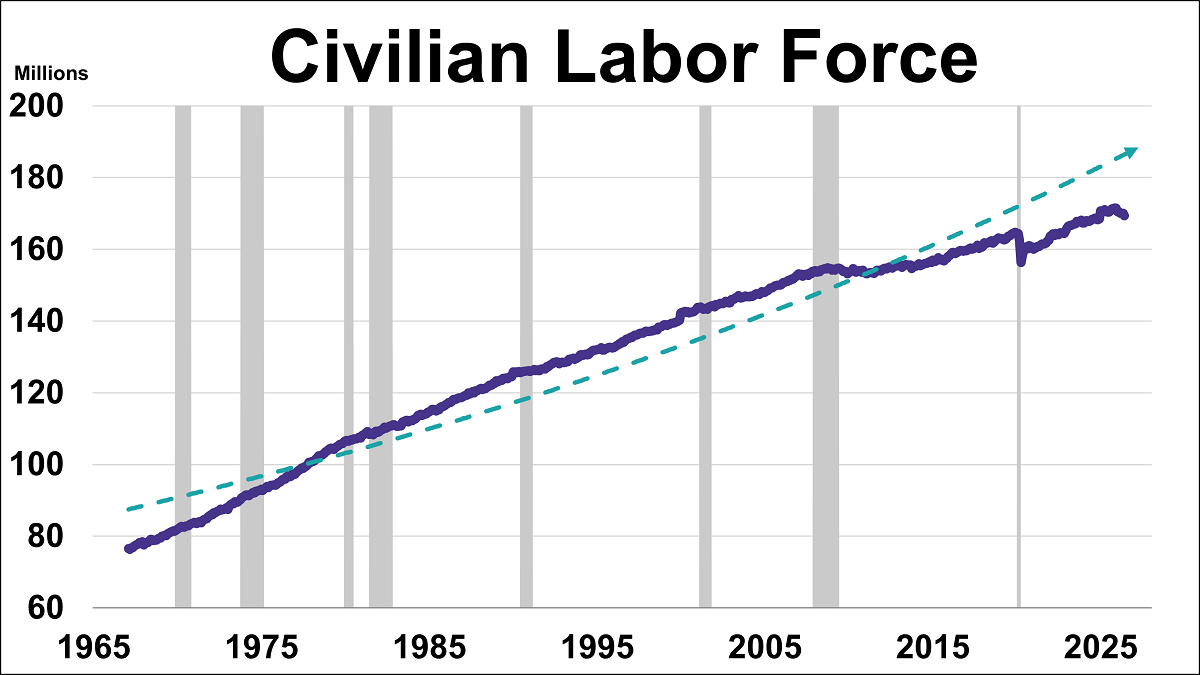
What does the ratio of unemployment claims to the civilian labor force tell us about where we are in the business cycle and recession risk?
Existing Home Sales Drop in June as Median Prices Hit All-Time High
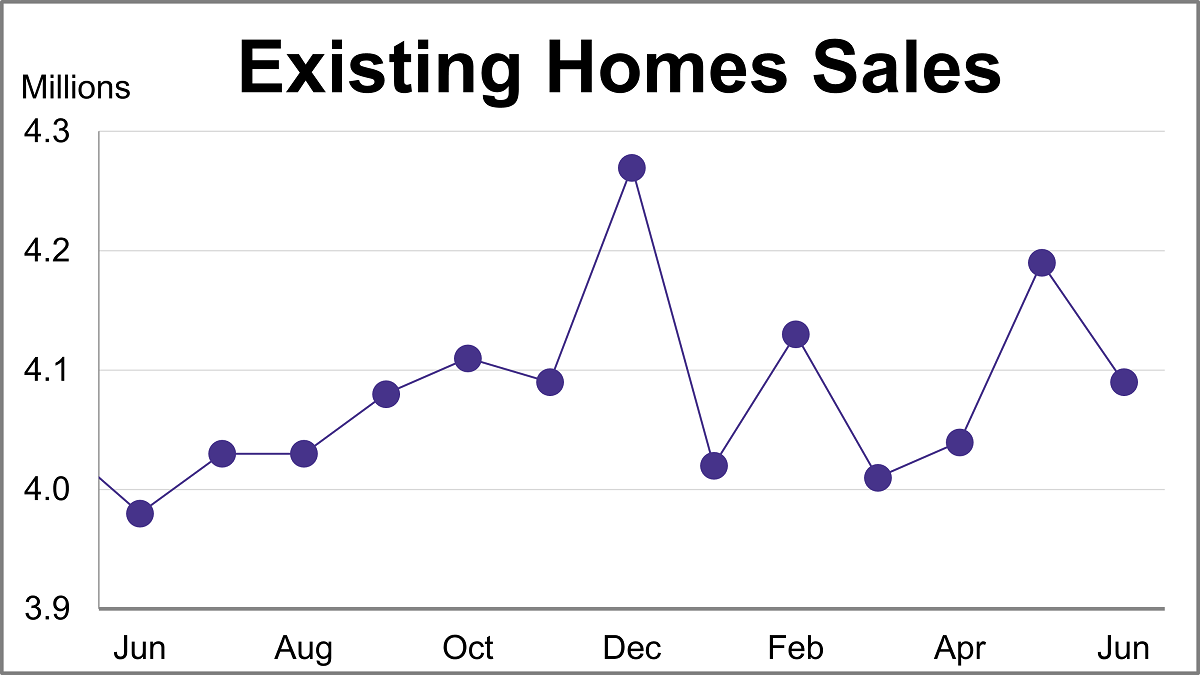
Existing home sales unexpectedly fell 2.4% in June as the median home price surged to a record high of $440,600.
Model Portfolios Gain Momentum in 2026: How ETFs Fit In

Model portfolios are seeing billions in inflows, and part of that success may be from how these strategies implement ETFs and private assets.
The S&P 500, Dow, and Nasdaq: Real Returns Since 2000 Peak (June 2026)
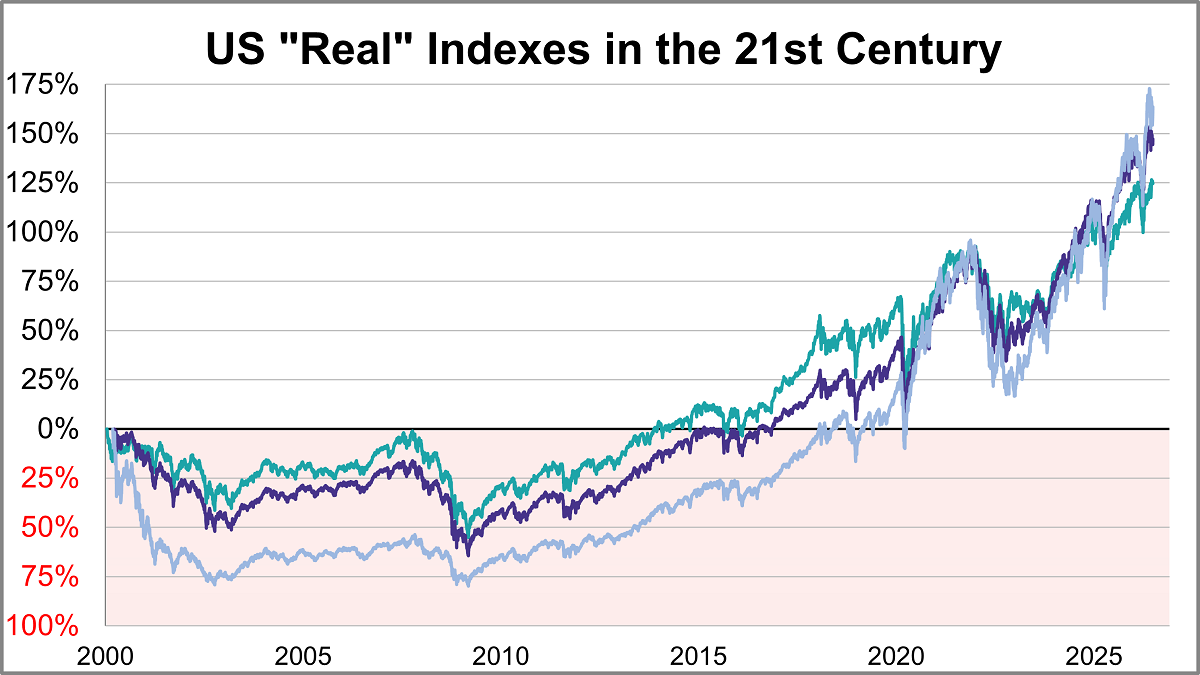
Here is a look at real (inflation-adjusted) charts of the S&P 500, Dow 30, and Nasdaq composite since their 2000 highs. We've updated this through the June 2026 close.
Secular Bull and Bear Market Trends: June 2026
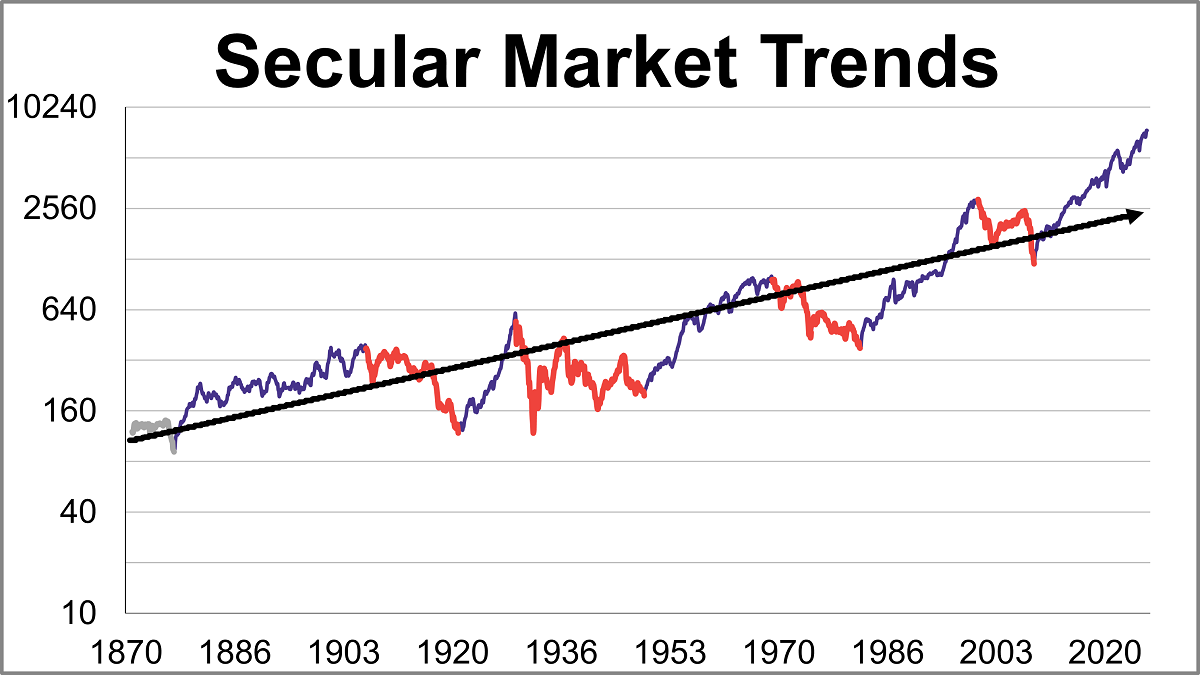
The S&P 500 real monthly averages of daily closes reached a its all-time high in May 2026. Let's examine the past to broaden our understanding of the range of historical bull and bear market trends in market performance.
Will AI Replace Financial Advisors? What to Know

AI represents a huge shift for financial advisors, who are always learning and adapting to a shifting investing landscape.
Crestmont P/E and Market Valuation: June 2026
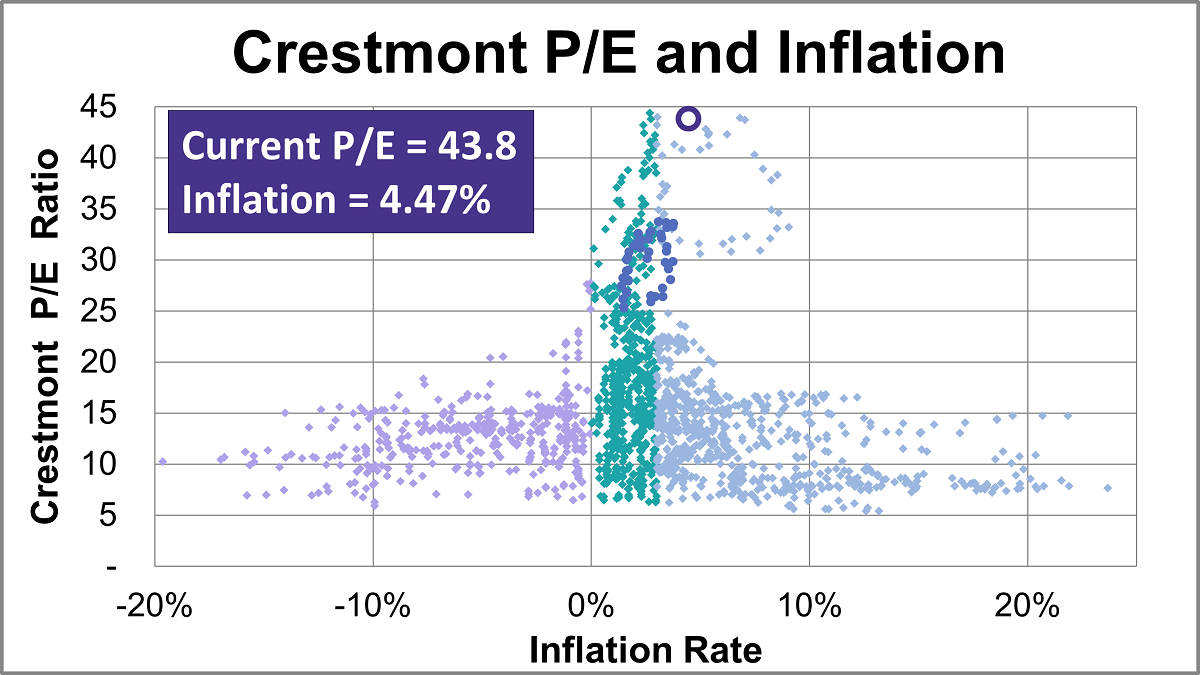
Based on June's S&P 500 average of daily closes, the Crestmont P/E of 43.8 is 185% above its arithmetic mean, 212% above its geometric mean, and is in the 100th percentile of this 14-plus-decade series.
Q-Ratio and Market Valuation: June 2026
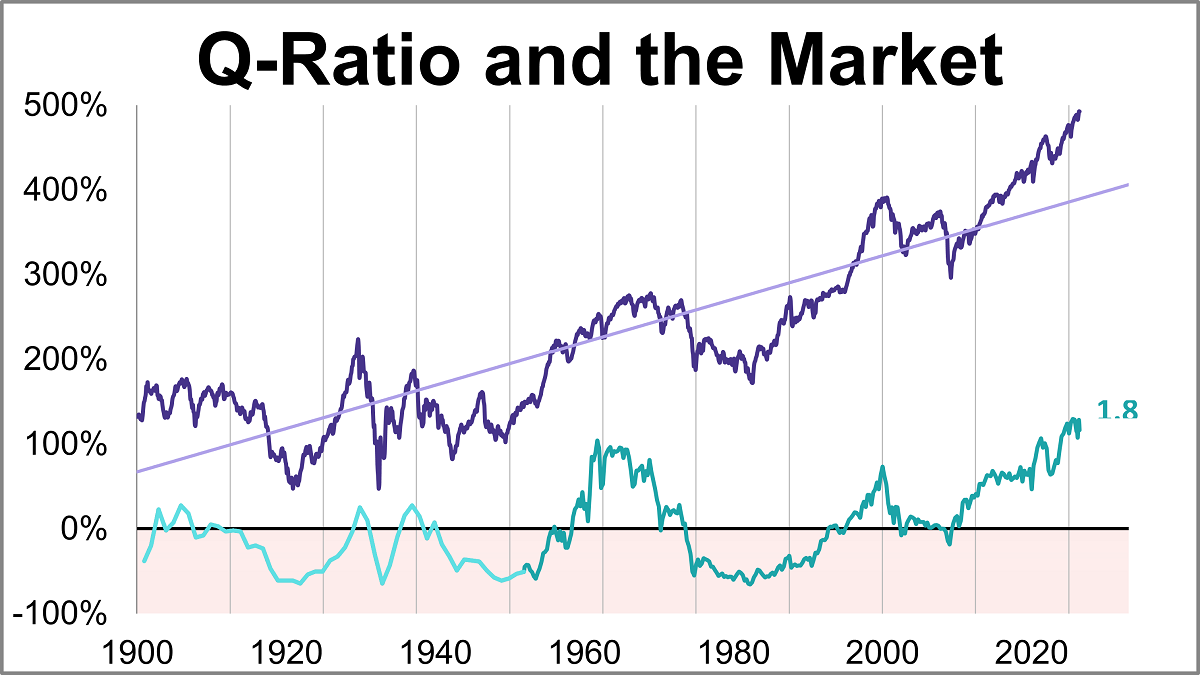
The Q Ratio is the total price of the market divided by the replacement cost of all its companies. As of June 2026, the latest Q-ratio is at 1.83.
Short-Term Energy Outlook: July 2026
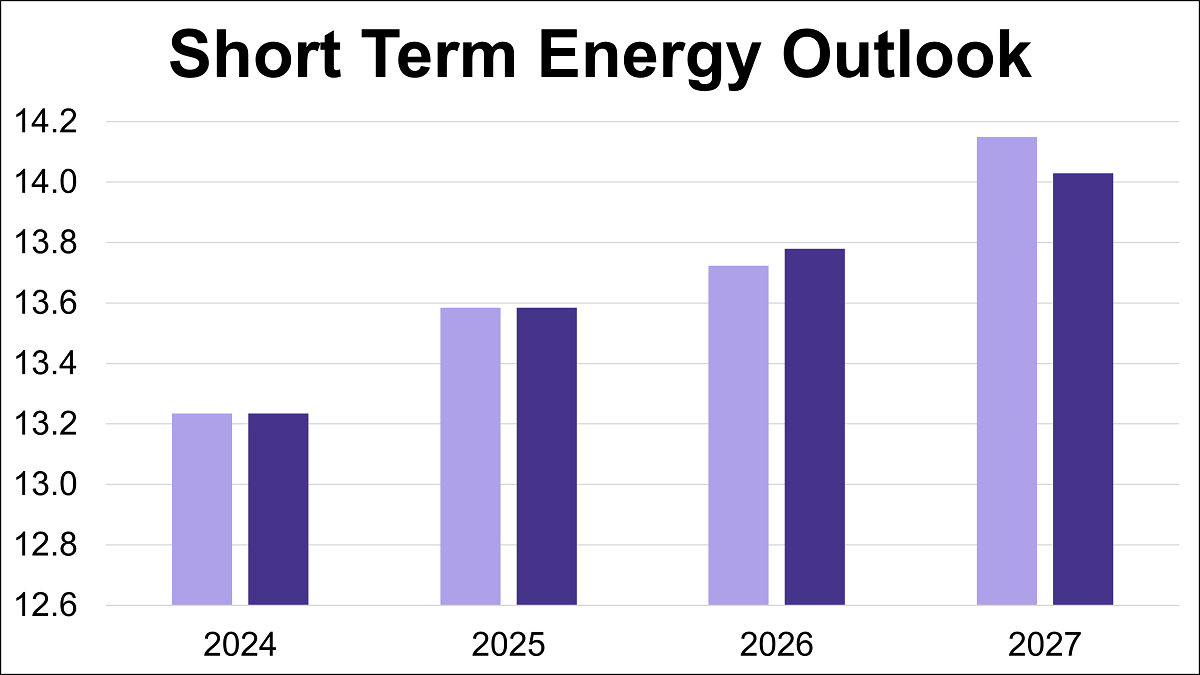
The U.S. Energy Information Administration (EIA) has released its latest Short-Term Energy Outlook (STEO), providing forecasts for energy markets. This article presents the annual production outlooks for crude oil, natural gas, and natural gas liquids (NGLs), comparing the July 2026 projections against the previous month's estimates.
Market Valuation, Inflation and Treasury Yields: June 2026
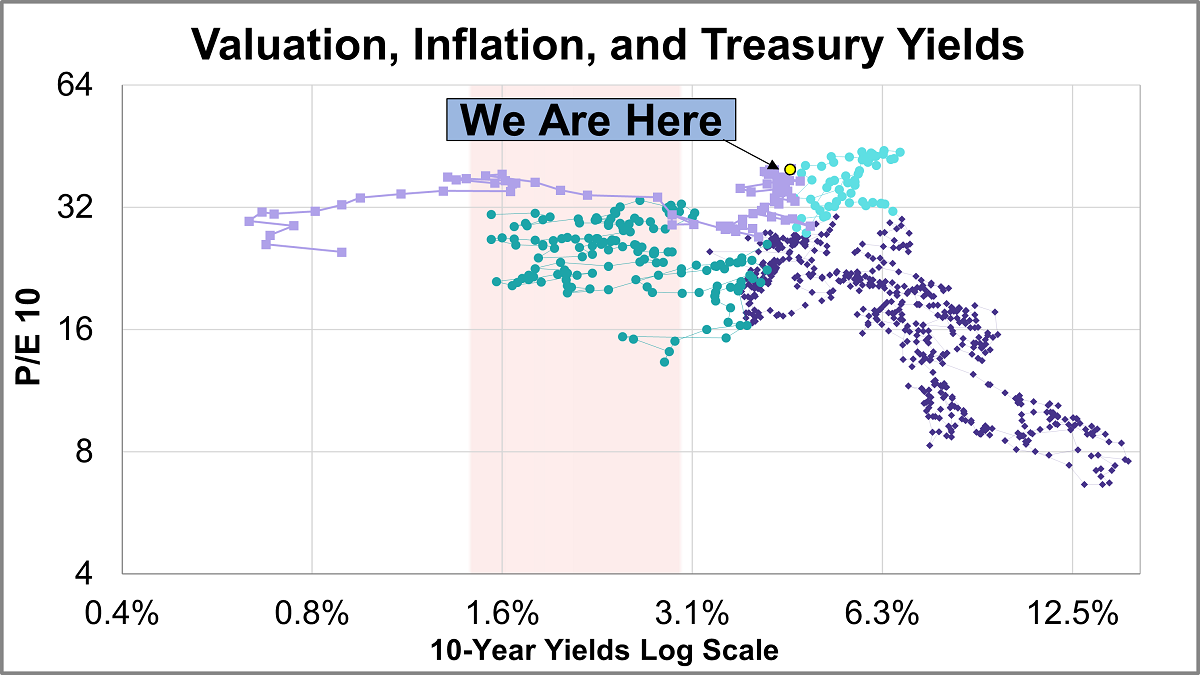
Our monthly market valuation updates have long had the same conclusion: US stock indexes are significantly overvalued, which suggests cautious expectations for investment returns. This analysis focuses on the P/E10 ratio, key indicator of market valuation, and its correlation with inflation and the 10-year Treasury yield.
P/E10 and Market Valuation: June 2026
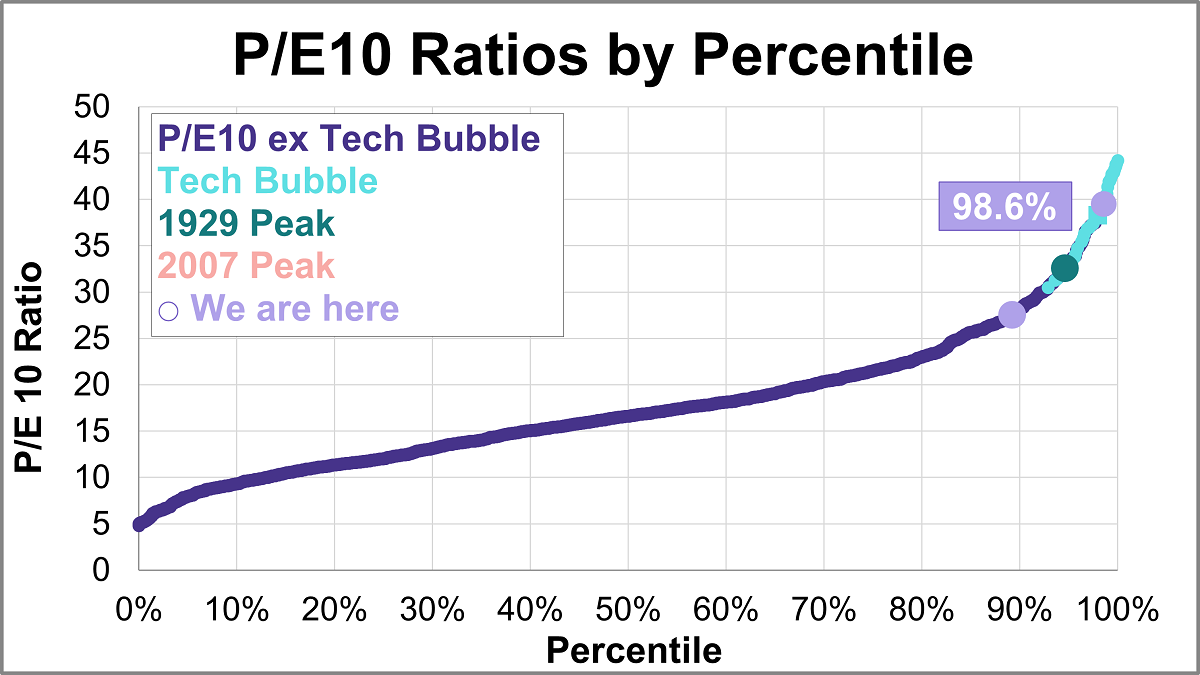
Here is the latest update of a popular market valuation method, Price-to-Earnings (P/E) ratio, using the most recent Standard & Poor's "as reported" earnings and earnings estimates, and the index monthly average of daily closes for the past month. The latest trailing twelve months (TTM) P/E ratio is 25.3 and the latest P/E10 ratio is 39.5.
Regression to Trend: S&P Composite 207% Above Trend in June
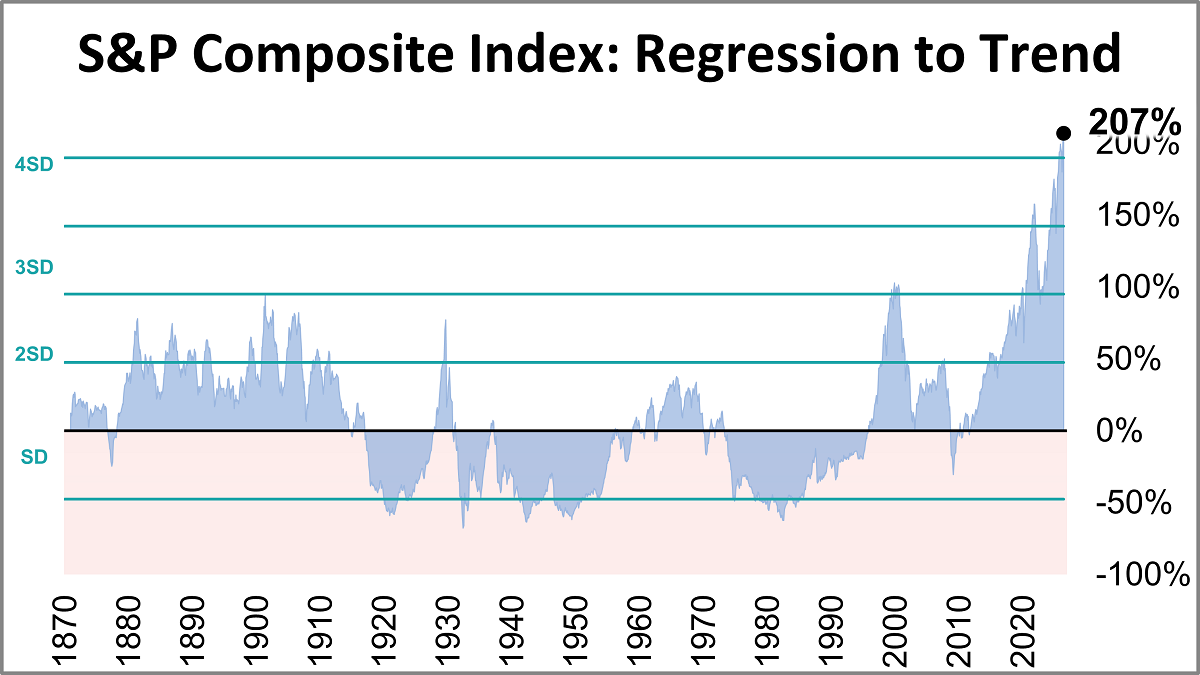
The inflation-adjusted S&P Composite Index was 207% above its long-term trend at the end of June.
Trade Deficit Expands Over 40% in May
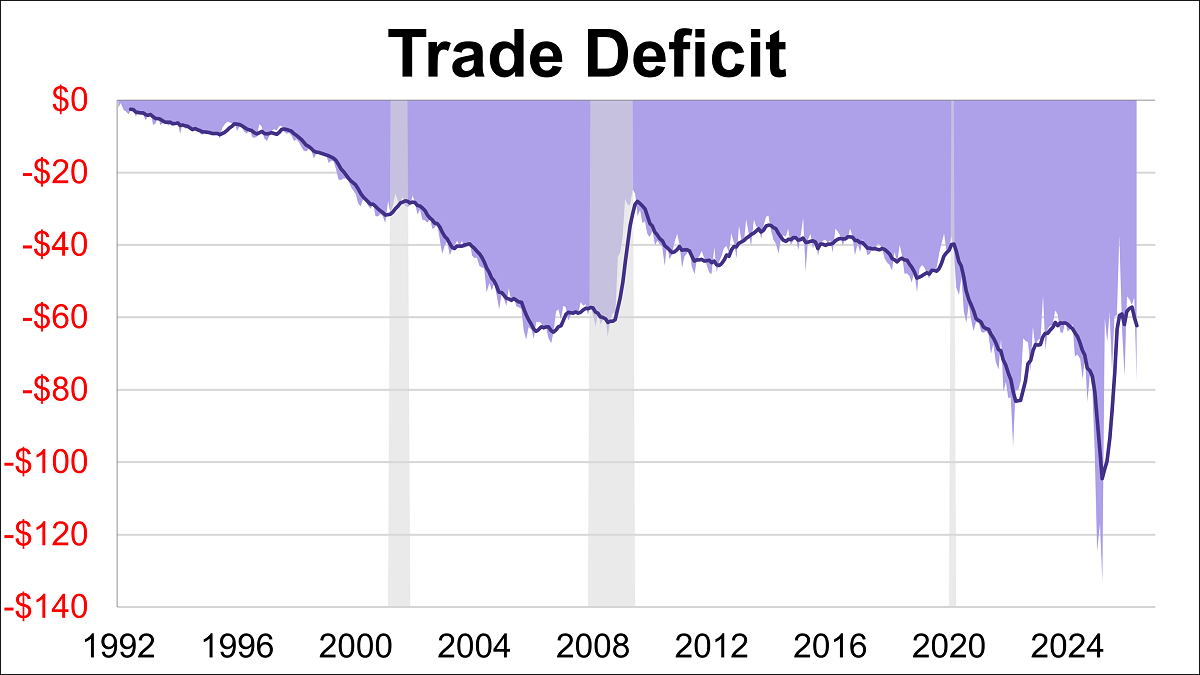
The U.S. trade deficit expanded over 40% in May to $77.59B, its widest gap since March 2025. The latest reading missed the forecast of -$78.30B.
Initial 5-ETF Lineup Released for Newly Launched Trump Accounts

The U.S. Treasury launched the Trump Accounts for childhood wealth building. Discover the five low-cost index ETFs anchoring the program.
S&P Global Services PMI: Growth Reaches 4-Month High
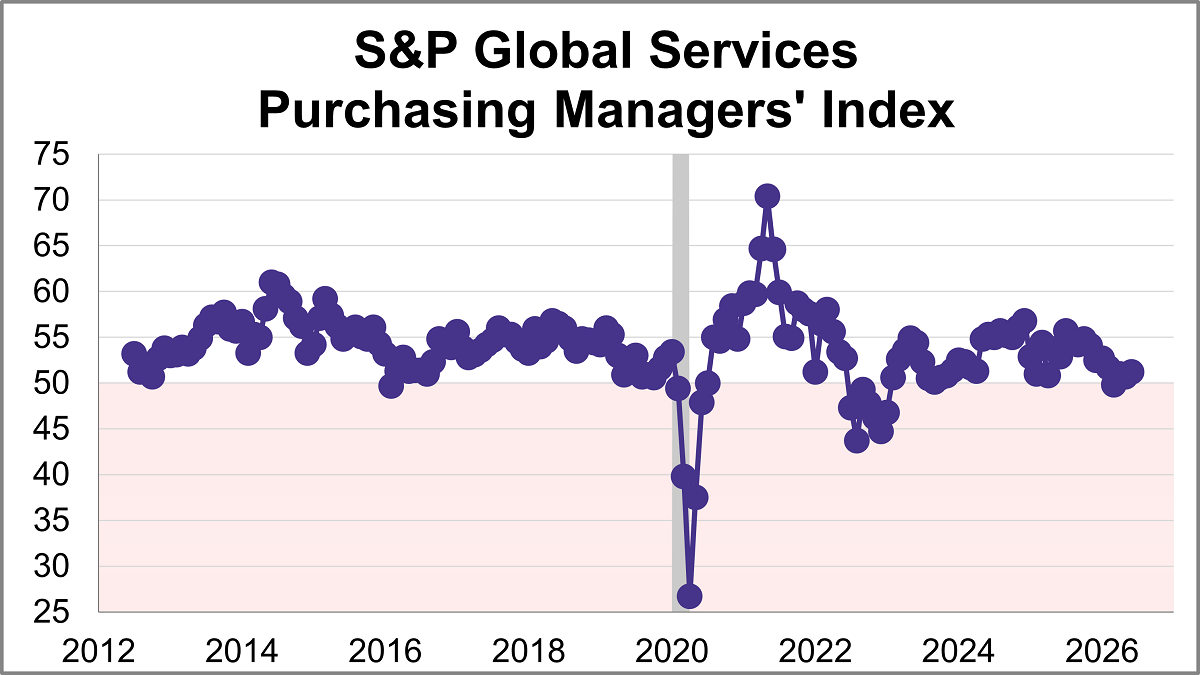
The June U.S. Services Purchasing Managers' Index (PMI) from S&P Global rose 0.5 points to 51.2, indicating a modest rise in service sector activity. The latest reading was just below the forecast of 51.3 and marked the strongest expansion in four months.
ISM Services PMI: Continued Expansion in June
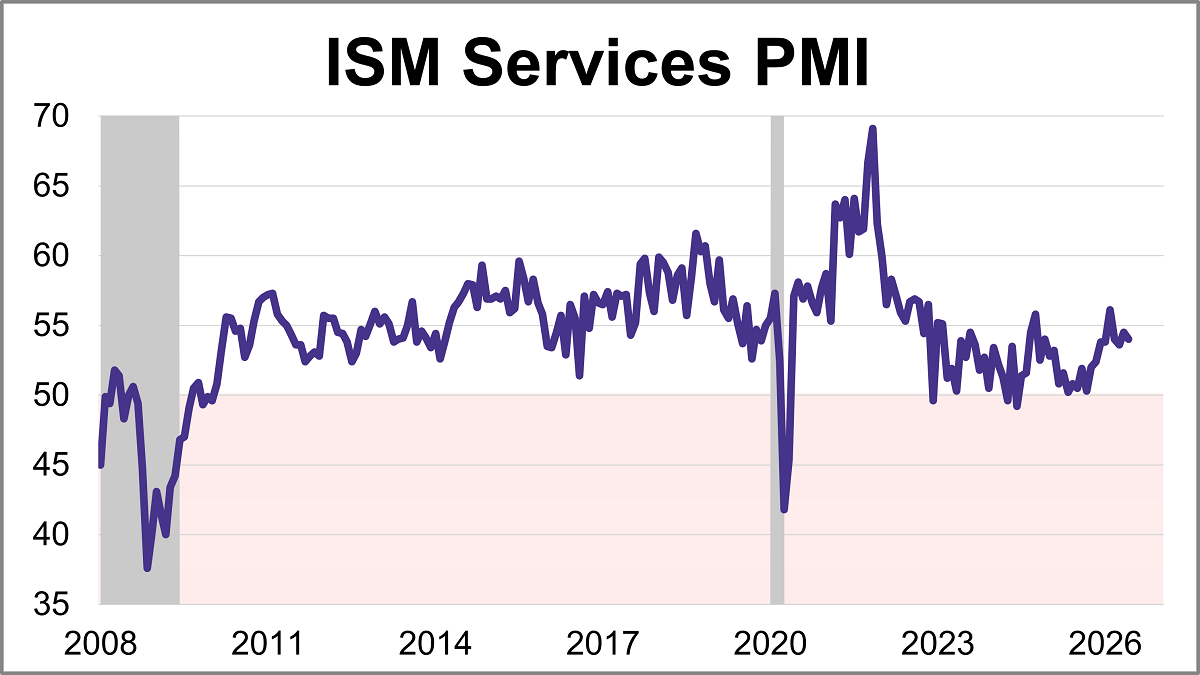
The Institute for Supply Management (ISM) released its June Services Purchasing Managers' Index (PMI), with the headline composite index at 54.0. This was slightly lower than the forecast of 54.2 but keeps the index in expansion territory for a 24th consecutive month.
The Big Four Recession Indicators: Employment
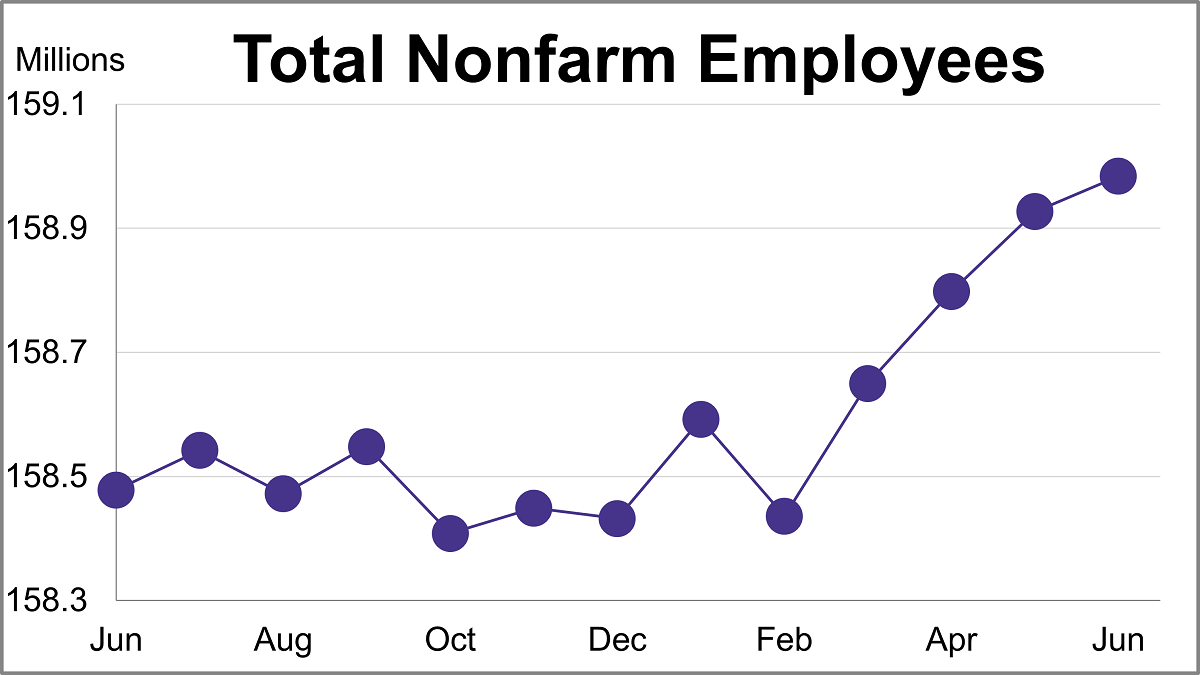
There is a general belief that there are four big indicators that the NBER Business Cycle Dating Committee weighs heavily in their cycle identification process. This commentary focuses on one of these indicators: nonfarm employment. In June, total nonfarm payrolls increased by 57,000 while the unemployment rate ticked down to 4.2%.
Employment Report: 57K Jobs Added in June, Lower Than Expected
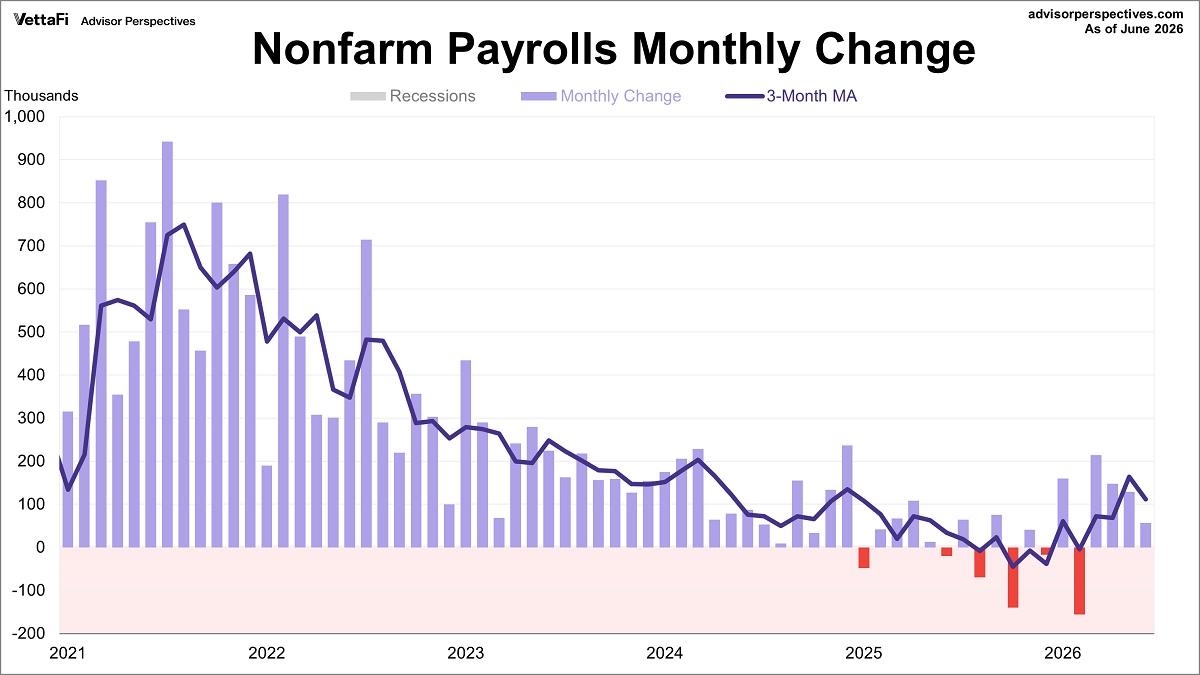
The latest employment report showed that 57,000 jobs were added in June, down from May's 129,000 gain. This figure was significantly lower than the projected addition of 114,000 jobs. Meanwhile, the unemployment rate unexpectedly ticked down to 4.2%.
America's Driving Habits: May 2026
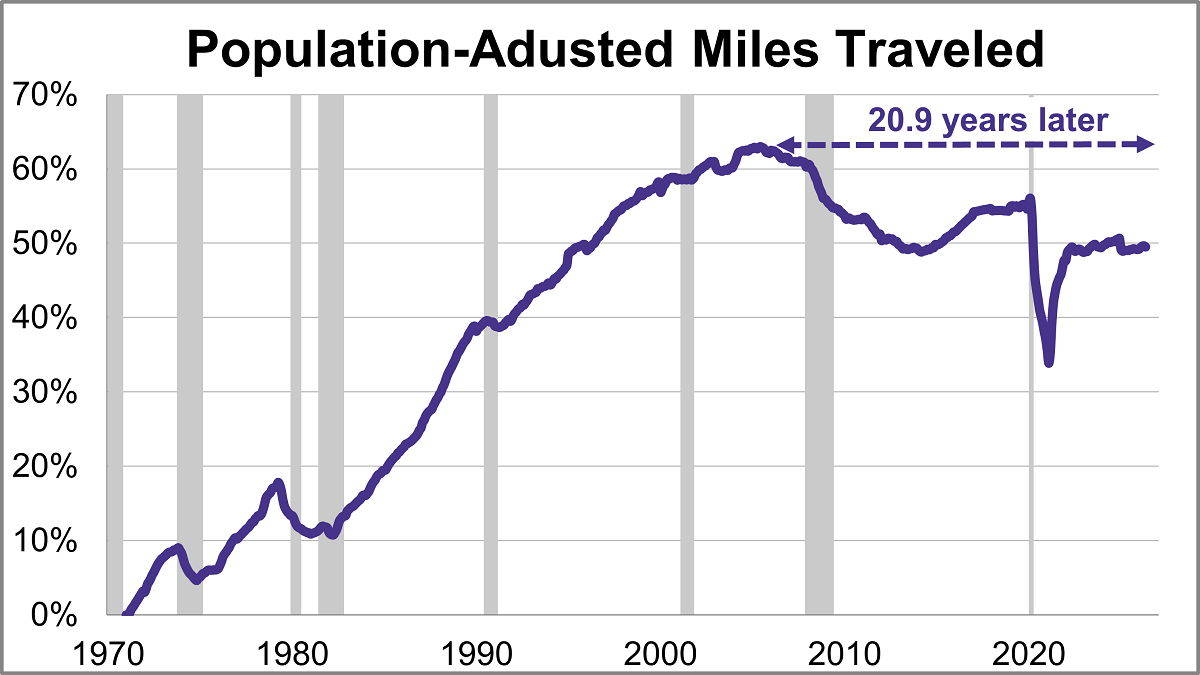
Travel on all roads and streets decreased in May. The 12-month moving average was down 0.06% month-over-month but was up 0.93% year-over-year. However, if we factor in population growth, the 12-month MA of the civilian population-adjusted data (age 16-and-over) was down 0.10% month-over-month and up 0.32% year-over-year.
Vehicle Sales Reach 9-Month High in June
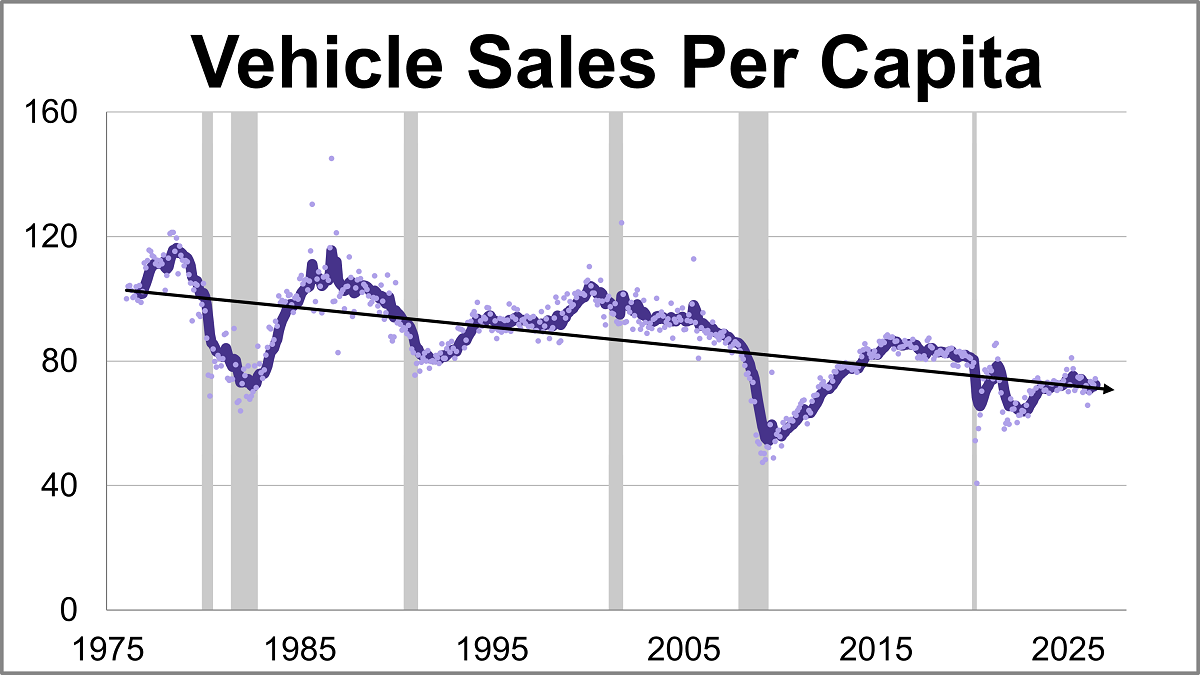
Vehicle sales rose to their highest level in nine months in June, coming in at a seasonally adjusted annual rate of 16.523 million units. This represents a 2.8% increase from the previous month and a 4.4% rise from one year ago.
S&P Cotality Case-Shiller Index: Home Price Growth Remains Constrained
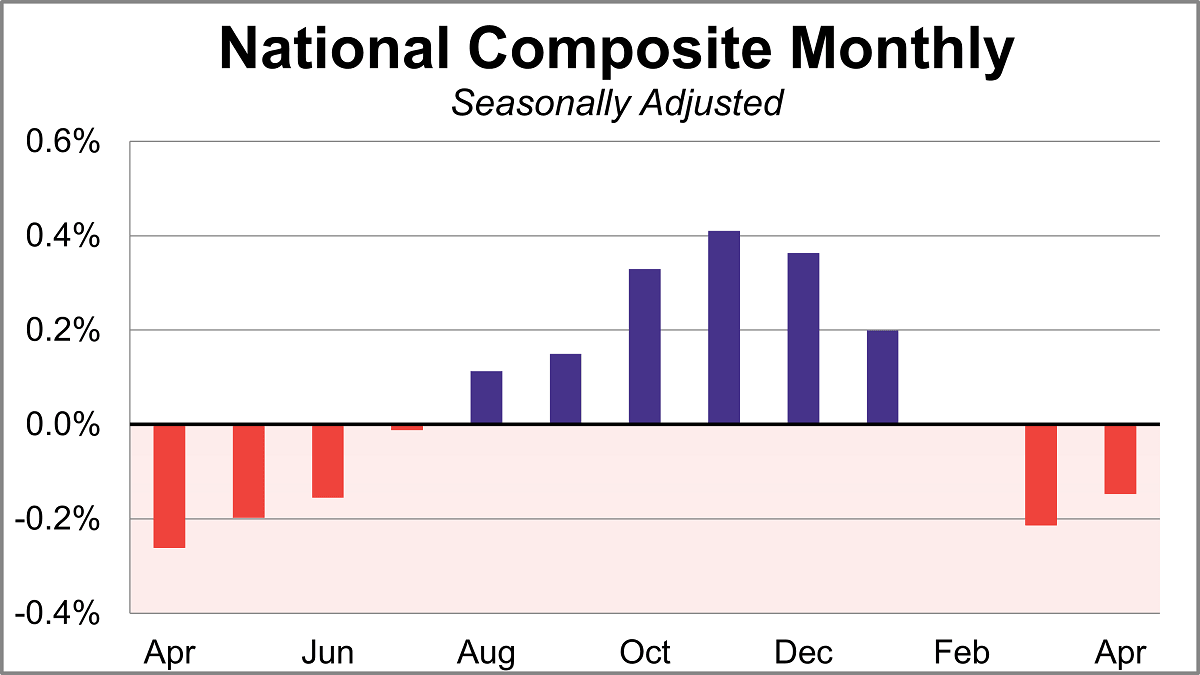
Home prices fell for a second straight month in April according to the S&P Cotality Case-Shiller index, as the housing slowdown intensifies. On a seasonally adjusted basis, the national index dropped 0.1% month-over-month and was up 0.8% year-over-year.
10-Year Treasury Yield Long-Term Perspective: June 2026
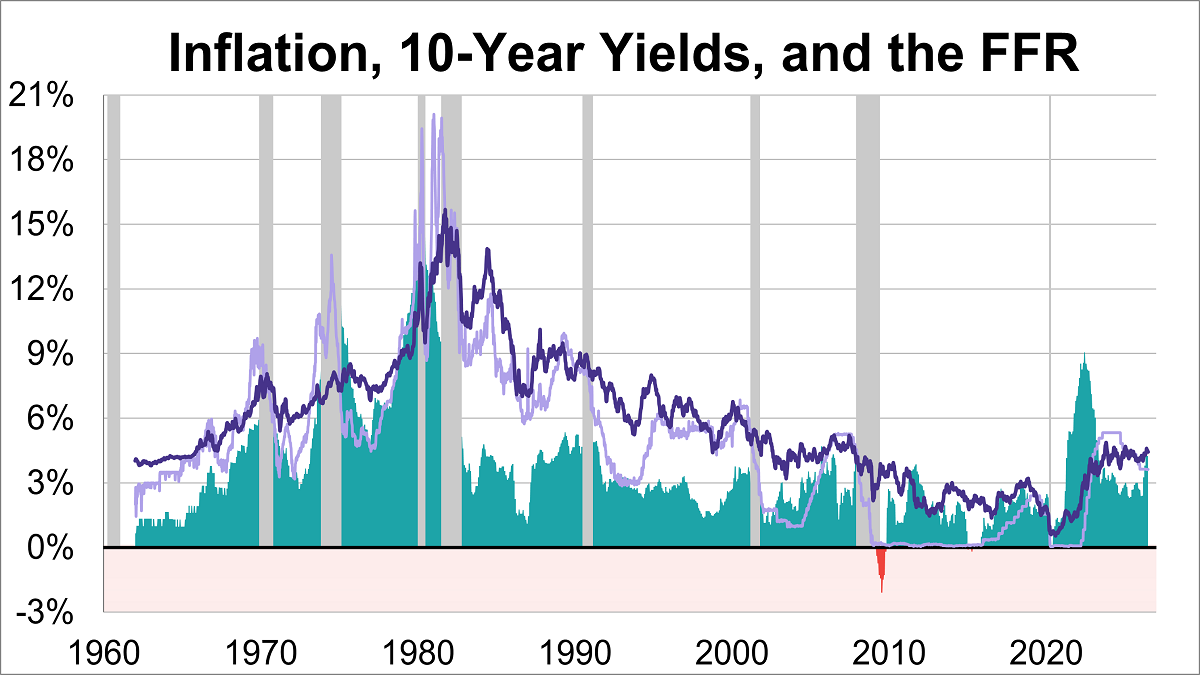
The 10-year Treasury yield has experienced dramatic fluctuations, ranging from a peak of 15.68% in October 1981, during the height of the Volcker era, to a historic low of 0.55% in August 2020, amidst the economic uncertainty of the pandemic. At the end of June 2026, the weekly average stood at 4.44%.
ISM Manufacturing PMI: Slightly Slower Expansion in June
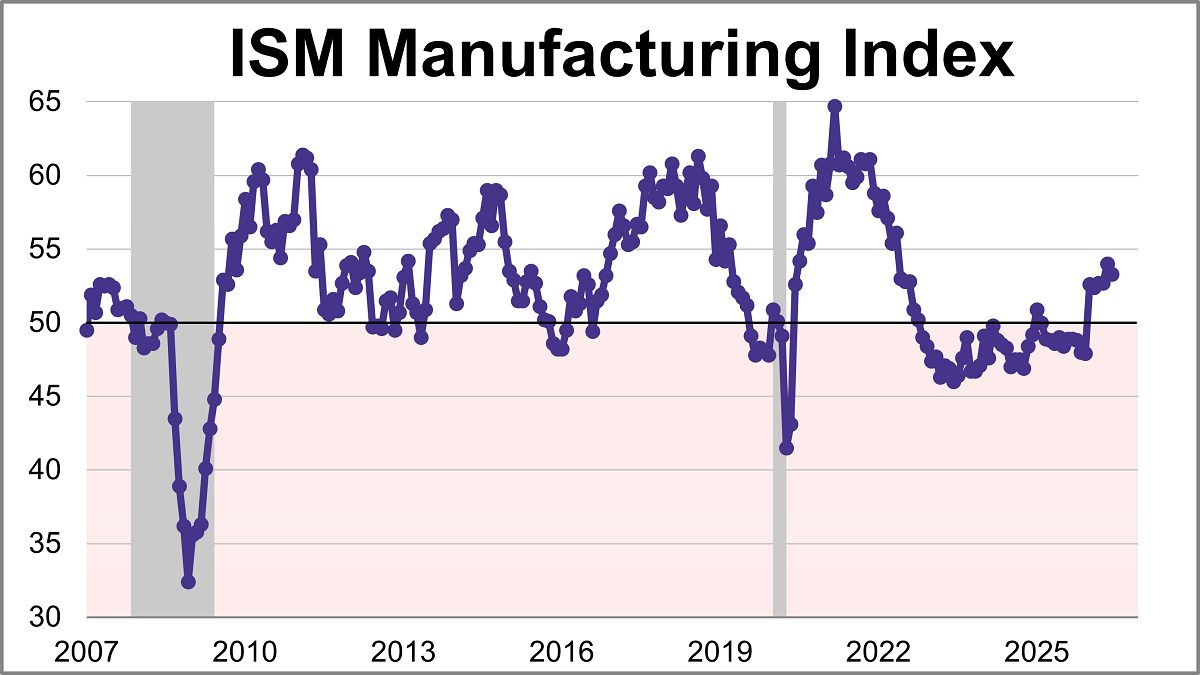
The Institute for Supply Management (ISM) manufacturing purchasing managers index (PMI) came in at 53.3 in June, down from 54.0 in May, marking slightly slower growth. The latest reading was just below the 53.8 forecast and is the index's sixth straight month in expansion territory.
S&P Global US Manufacturing PMI™: Growth Slips to 3-Month Low Despite Expansion
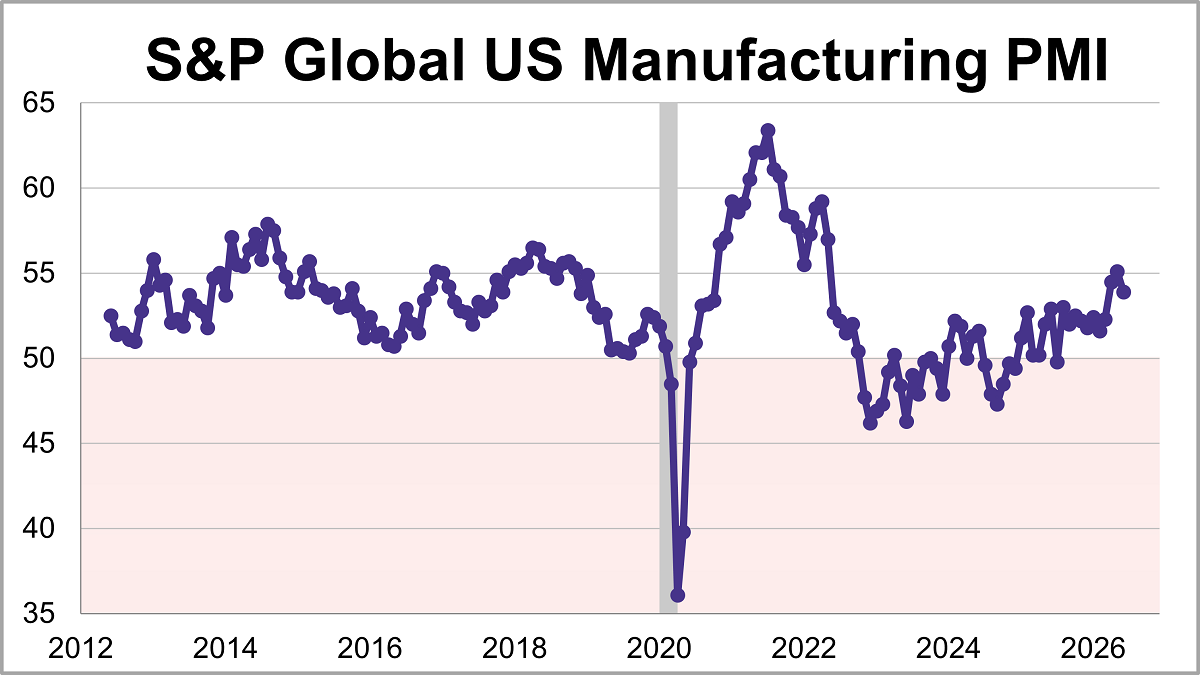
U.S. manufacturing expanded for an eleventh straight month in June but the growth eased to its lowest level in three months. The S&P Global PMI fell 1.2 points to 53.9 last month, falling short of the 55.7 forecast.
ADP National Employment Report: 98K Private Jobs Added in June
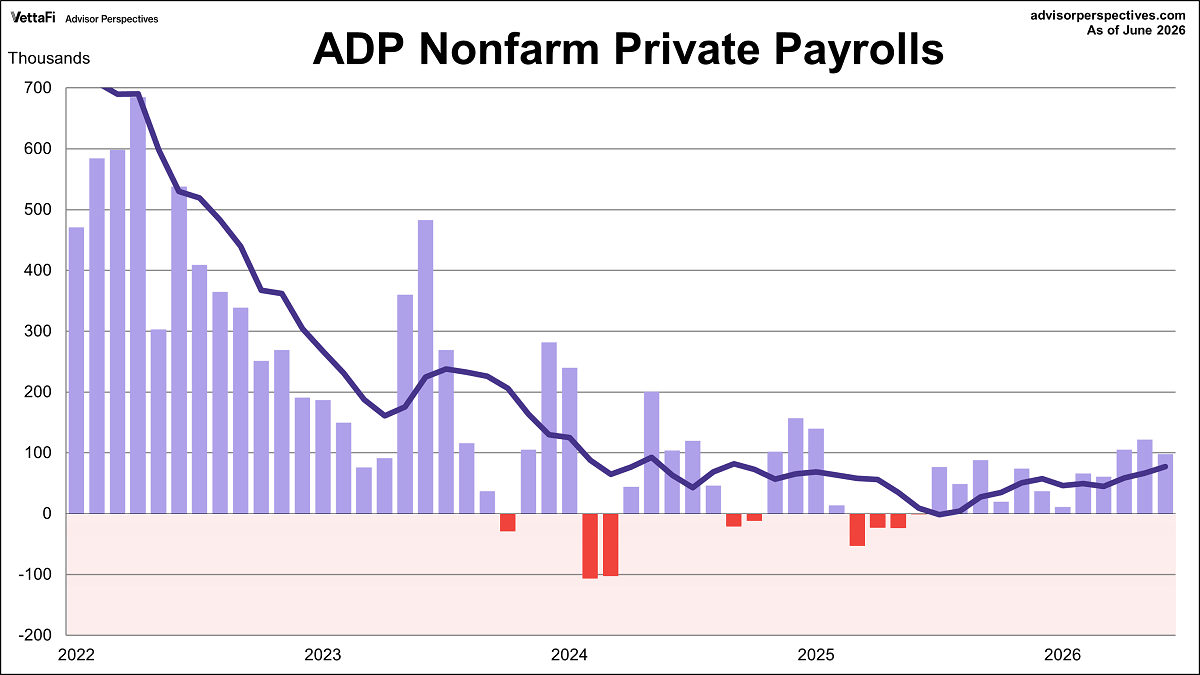
The ADP employment report revealed that 98,000 nonfarm private jobs were added in June, the twelfth straight month of growth. However, the latest figure was below the projected 118,000 addition.
Two Measures of Consumer Attitudes: June 2026
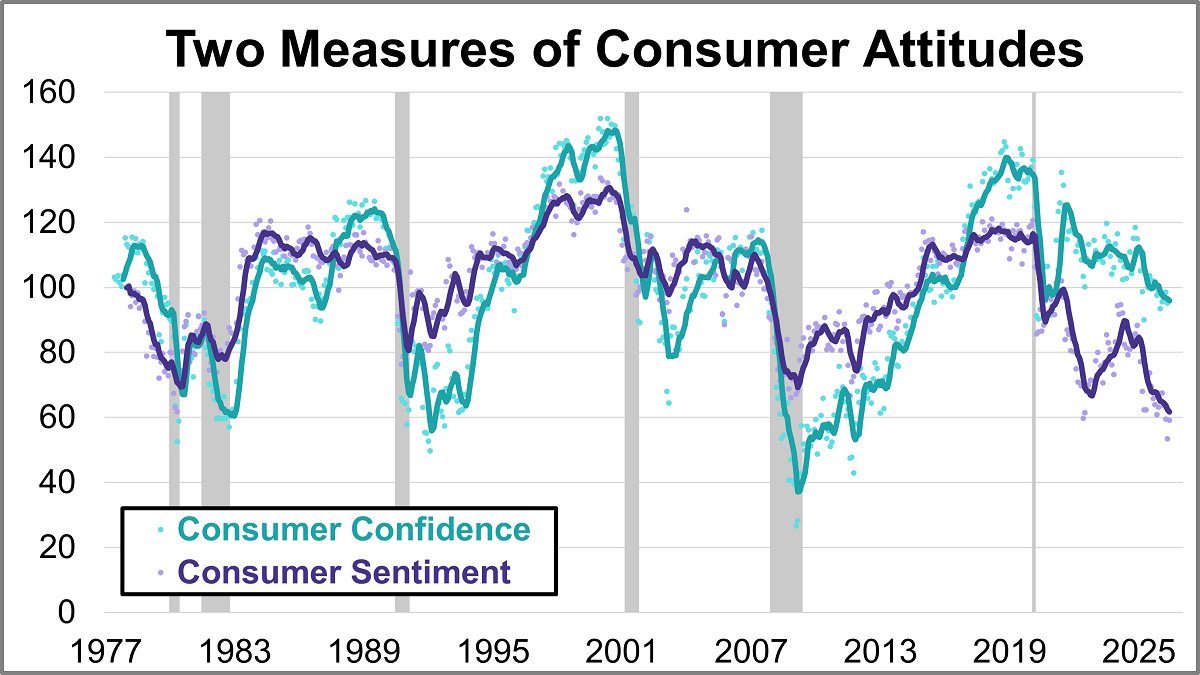
What are consumers thinking about the economy? Their collective mood offers crucial clues for businesses, investors, and policymakers alike. In June, the two leading benchmarks, the University of Michigan’s Consumer Sentiment Index (MCSI) and the Conference Board’s Consumer Confidence Index (CCI), offered similar views with both showing slight improvement despite ongoing inflation concerns.
Chicago PMI Cools in June but Maintains Expansion
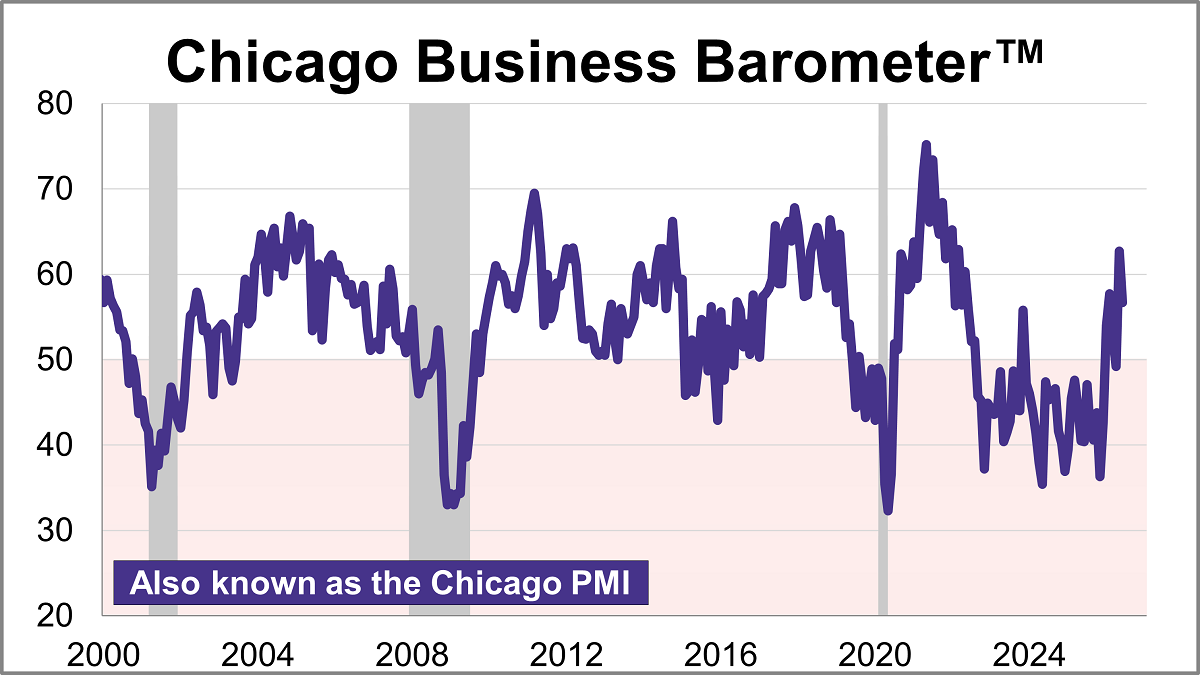
The Chicago Purchasing Managers’ Index cooled 6.0 points in June to 56.7, signaling an expansion in regional business activity for a second straight month. The latest reading was higher than the projected 55.7.
FHFA House Price Index Retreats from Record High
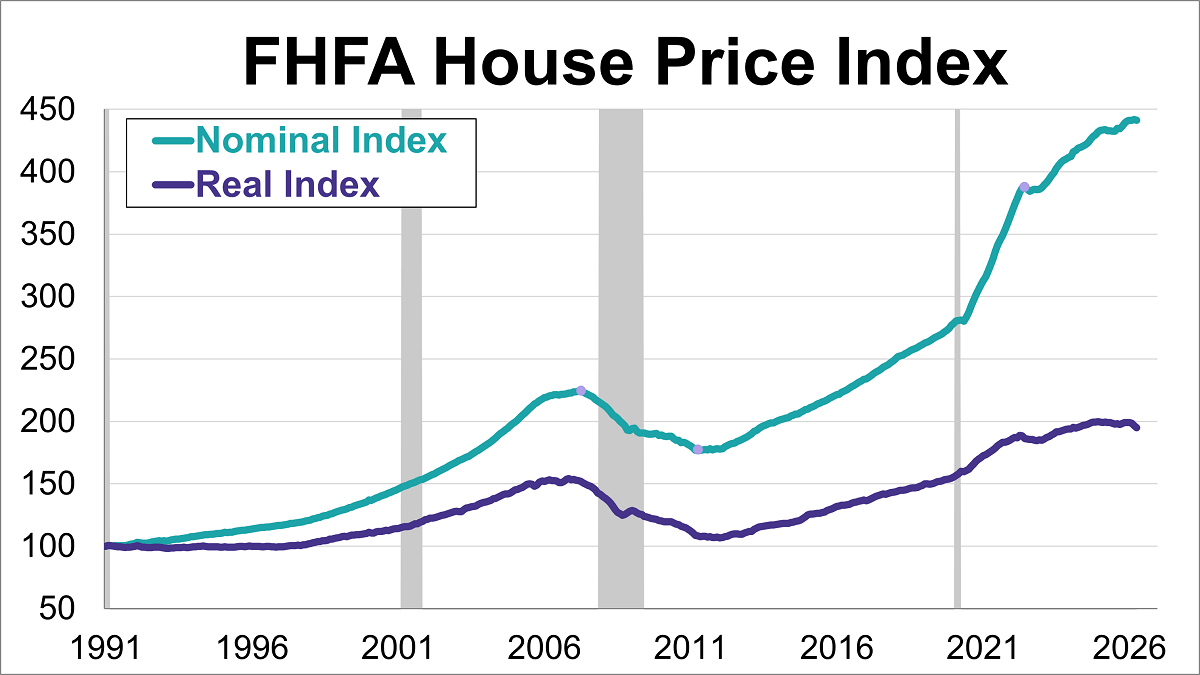
The Federal Housing Finance Agency (FHFA) House Price Index (HPI) retreated in April, falling 0.1% from the previous month's record high to 441.4.
Job Openings Reach 2-Year High in May
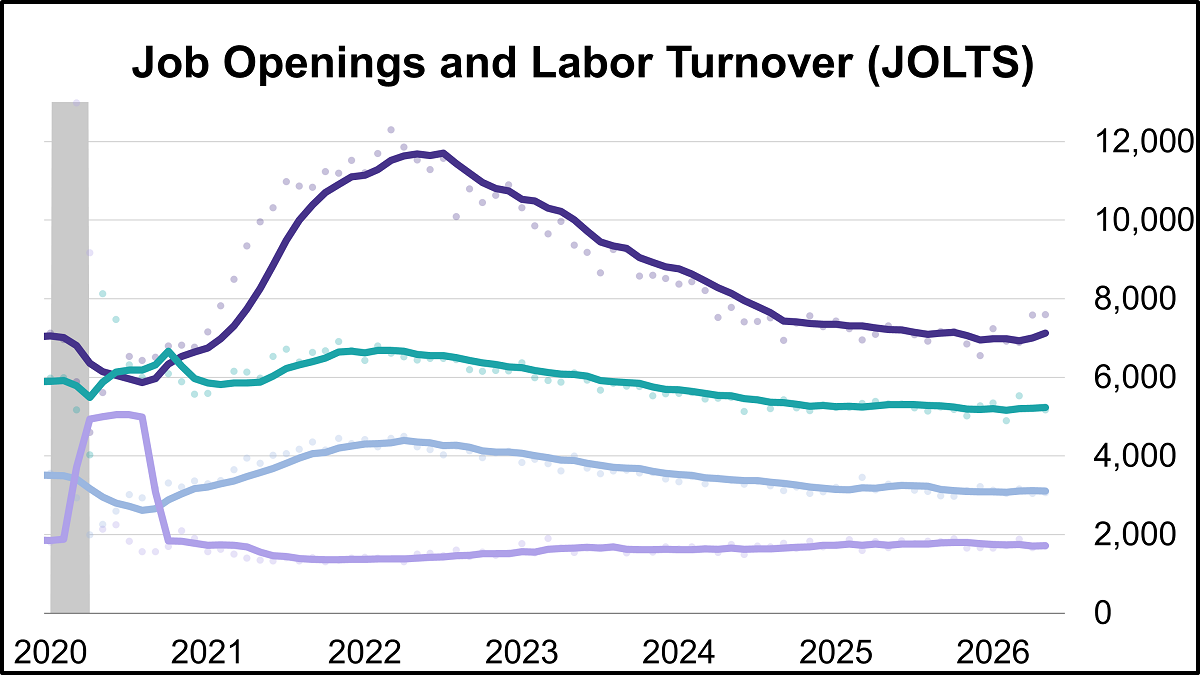
Job openings reached their highest level in two years in May, hitting 7.594 million vacancies according to the latest Job Openings and Labor Turnover Survey (JOLTS). The latest reading was higher than the projected 7.280 million openings.
Consumer Confidence Inched Down in June
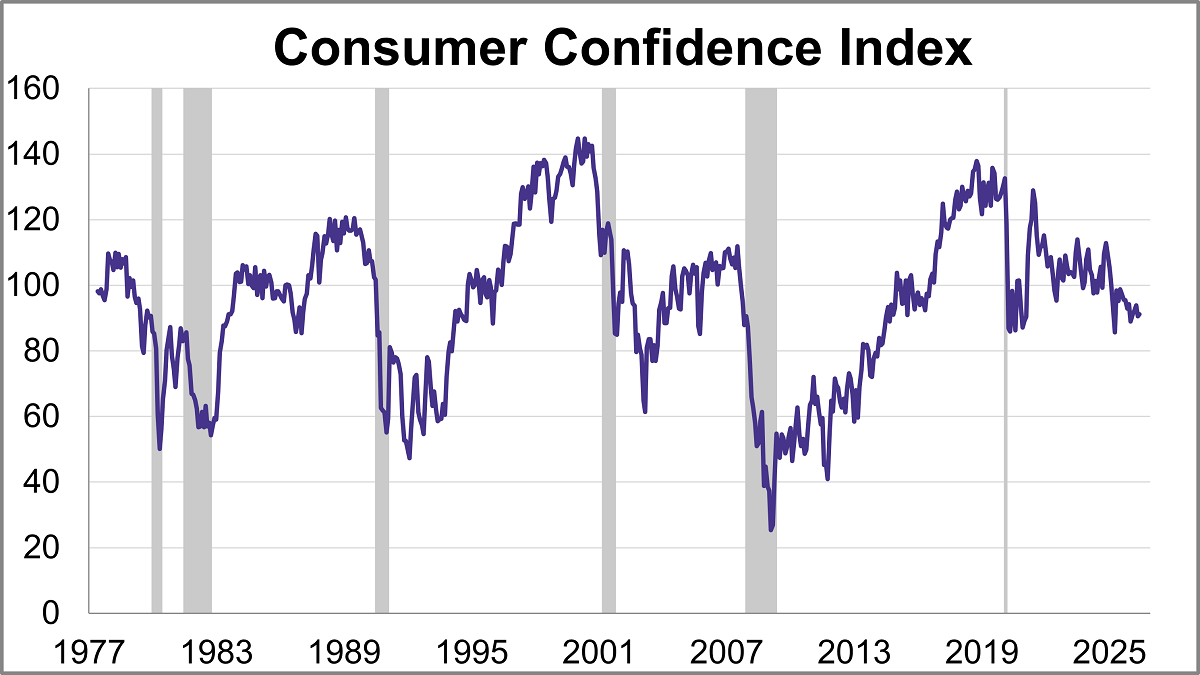
The Conference Board's Consumer Confidence Index® inched up in June, rising 0.6 points to 91.2. Despite the improvement, the index came in below the forecast of 94.4.
What the Top 10 Active ETFs YTD Can Tell Us

The top 10 active ETFs YTD by fund flows show some intriguing trends and successful names that may pique the interest.
Dallas Fed Manufacturing: Stable Business Conditions in June
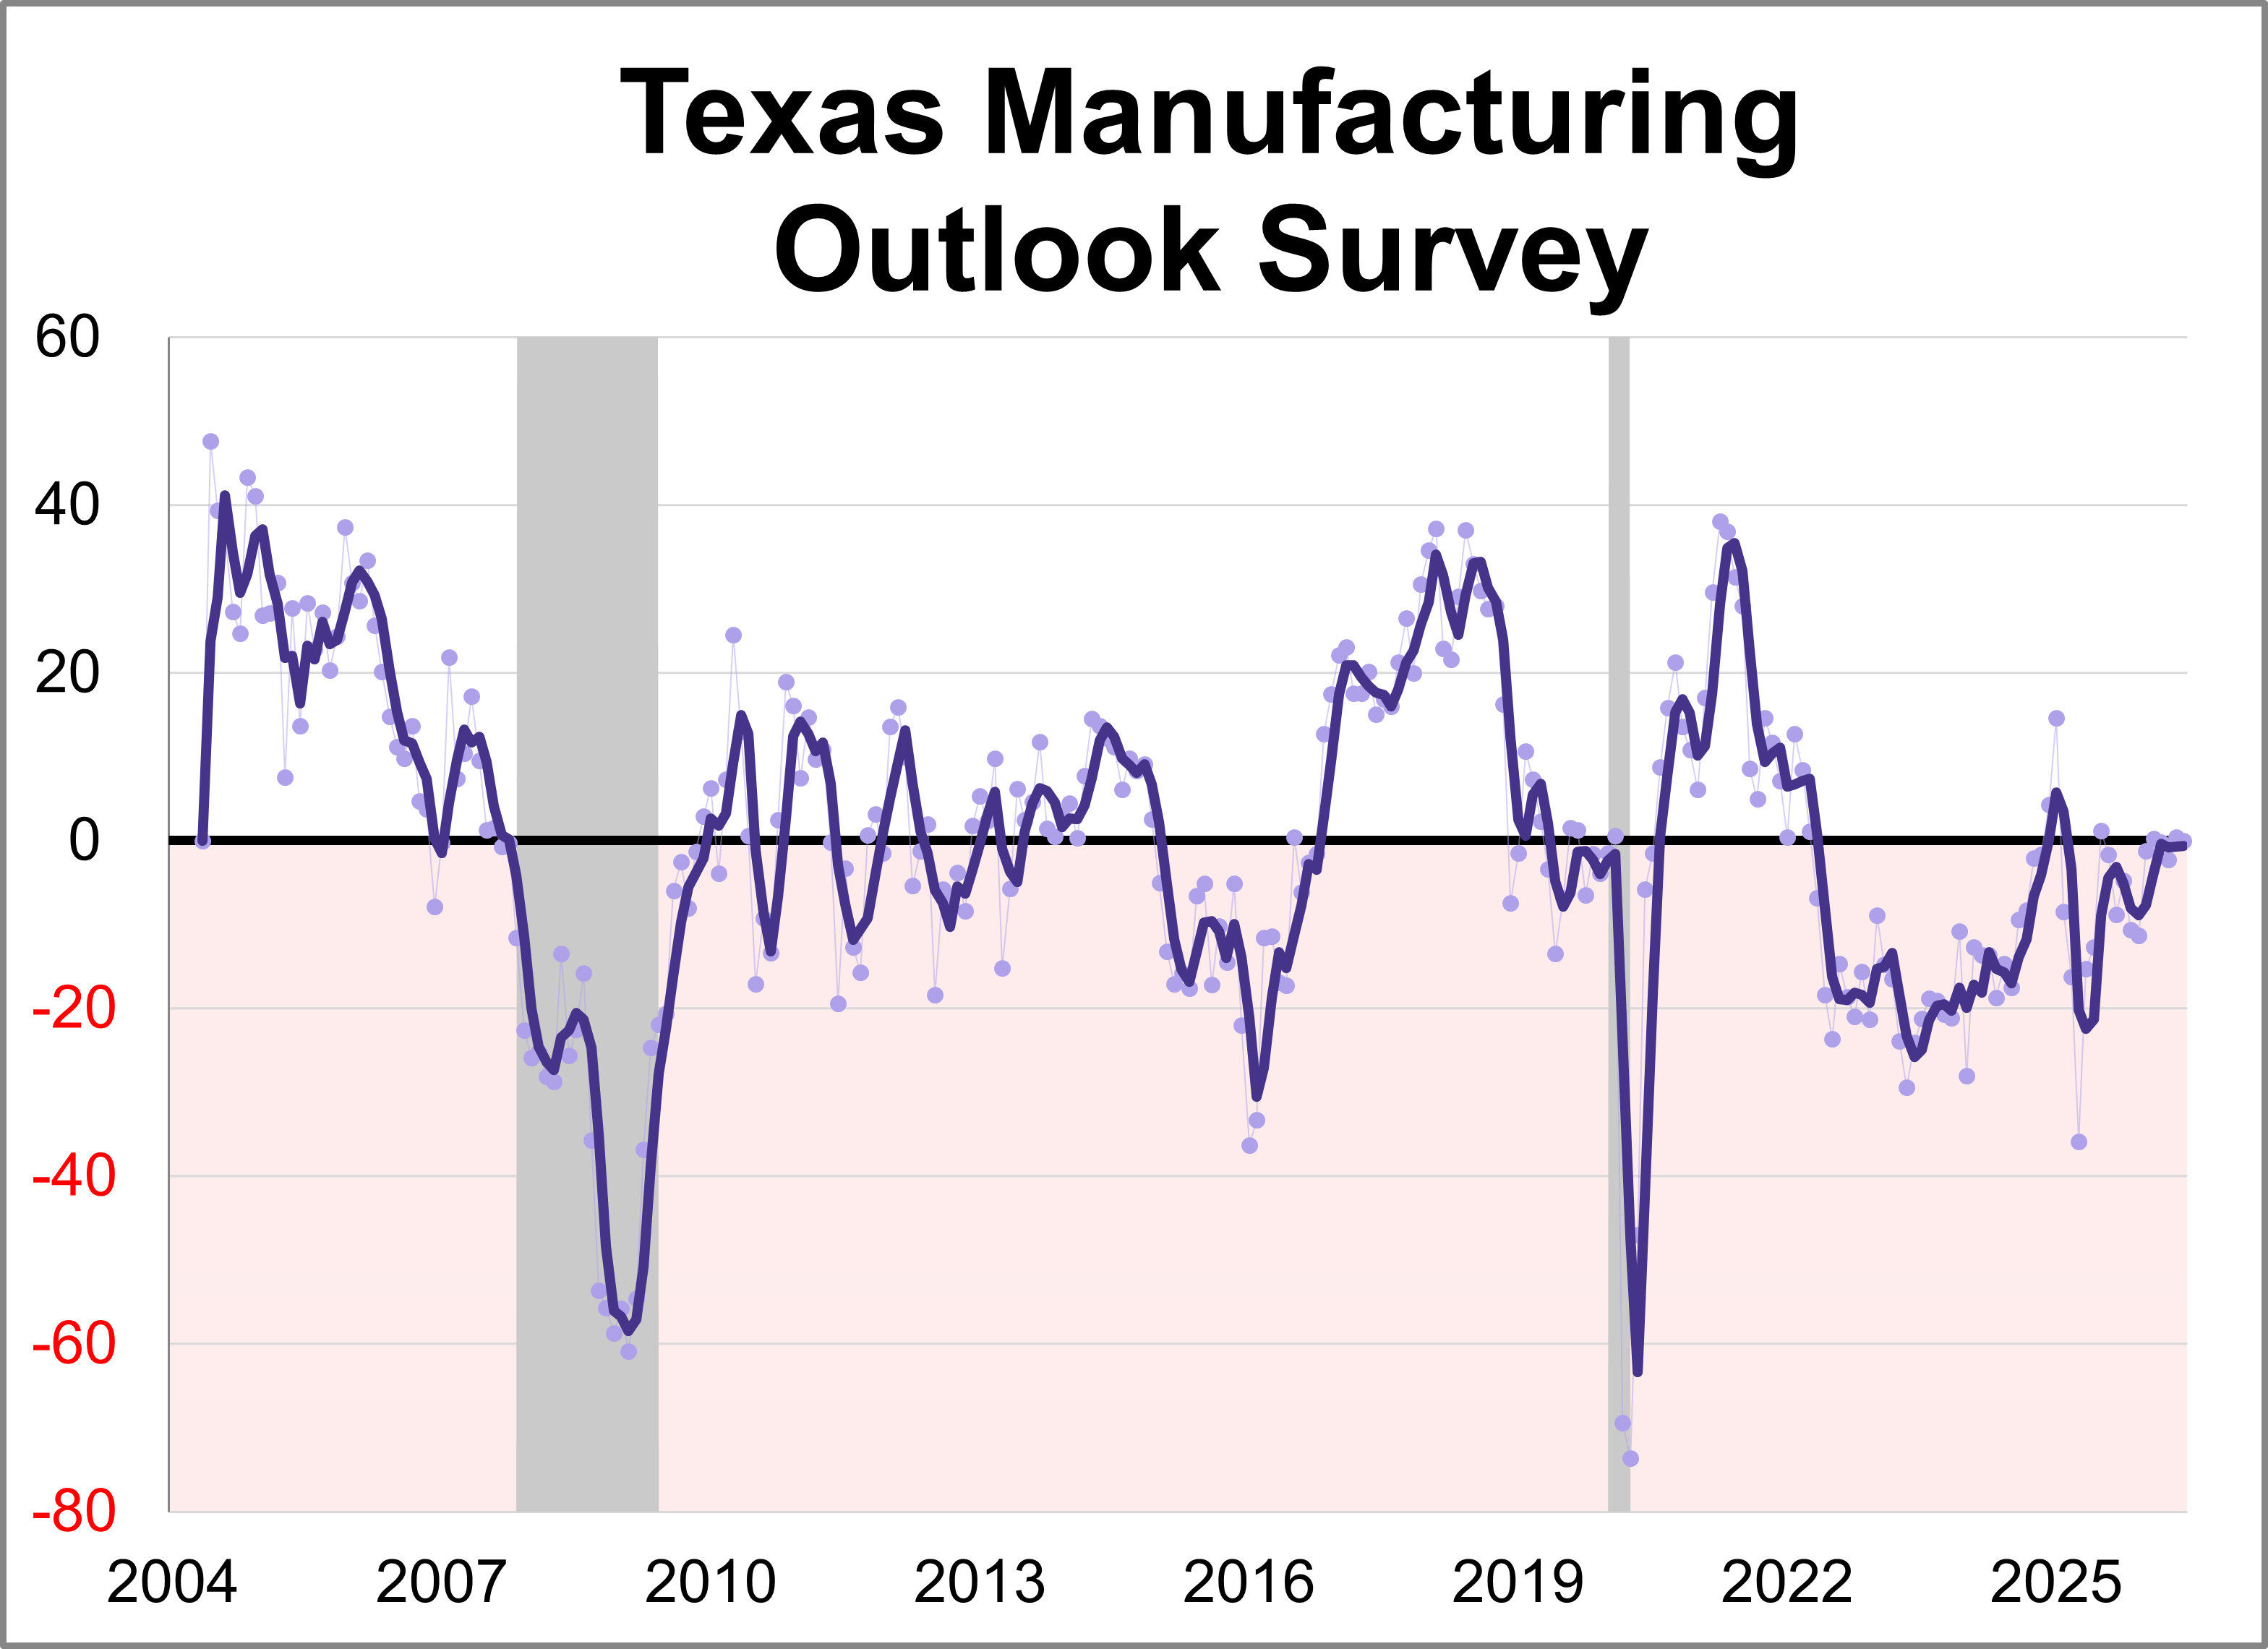
The Dallas Fed released its Texas Manufacturing Outlook Survey (TMOS) for June. The general business activity index fell 0.4 points to 0.0, indicating slower growth of manufacturing activity and stable business conditions perceptions.
Weekly Economic Snapshot: Inflation Remains the Central Focus

Last week’s data reaffirmed that inflation pressures remain the defining narrative across the economic landscape.
Core PCE Inflation at 3.4% in May, Highest Level Since 2023
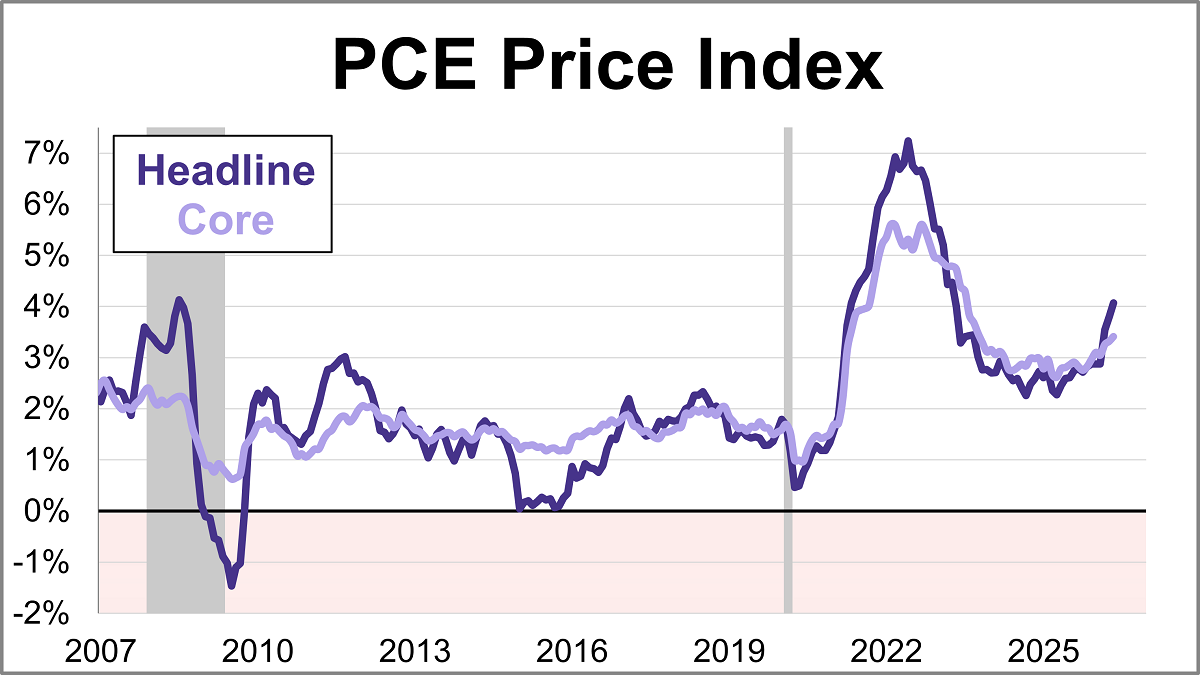
The Federal Reserve’s preferred inflation gauge, the core PCE price index, climbed 3.4% year-over-year in May. This marks the highest level since October 2023 and marks a pickup from April's 3.3% reading. On a monthly basis, core prices rose 0.3%.
Two Measures of Inflation: May 2026
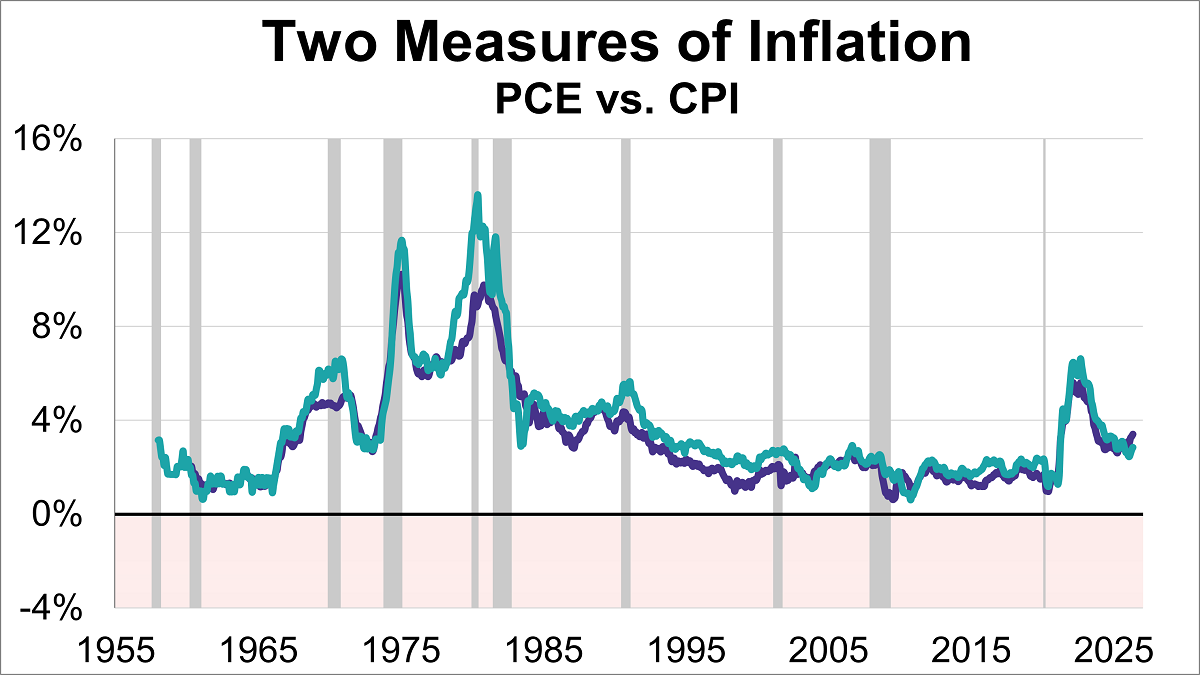
Inflation remains a hot topic, directly impacting everything from your grocery bill to interest rates. As of the latest data, two key inflation gauges — the Personal Consumption Expenditures (PCE) Price Index and the Consumer Price Index (CPI) — show that prices are still above the Federal Reserve's 2% target, with the core PCE at 3.4% and core CPI at 2.9%.
The Big Four Recession Indicators: Real Personal Income
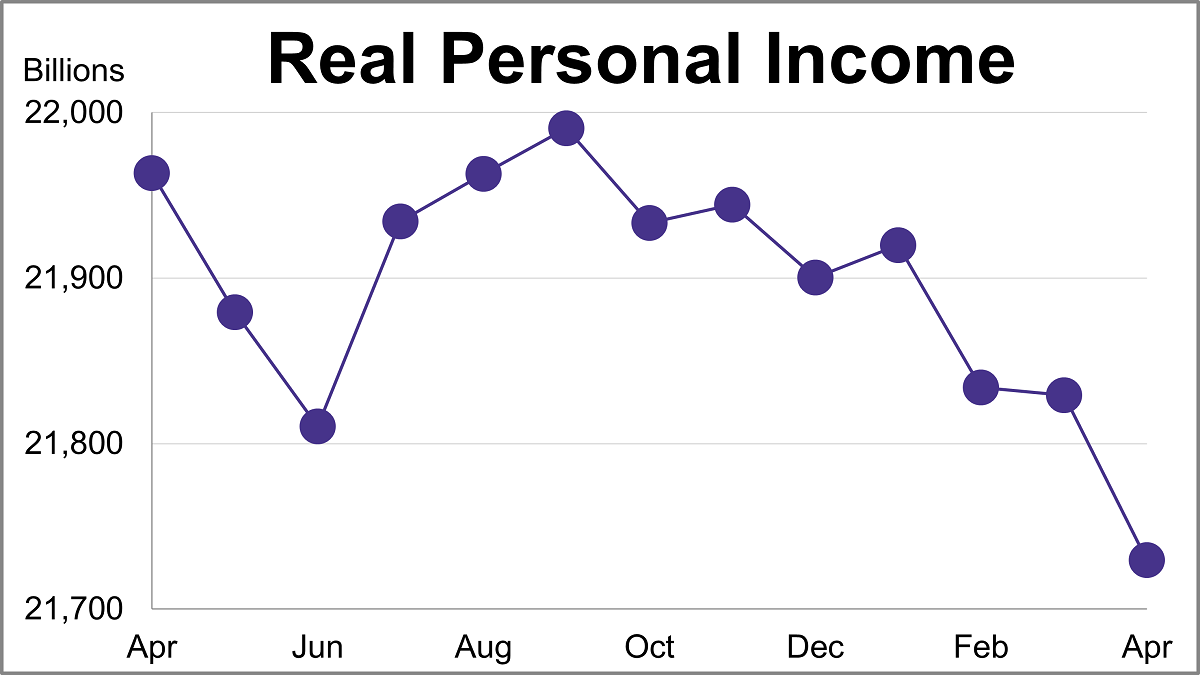
Personal income (excluding transfer receipts) was up 0.70% in May and was up 3.62% year-over-year. However, when adjusted for inflation using the BEA's PCE Price Index, real personal income (excluding transfer receipts) was up 0.25% month-over-month and down 0.43% year-over-year.
Real Disposable Income Per Capita Up 0.2% in May
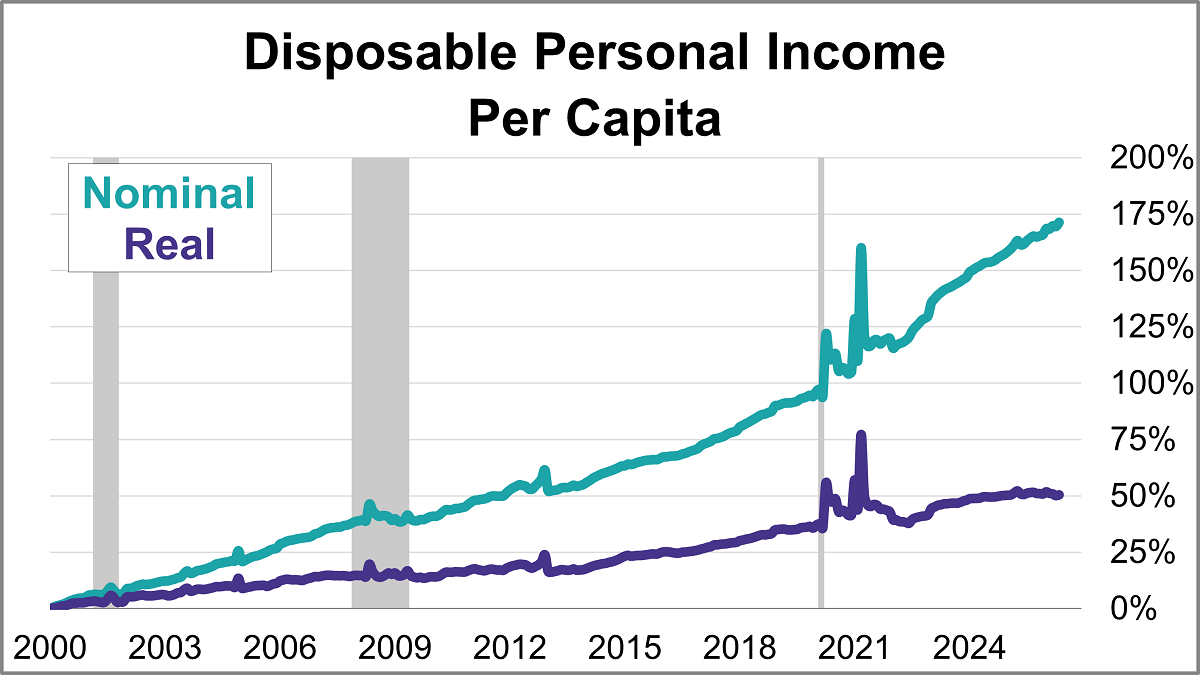
With the release of May's report on personal incomes and outlays, we can now take a closer look at "real" disposable personal income per capita. To two decimal places, disposable income per capita was up up 0.68% month-over-month. But when adjusted for inflation, real disposable income per capita was up 0.23%.
Durable Goods Orders Sink 4.5% in May, Less Than Expected
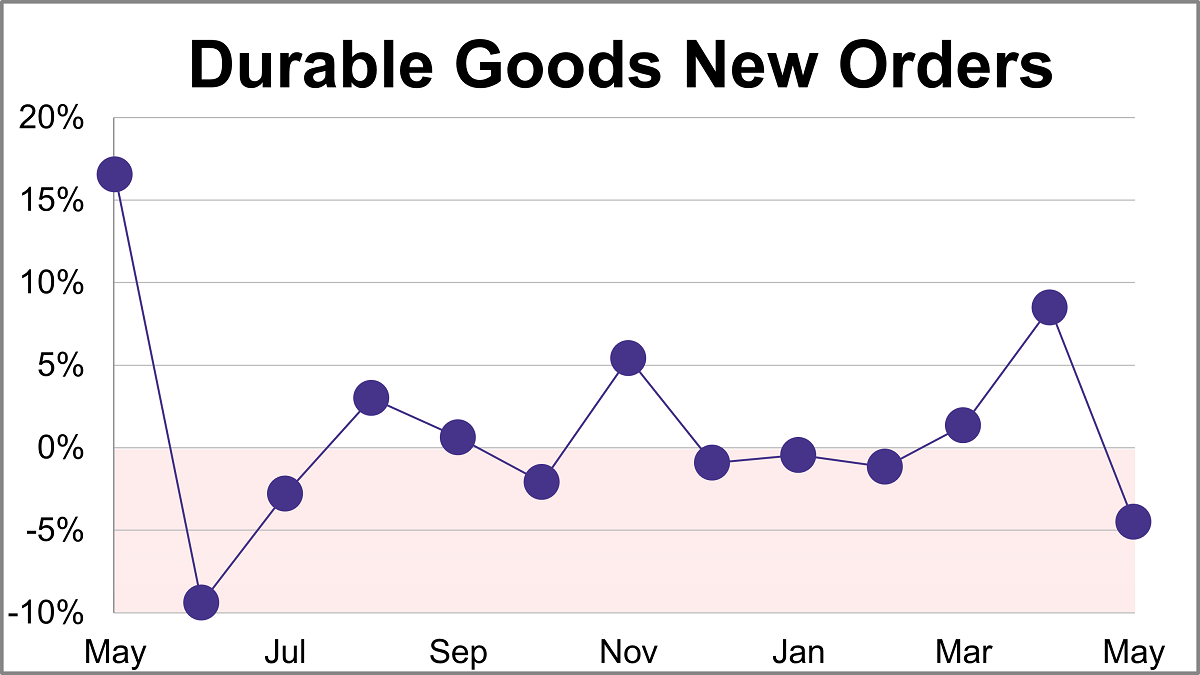
New orders for manufactured durable goods sank 4.5% in May to $332.05B, slightly less than the projected 5.0% monthly decline.
GDP Per Capita: Q1 2026 Third Estimate
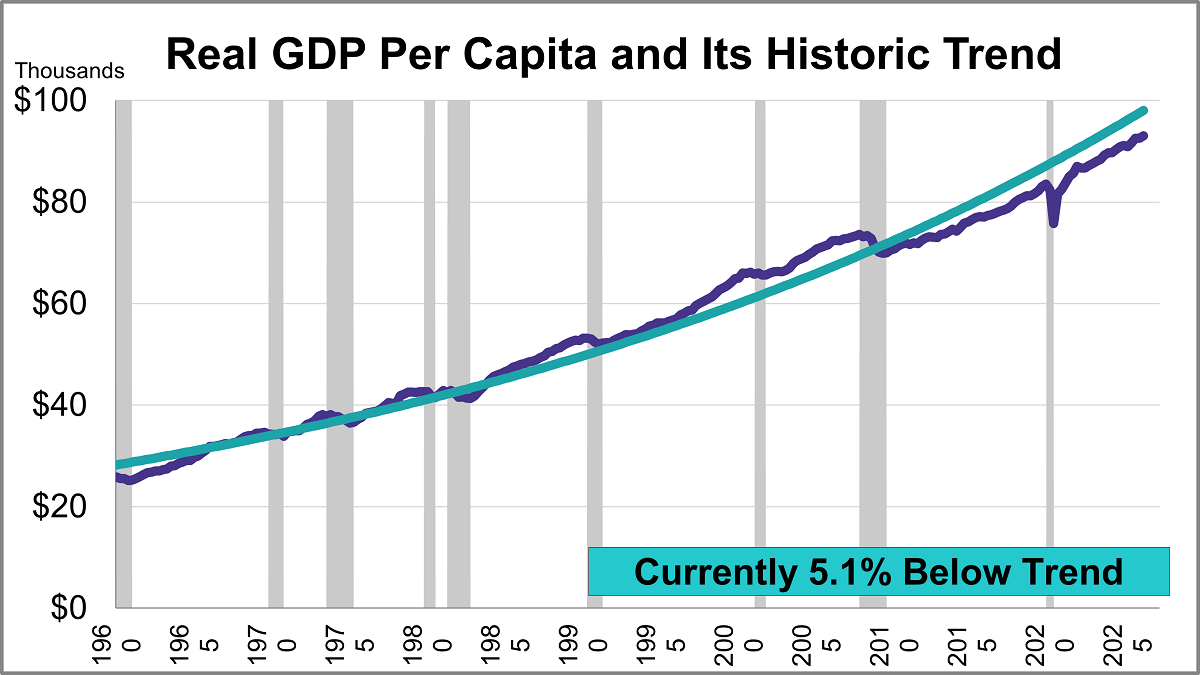
The third estimate for Q1 GDP came in at 2.09%, an acceleration from 0.48% for the Q4 final estimate. With a per-capita adjustment, the headline number is lower at 1.91%, a pickup from 0.18% for the Q4 headline number.
An Inside Look at the Q1 2026 GDP Third Estimate
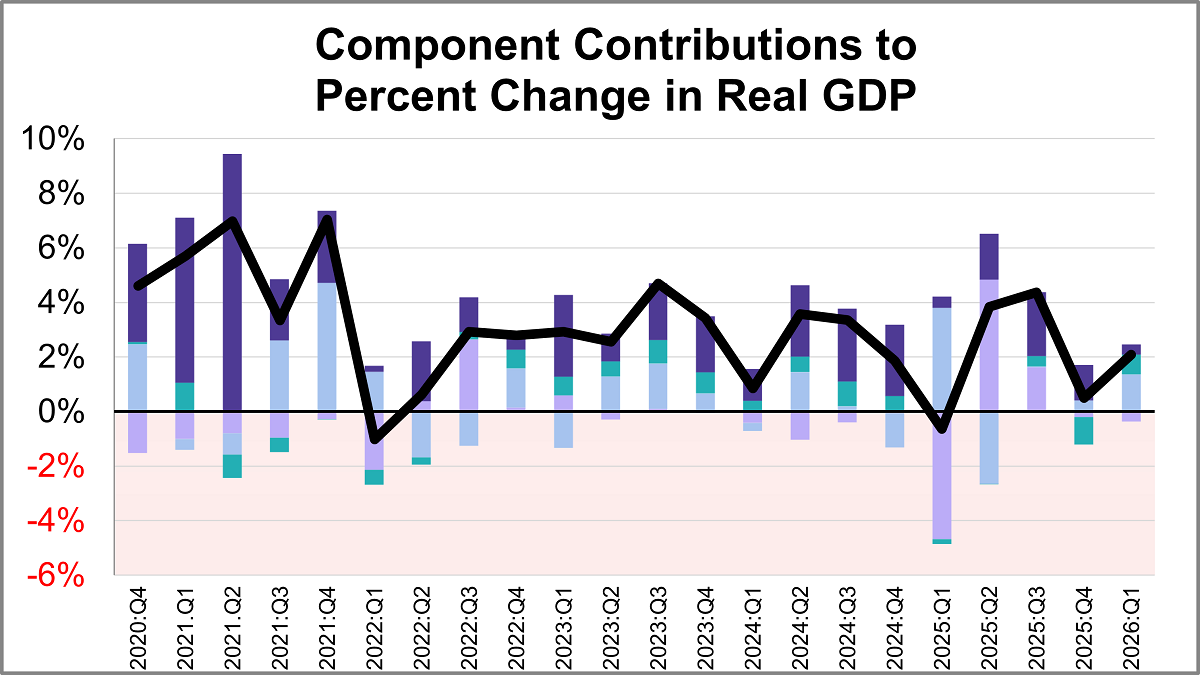
Real gross domestic product (GDP) is comprised of four major subcomponents. In the Q1 2026 GDP third estimate, three of the four components made positive contributions.
Q1 GDP Third Estimate: Real GDP at 2.1%, Higher Than Expected
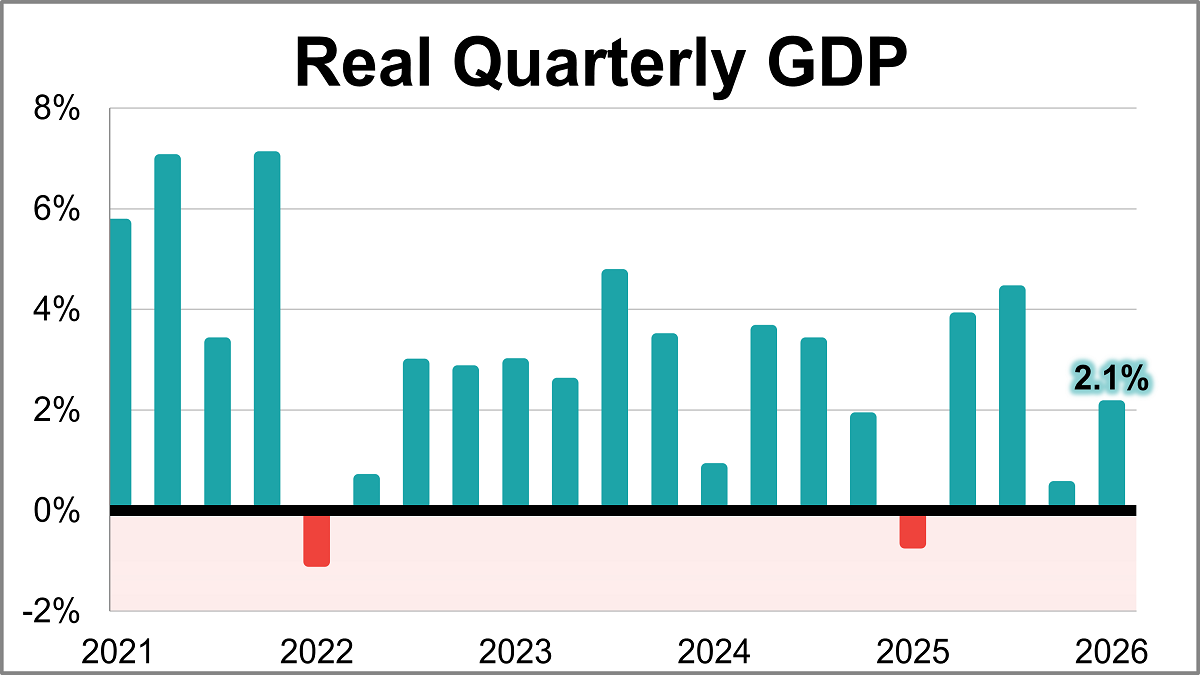
U.S. economic growth rebounded at the beginning of 2026, according to the BEA’s latest estimate. Real GDP rose at a 2.1% annual rate in Q1, exceeding the 1.6% forecast and marking a sharp acceleration from the 0.5% final estimate seen in Q4 of last year.
Richmond Manufacturing Index: Flat Activity in June
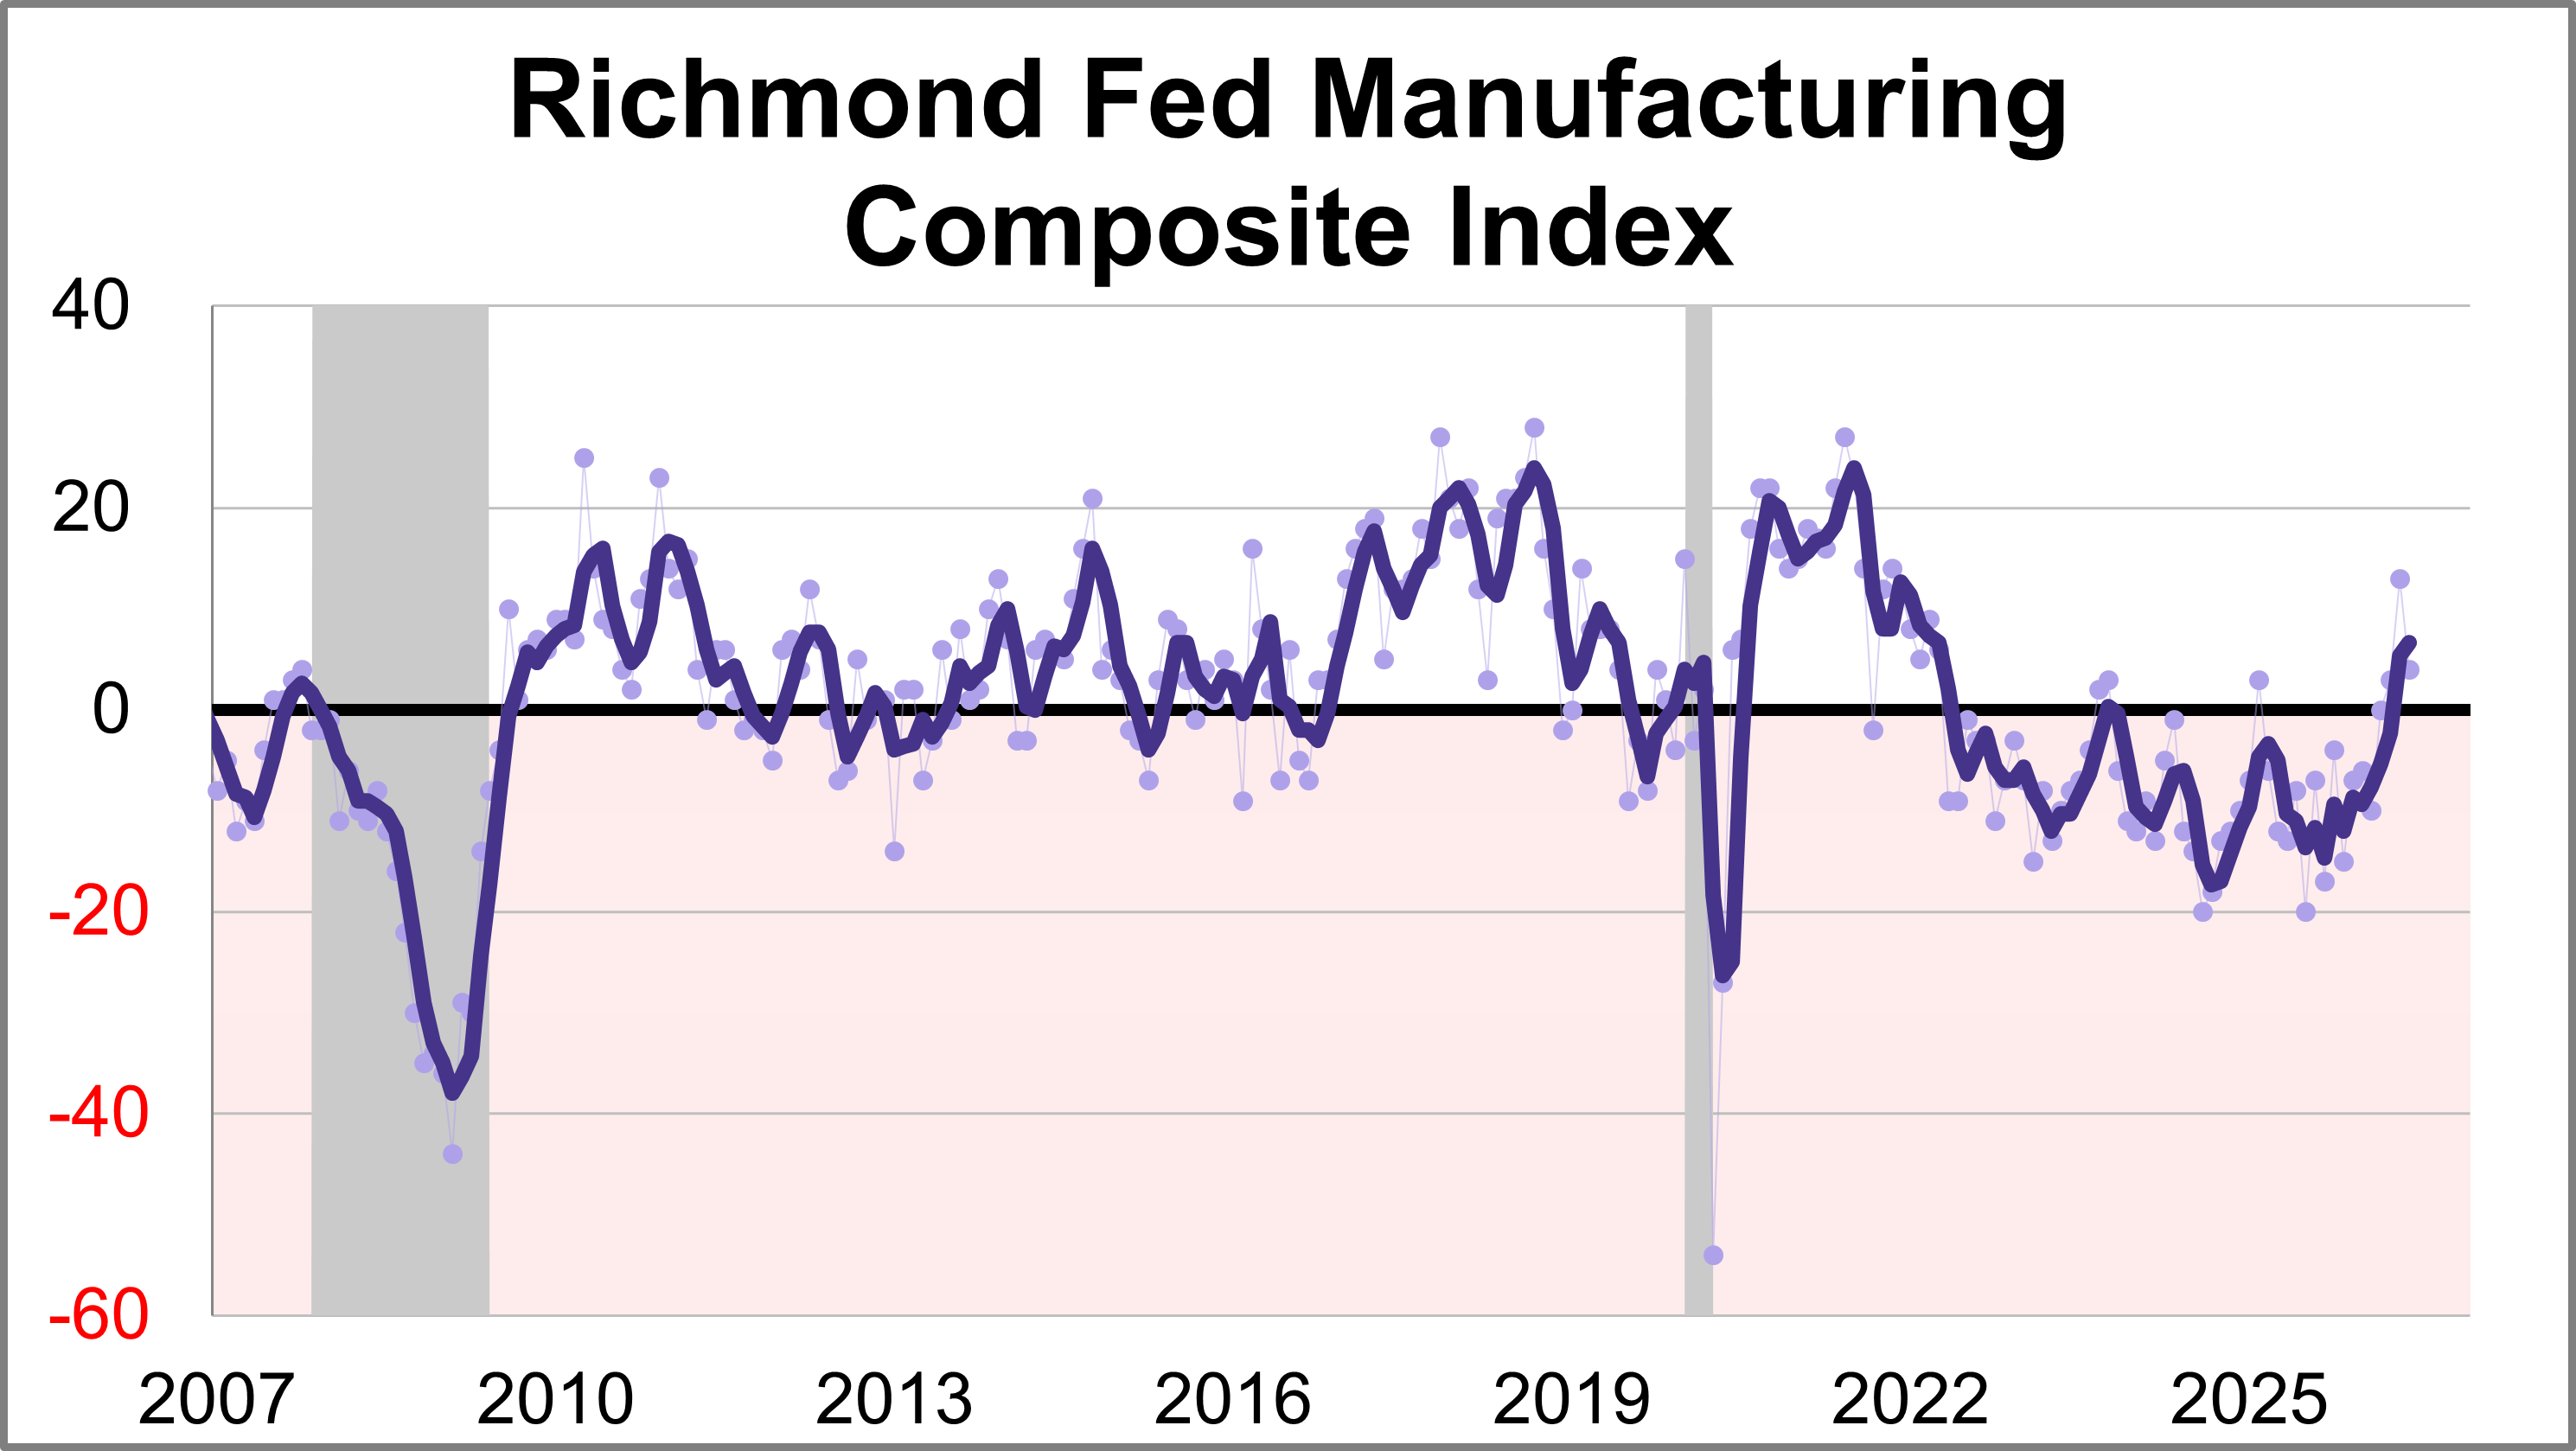
Fifth district manufacturing activity was flat in June, according to the most recent survey from the Federal Reserve Bank of Richmond. The composite manufacturing index fell nine points points to 4, marking the third consecutive positive reading. This month's reading was below the forecast of 8.
Weekly Economic Snapshot: A Hawkish Hold in a High-Stakes Market

As the summer economic landscape takes shape, investors are navigating shifting monetary policy, stubborn inflation pressures, and unexpected market momentum. This week’s snapshot breaks down the most critical updates and data releases from the past week to give you a clear view of where the economy is heading.
MassMutual on Strategies for Maximizing Retirement Income

In an effort to streamline retirement income planning, MassMutual Strategic Distributors has launched a behavioral framework.
Fed’s Interest Rate Decision: June 17, 2026
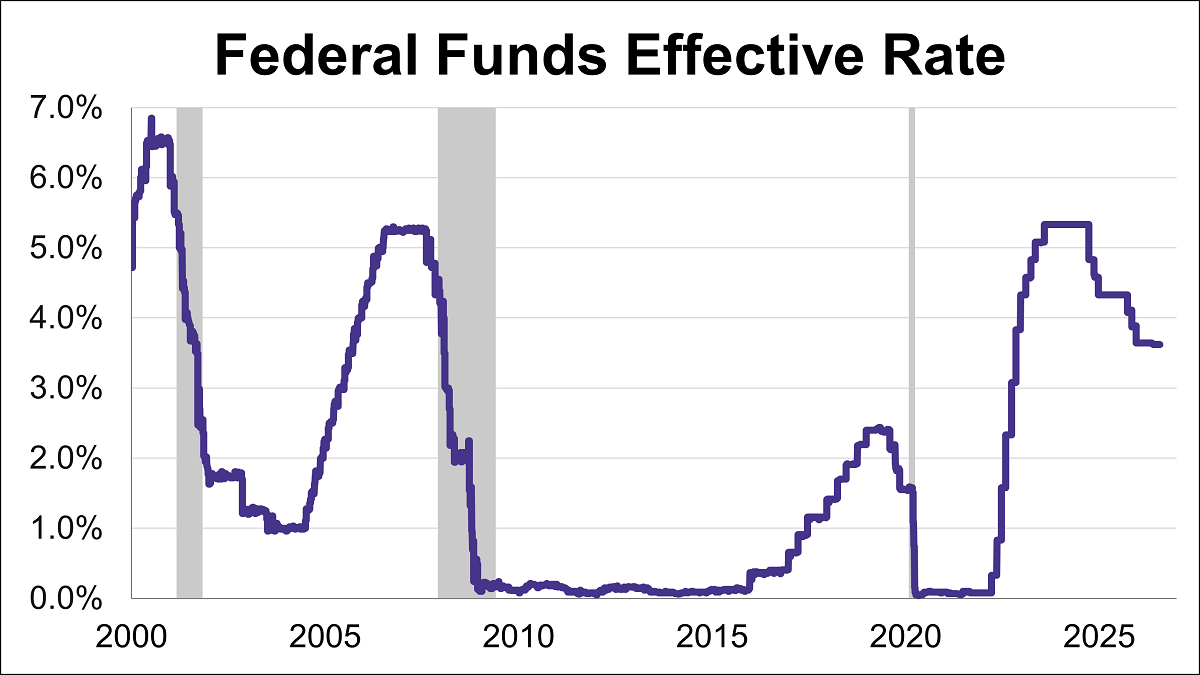
The Federal Reserve concluded its fourth meeting of the year by holding the federal funds rate (FFR) steady in the 3.50%-3.75% range.
Navigating the Impending Advisor Retirement Wave

A massive advisor retirement wave is reshaping wealth management. Discover how $2.5 trillion in assets may fuel industry transformation.
Weekly Economic Snapshot: Inflation Spikes While Consumer Sentiment Breaks Its Decline

The U.S. economy faced intensifying headwinds in May as both consumer and wholesale inflation metrics surged to multi-year highs.
The Inflation Impact: 3 ETF Approaches for Managing Risk

With the latest CPI report showing that inflation is likely here to stay, it could be time to pivot towards ETFs with downside protection.
Top May Articles on Advisor Perspectives Target Retirement, Scams & More

Several articles enjoyed strong performance during the month of May, though there does not seem to have been a unifying theme, unless it is pointing out mistaken beliefs or unexamined conventions.
Weekly Economic Snapshot: Strong Labor Data Across the Board

The U.S. labor market took center stage last week as three major labor market indicators outperformed forecasts. Robust payroll additions in both the public and private sectors, paired with a massive surge in job openings, point to a workforce on solid footing.
S&P 500 Momentum Continued Its Dominant Run in May

Ride the momentum wave. Discover how tech-fueled factors propelled momentum and high-beta ETFs to historic, benchmark-crushing gains.
The Total Return Roller Coaster: May 2026
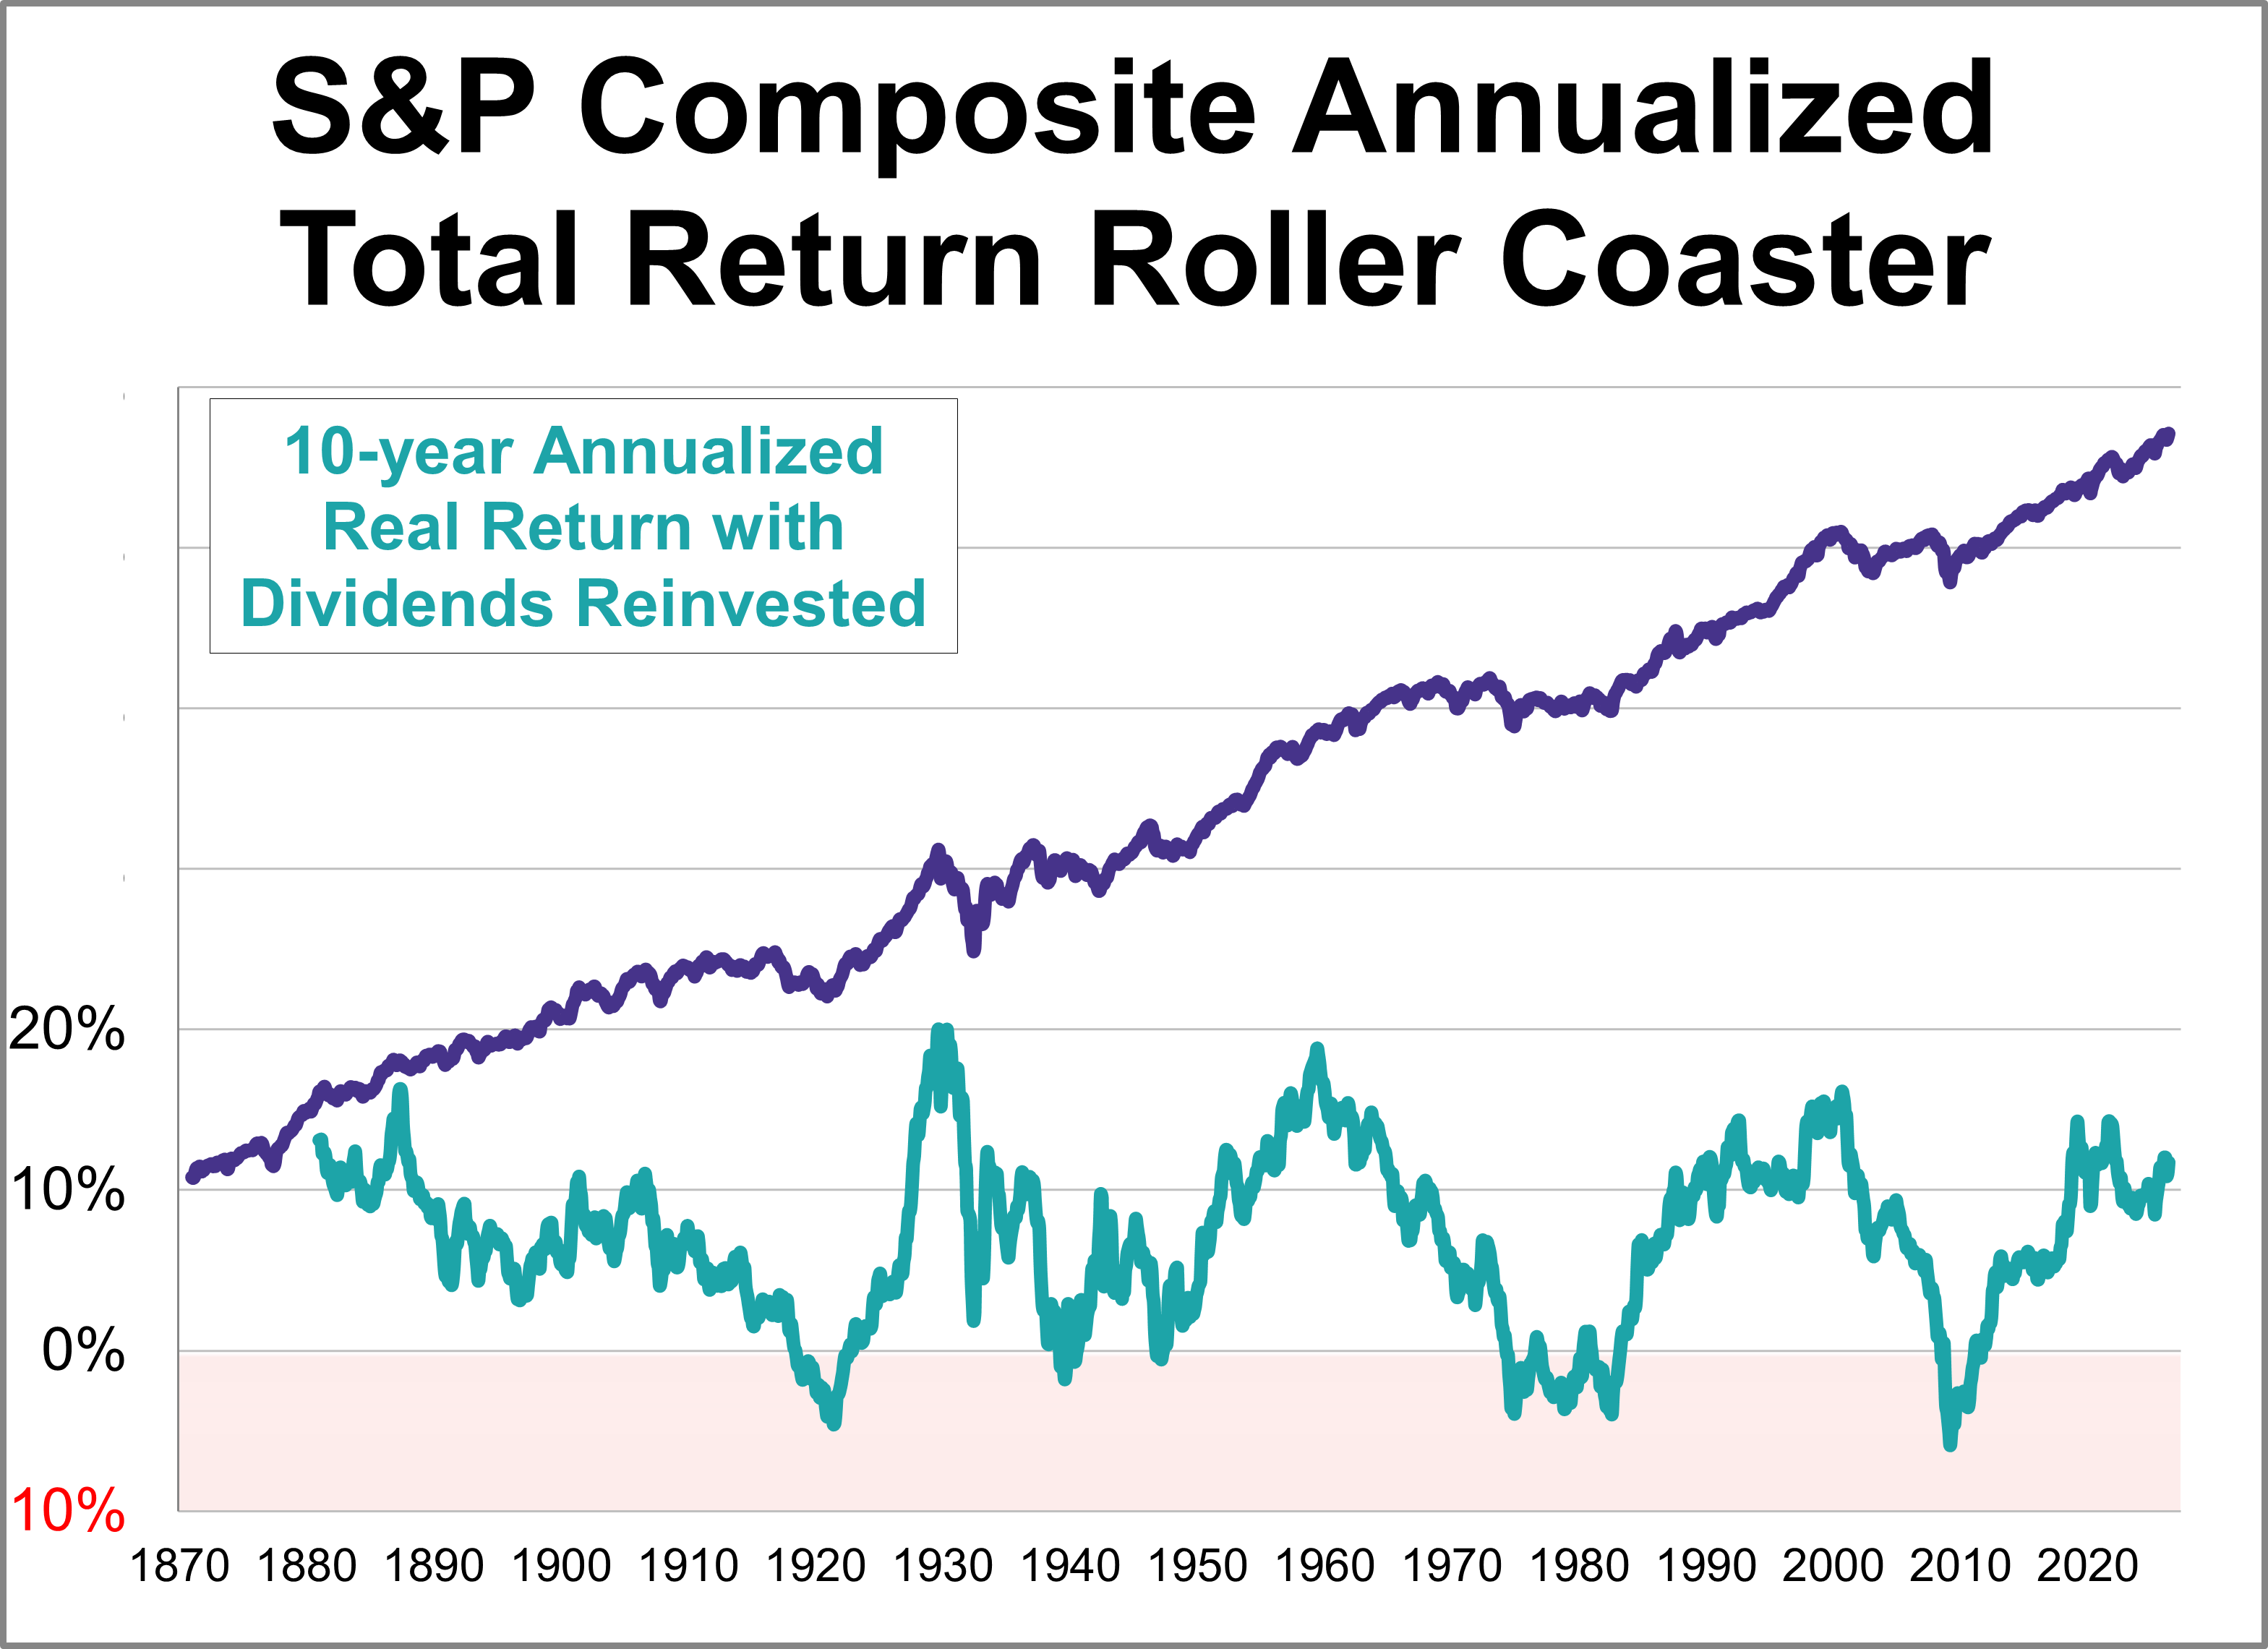
Here's an interesting set of charts that will especially resonate with those of us who follow economic and market cycles. Imagine that five years ago you invested $10,000 in the S&P 500. How much would it be worth today, with dividends reinvested but adjusted for inflation?
3 Reasons To Invest In Closed-End Funds This Summer

Closed-end funds may not be a hot topic right now, but they offer a highly compelling means to solve today's macroeconomic woes.
Weekly Economic Snapshot: Inflation Up, Confidence Down

Last week’s data tracked a shifting economic trajectory over the last several months. While the latest reading on first-quarter GDP confirms the economy started the year with steady growth, subsequent inflation metrics moved higher and ultimately weighed on consumer confidence.
Richmond Manufacturing Index Reaches Near 5-Year High
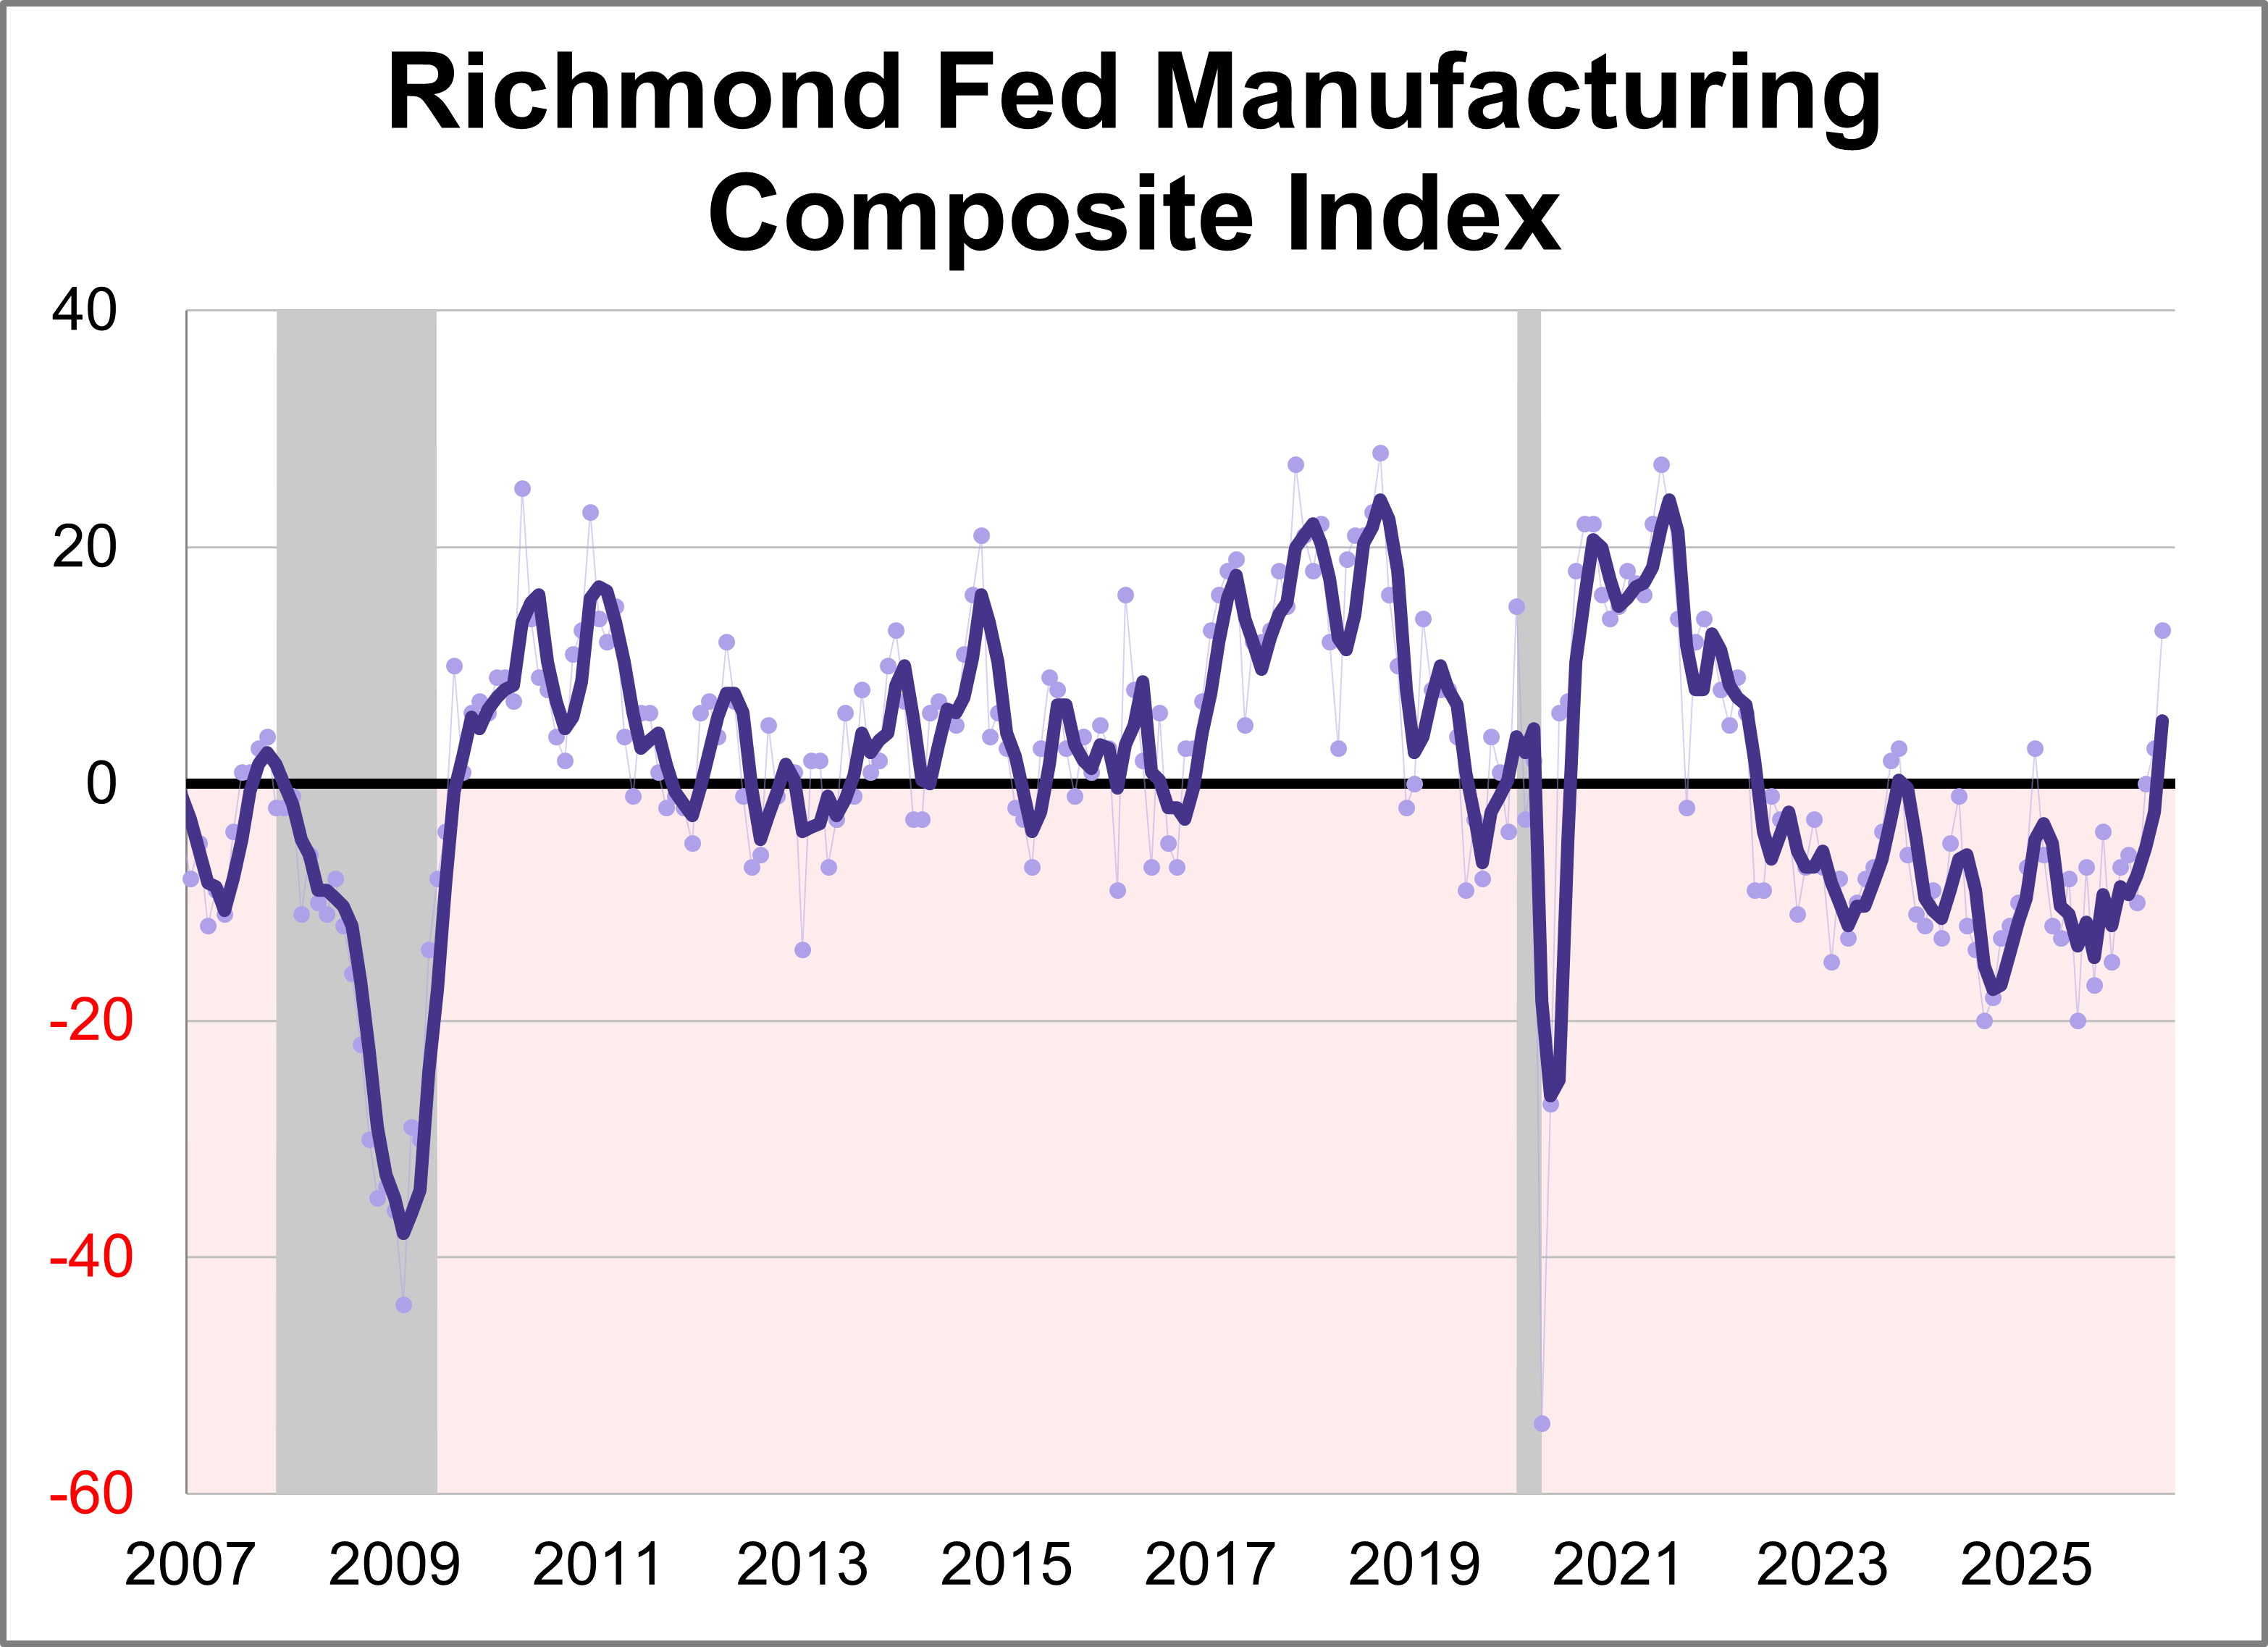
Fifth district manufacturing activity increased in May according to the most recent survey from the Federal Reserve Bank of Richmond. The composite manufacturing index rose ten points points to 13, marking the highest level in nearly five years. This month's reading was above the forecast of 4.
Dallas Fed Manufacturing: Slower Growth in May
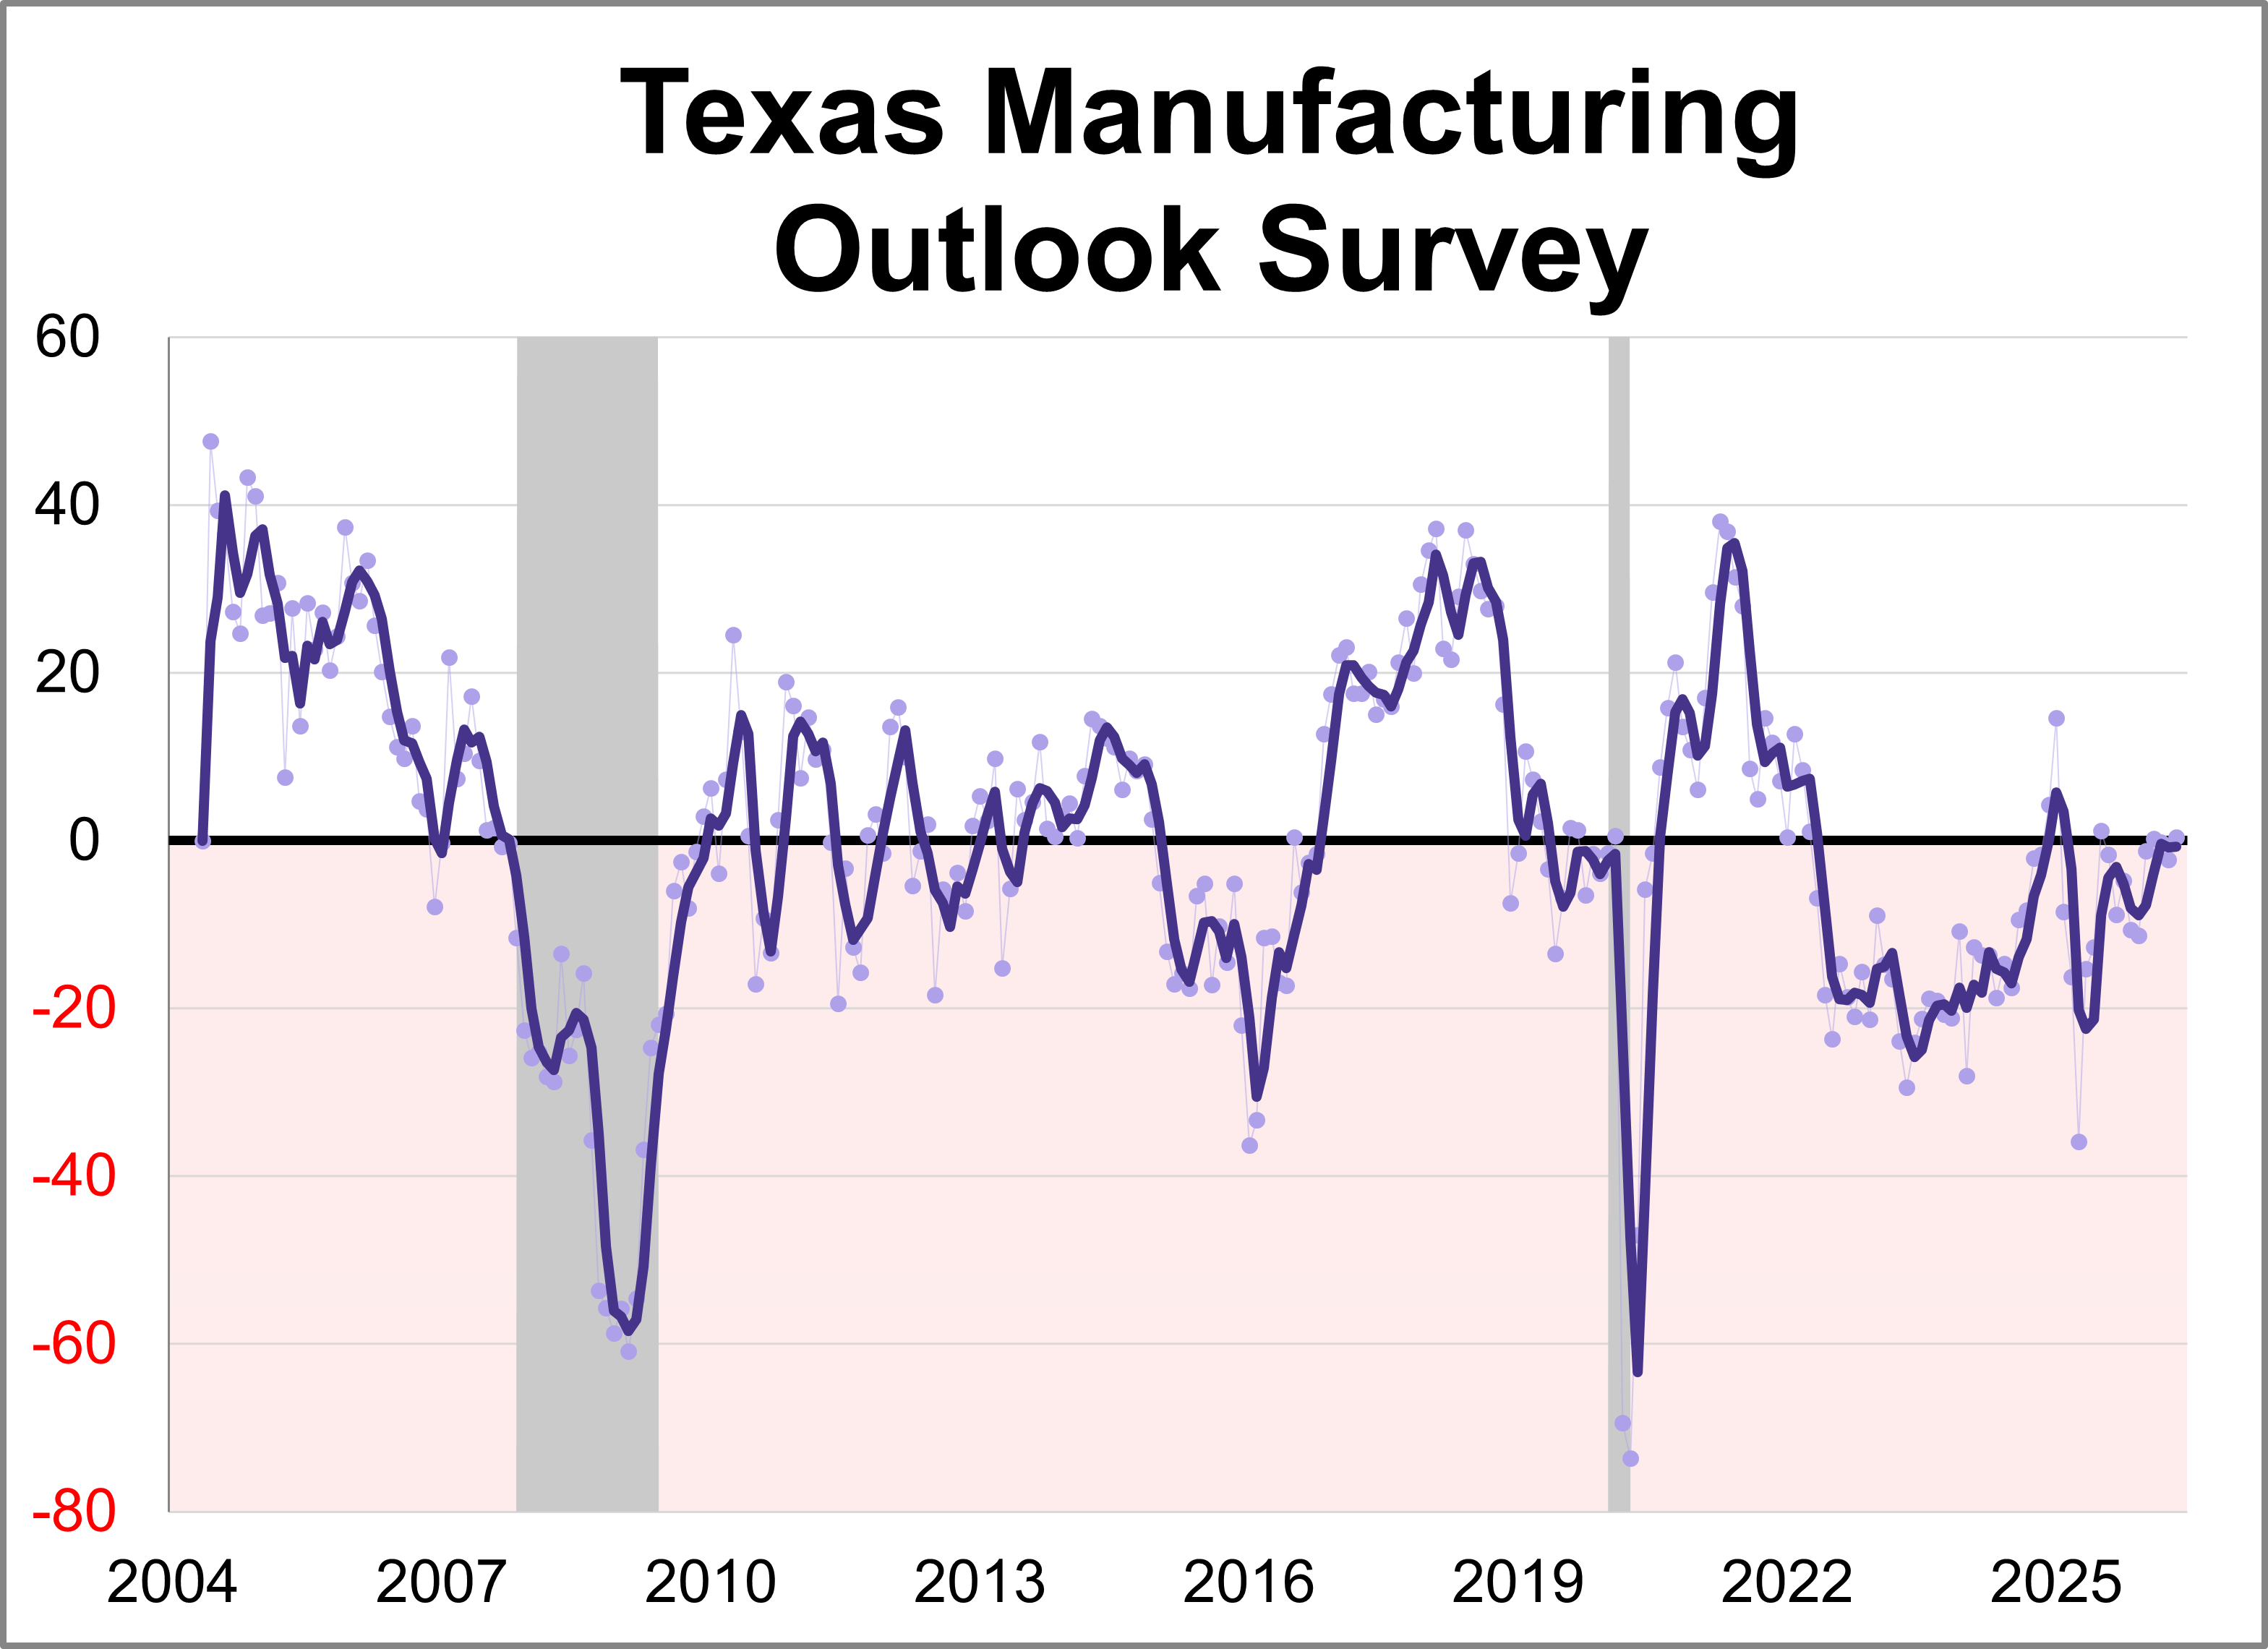
The Dallas Fed released its Texas Manufacturing Outlook Survey (TMOS) for May. The general business activity index rose 2.7 points to 0.4, indicating slower growth of manufacturing activity and stable business conditions perceptions.
Weekly Economic Snapshot: High Leverage, Low Sentiment

There is currently a stark contrast between everyday consumer confidence and financial market behavior. On one hand, persistent inflation and elevated living costs have driven consumer sentiment to historic lows. On the other hand, financial market participants are exhibiting aggressive risk appetite, with margin debt surging to an all-time high record on the heels of major equity market gains.
Kansas City Fed Manufacturing Index: Activity Continued to Increase in May
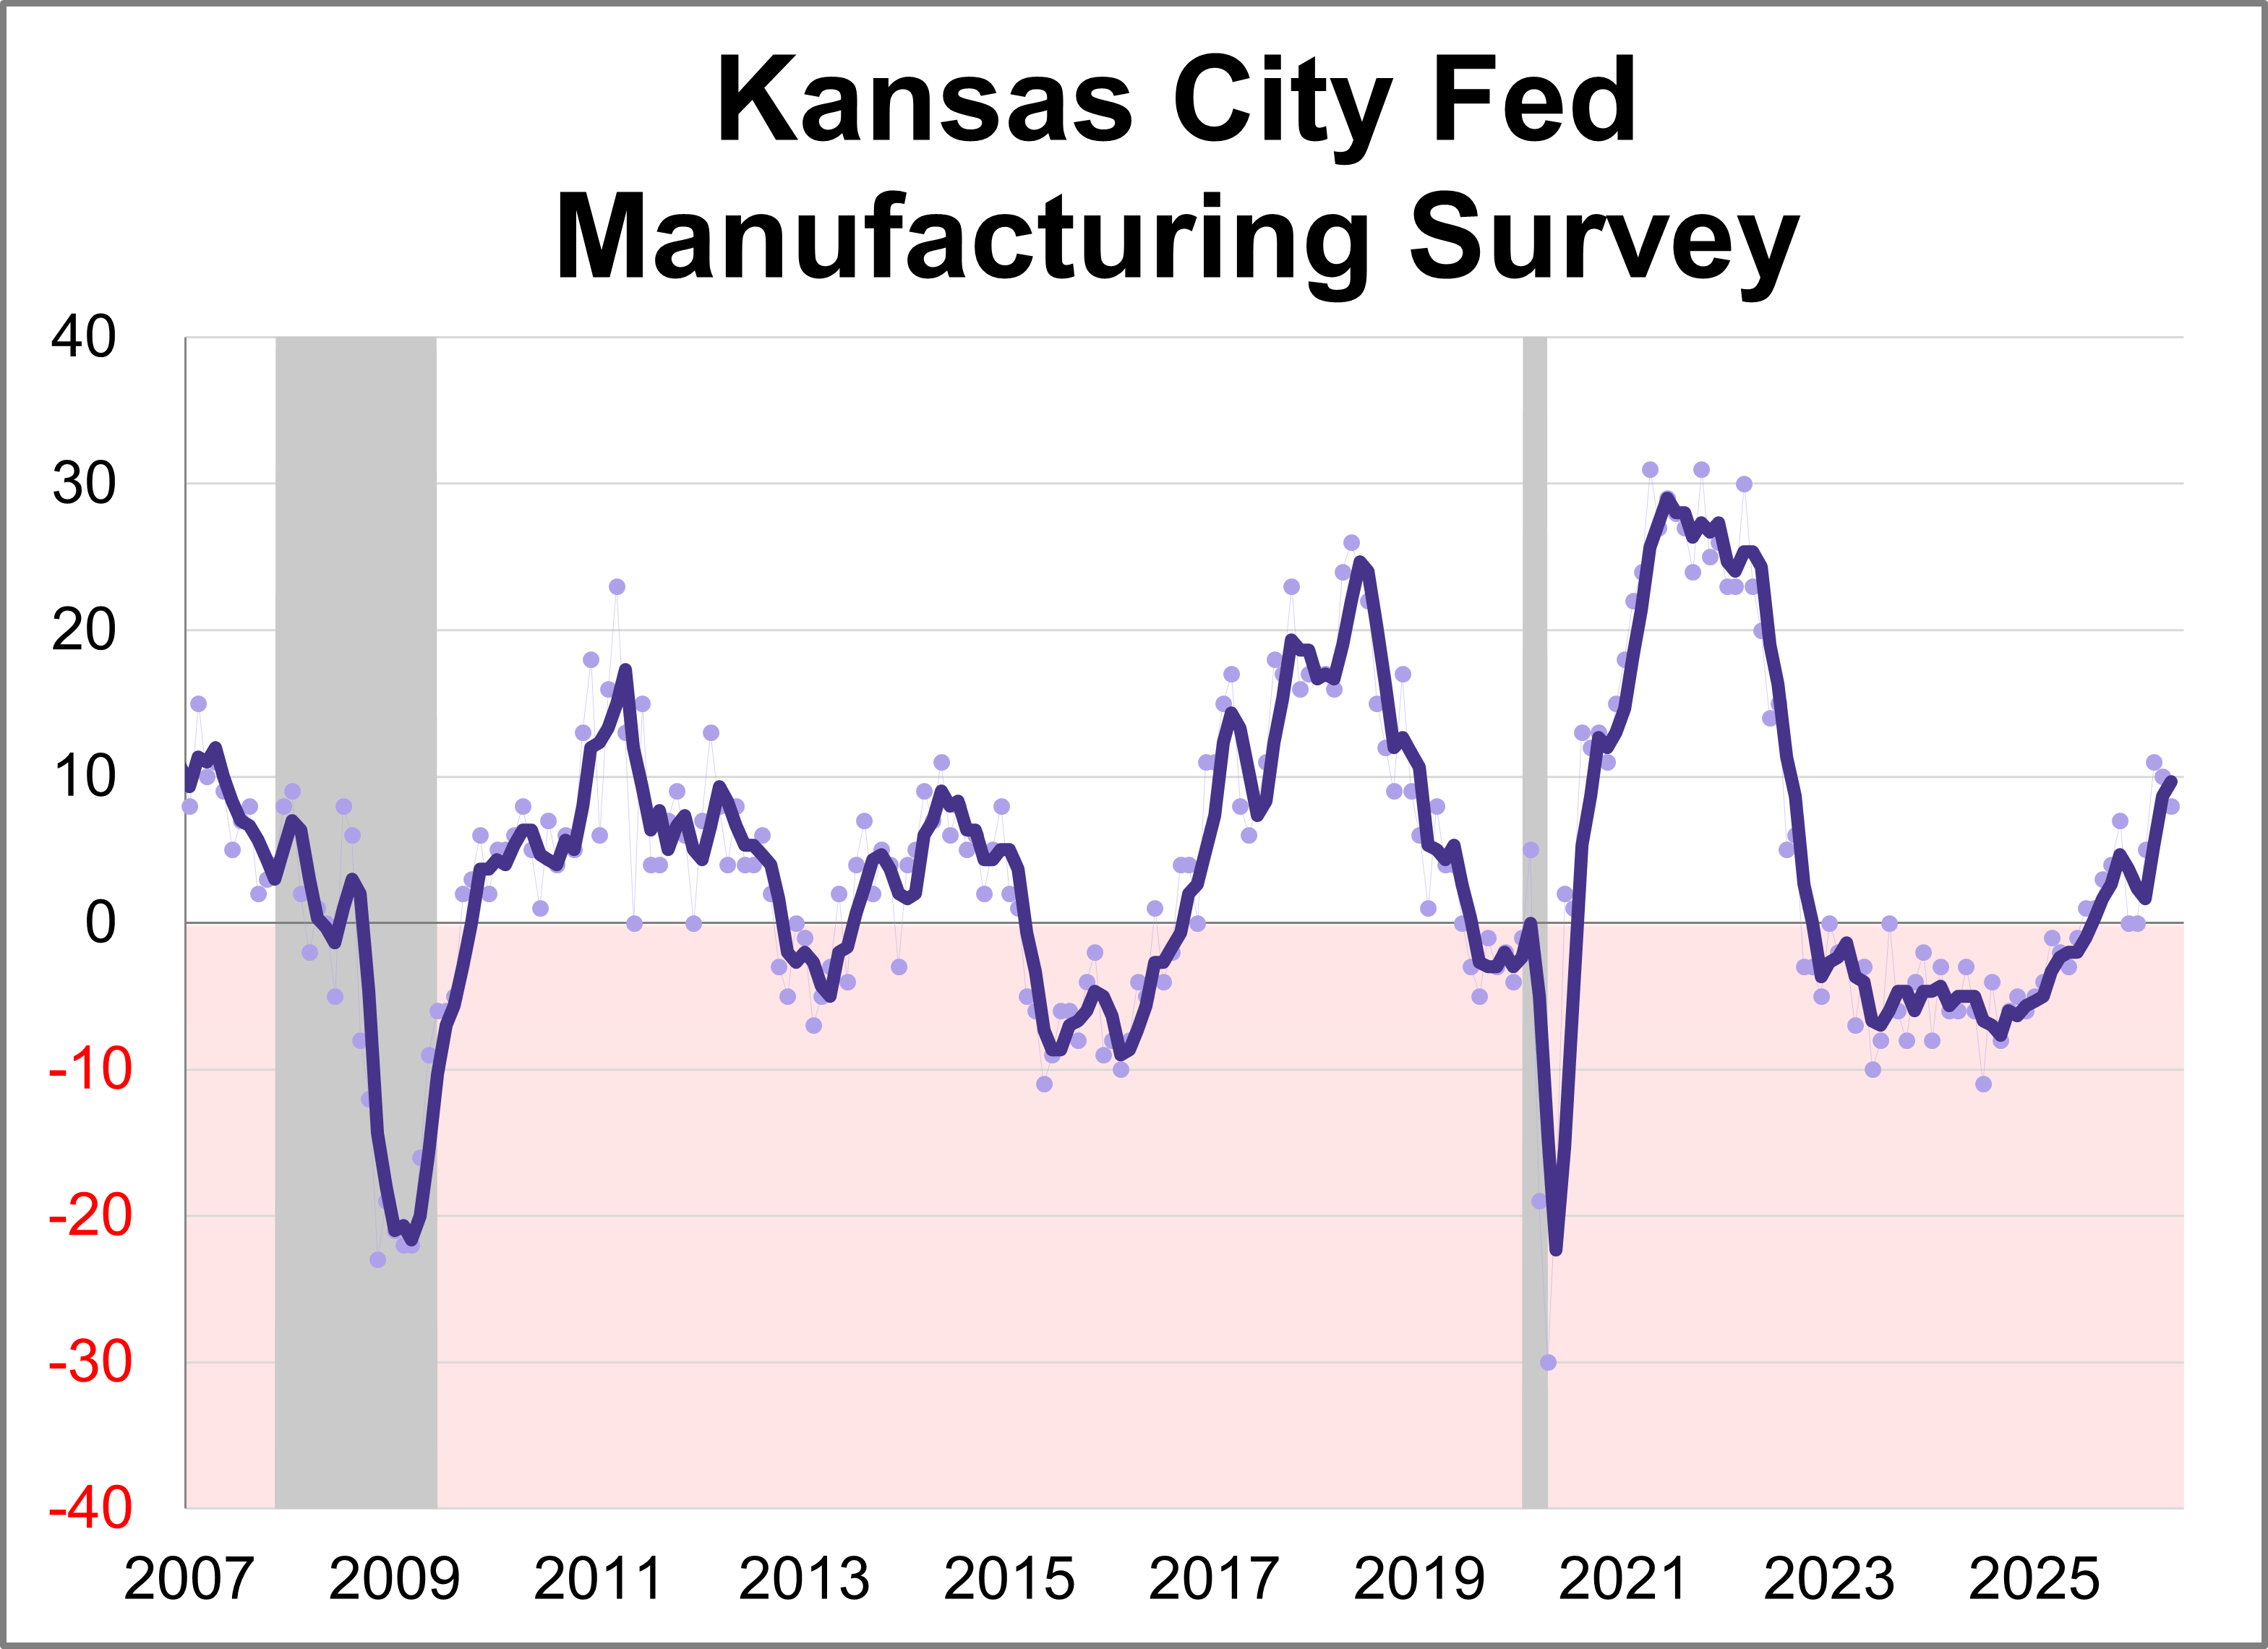
The Kansas City Fed Manufacturing Survey revealed regional activity continued to increase in May. The composite index came in at 8 this month, down slightly from 10 in April but still indicating continued expansion.
Philadelphia Fed Manufacturing Index: Lowest Level of 2026
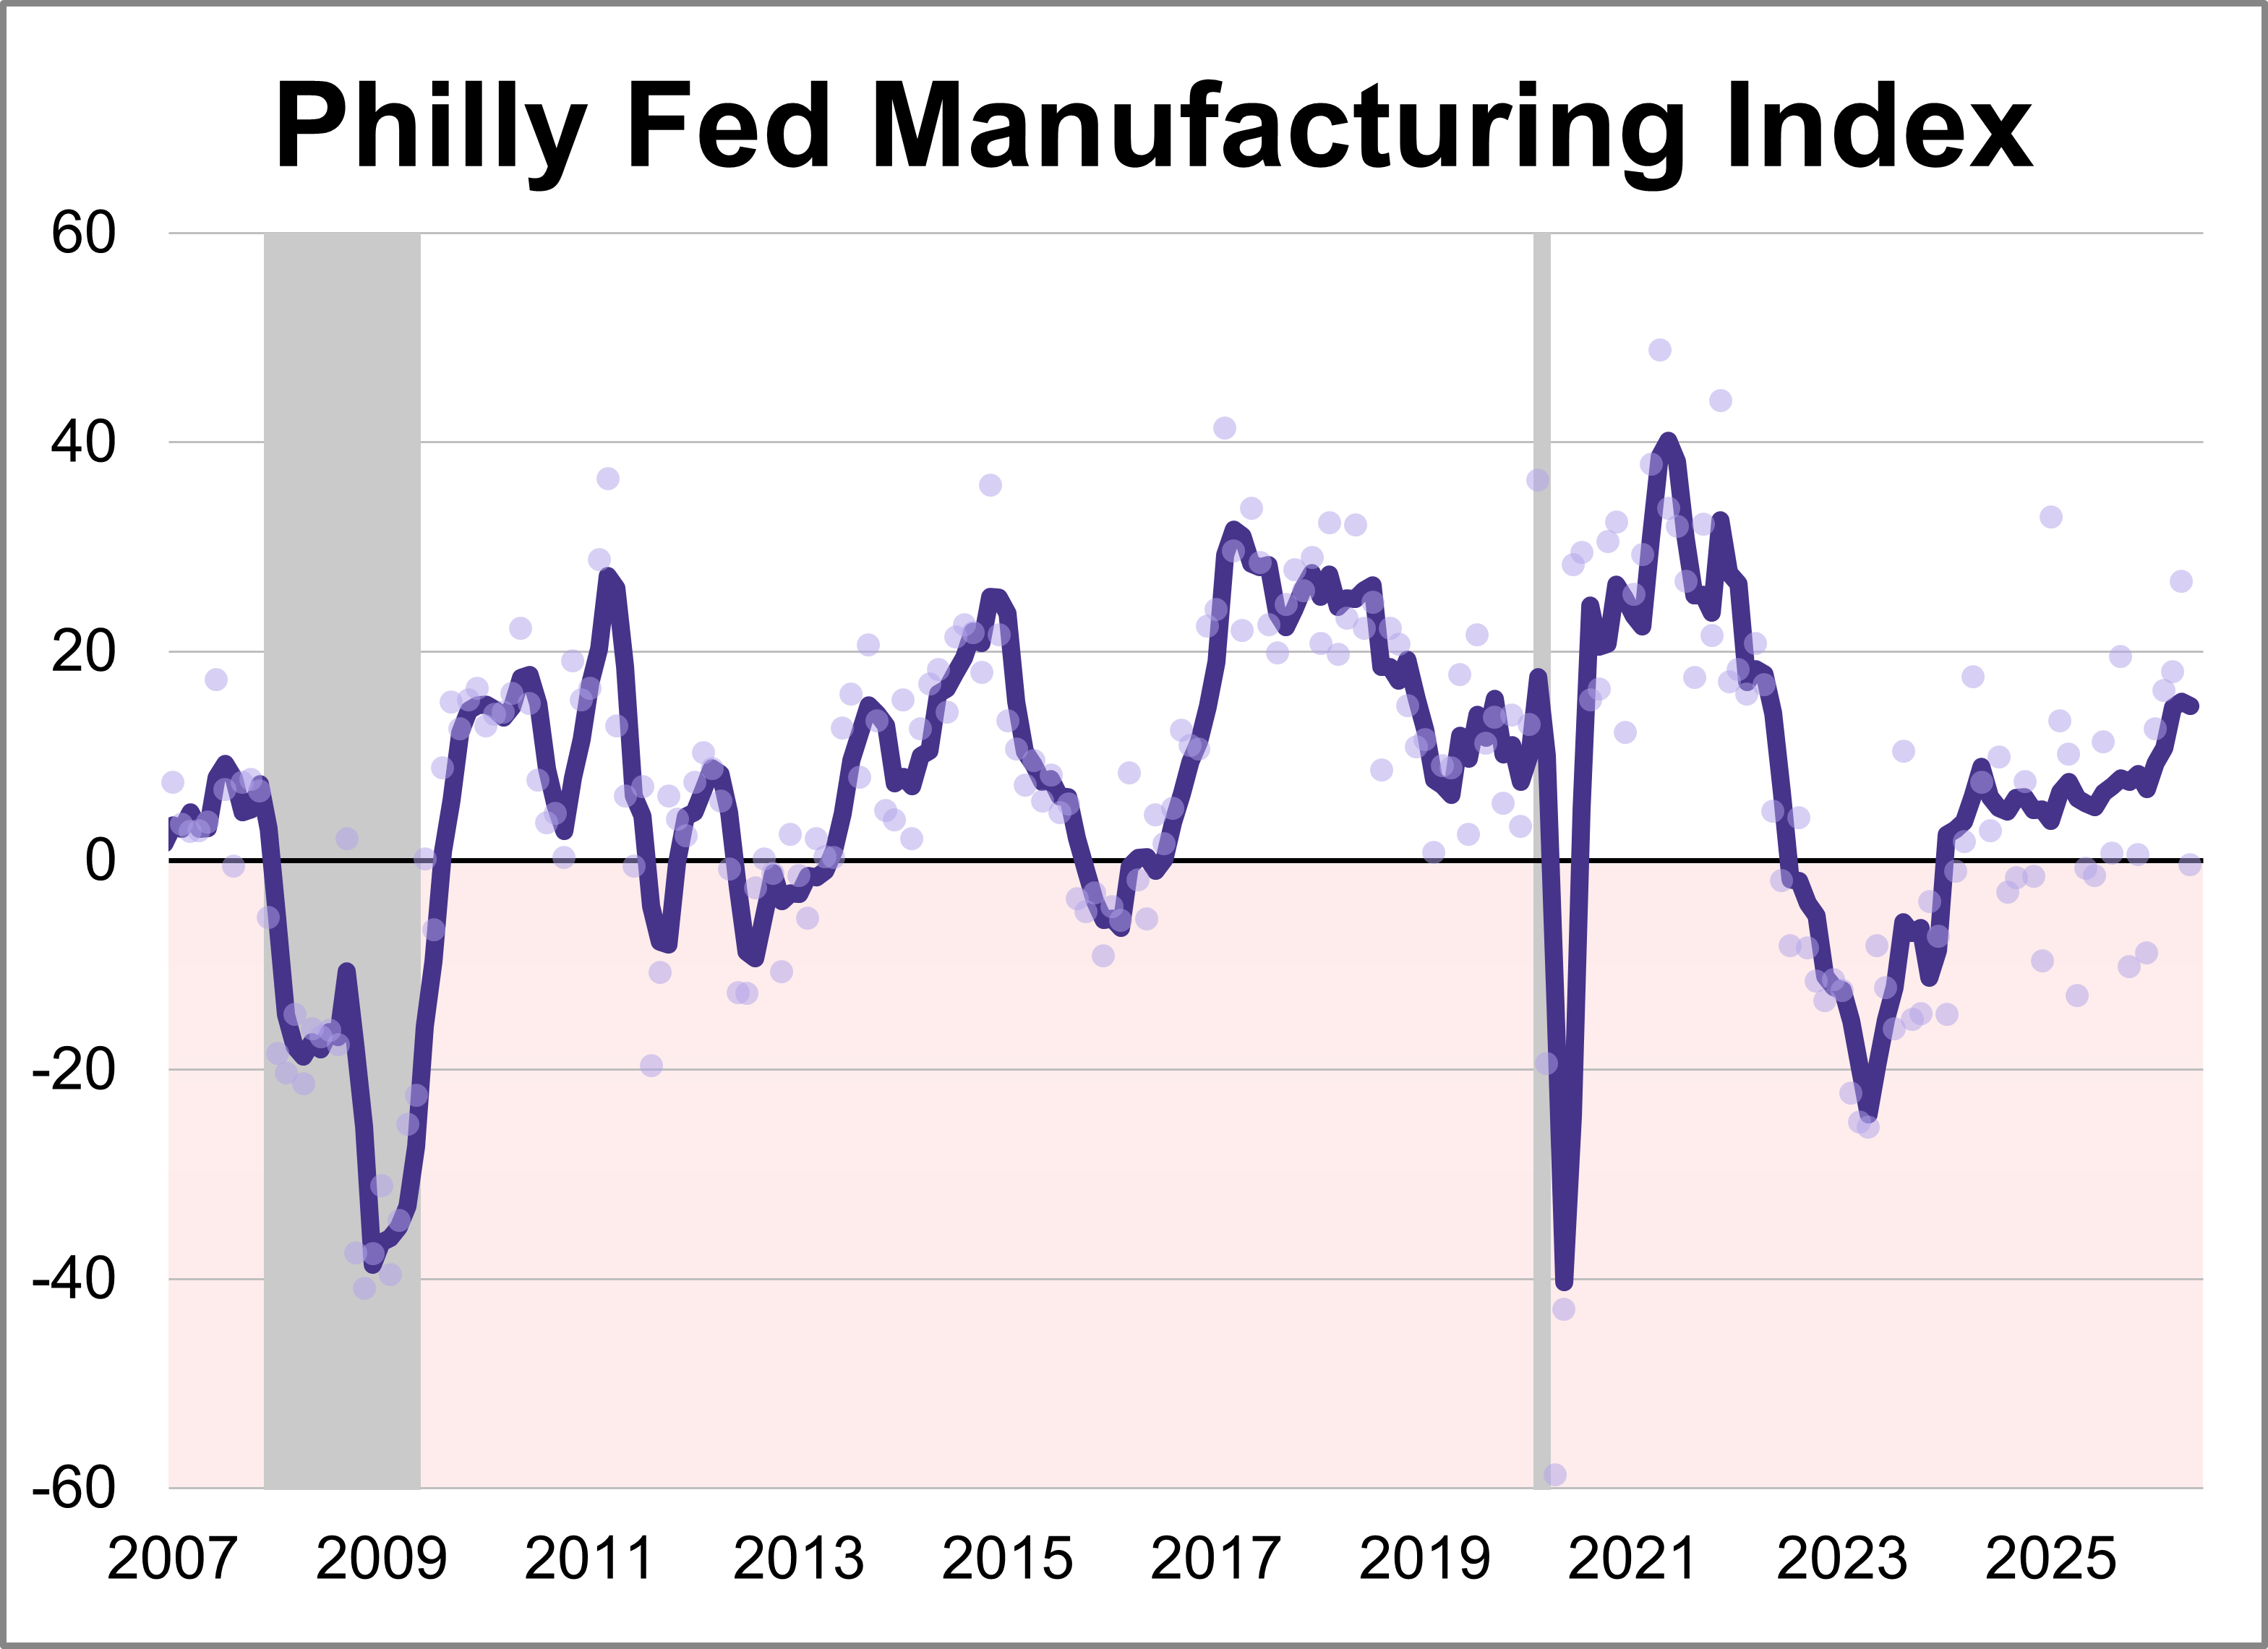
The latest Philadelphia Fed manufacturing index showed activity weakened in May, with the index sinking 27.1 points to -0.4. The latest reading marked the lowest level for the index this year and was worse than the forecast of 17.6.
Why the 60/40 Portfolio Needs a New Playbook
As inflation lingers and market dynamics shift, advisors are rethinking the 60/40 portfolio with managed futures and options income ETFs.
Gas Prices Cross the $4 Mark in Nearly Every State
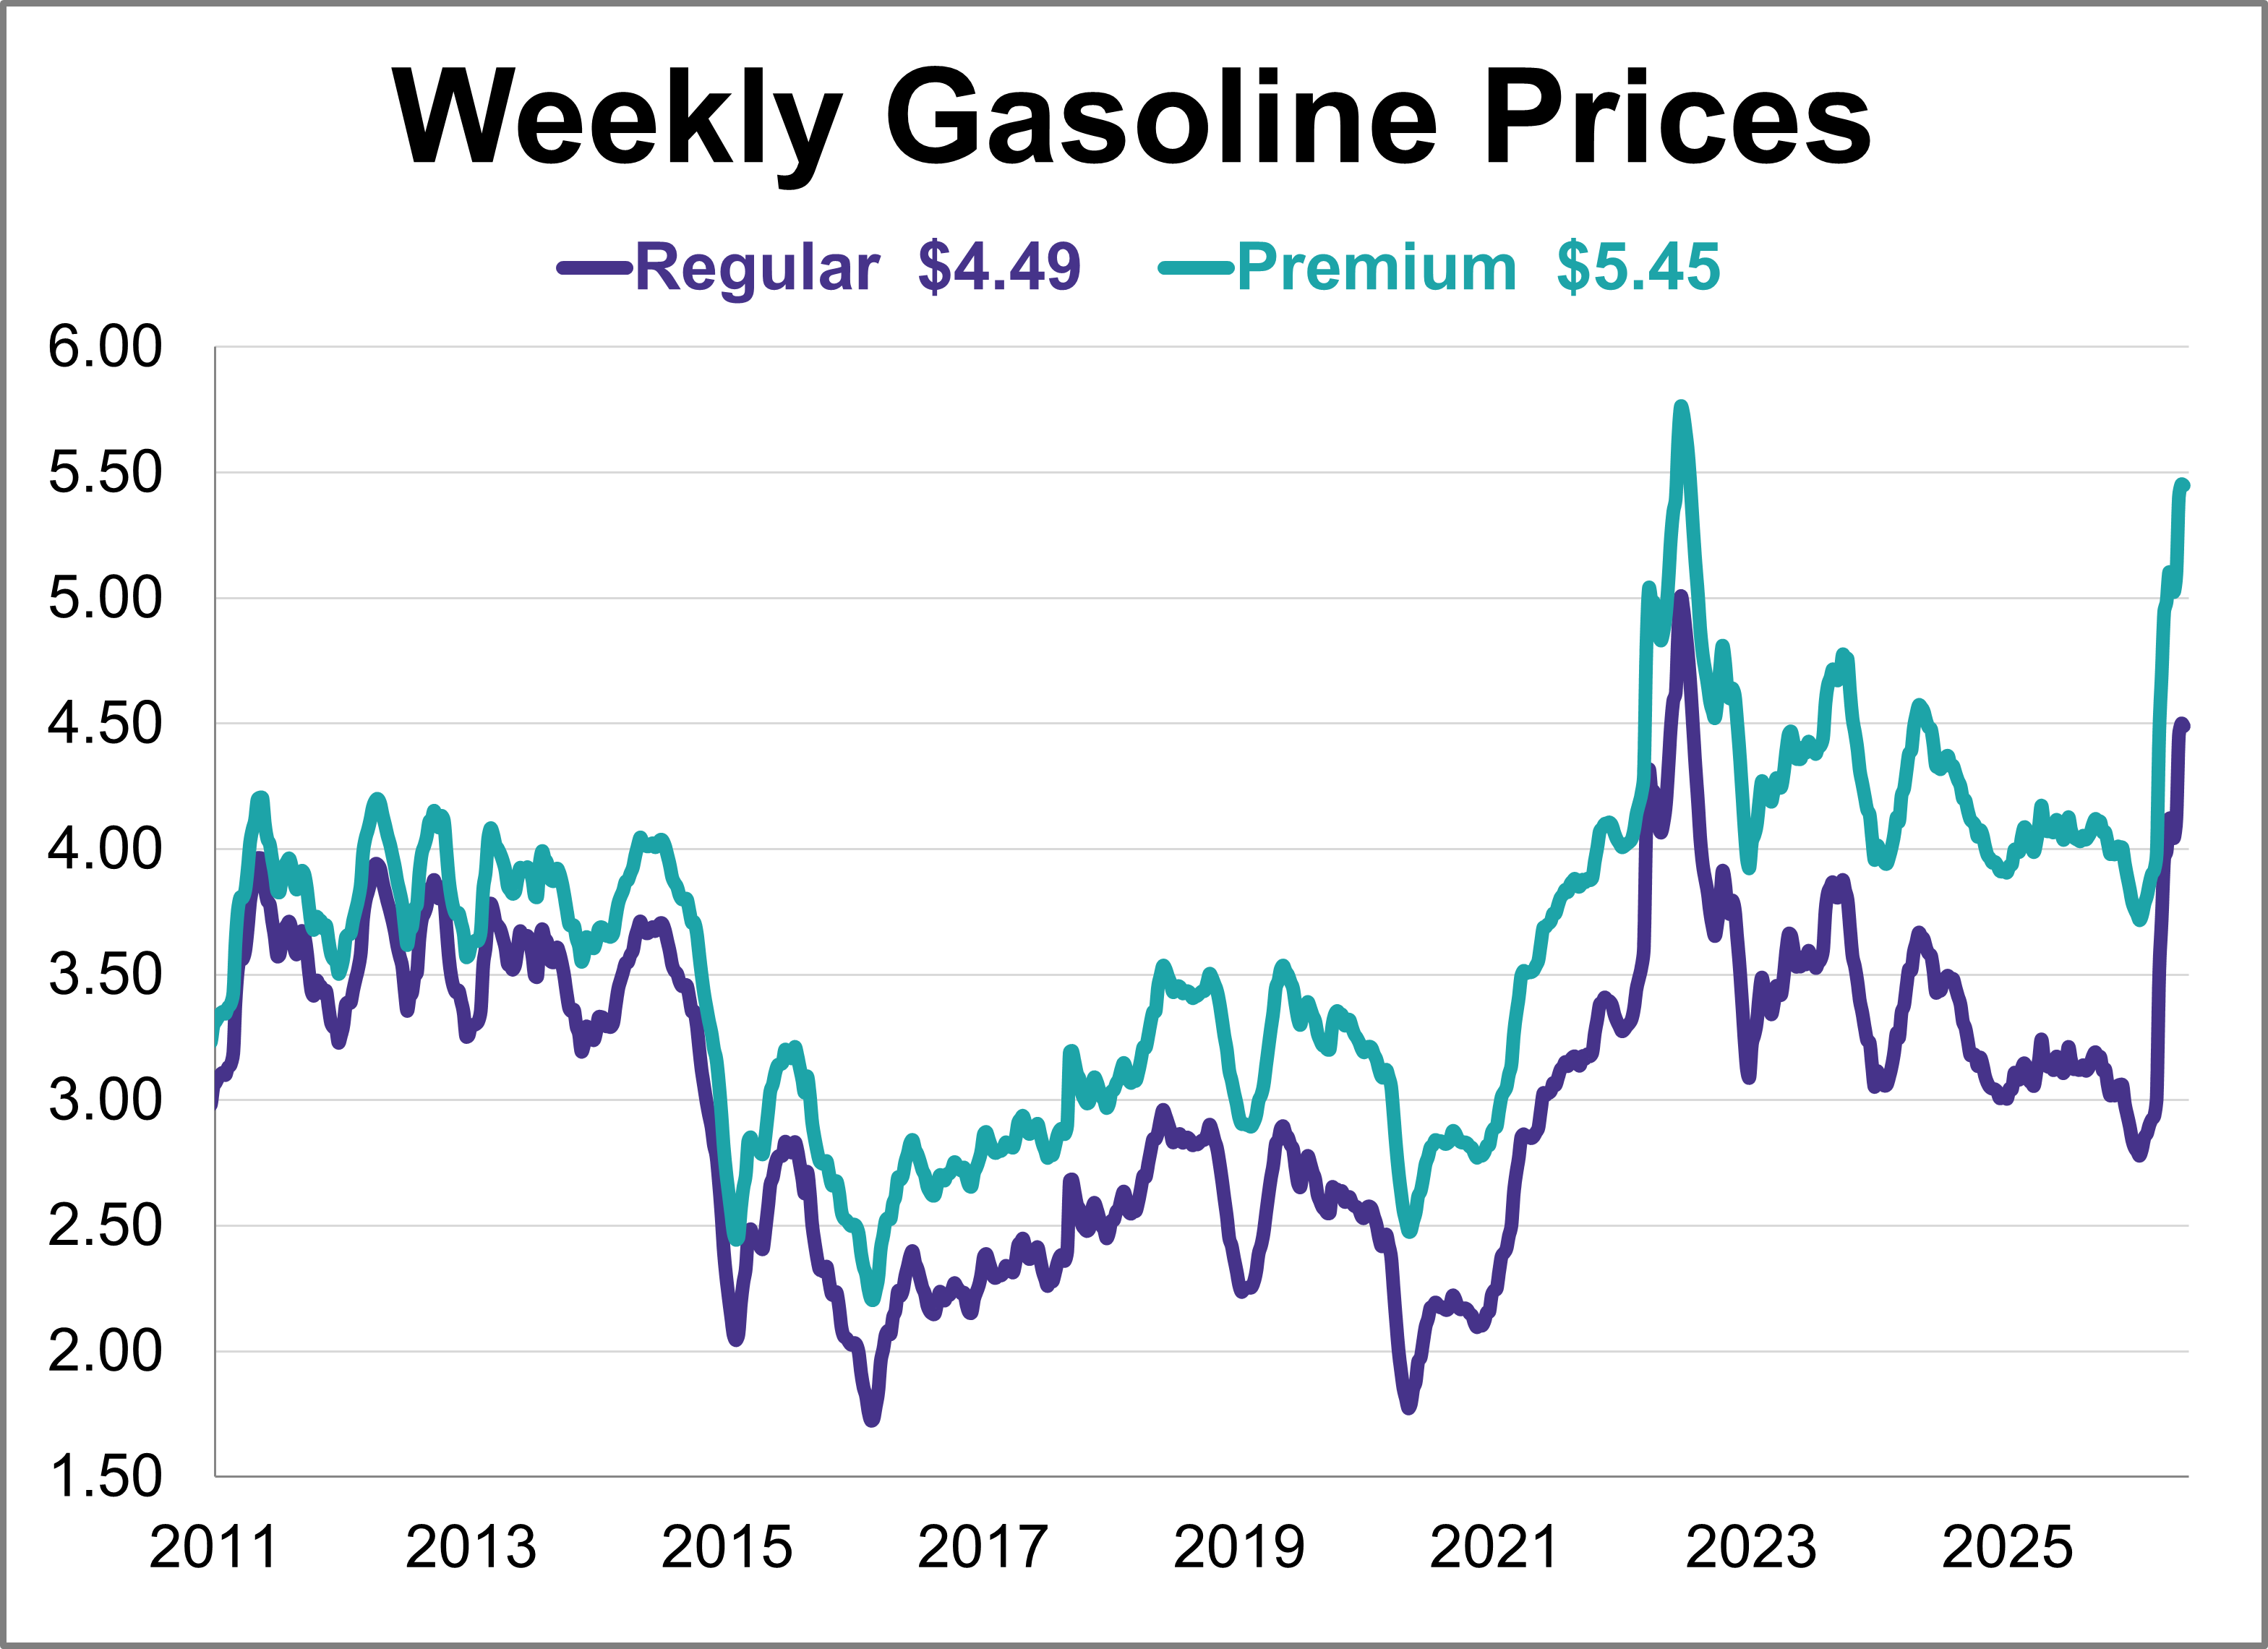
Gas prices were relatively flat this week, remaining at their highest level in nearly four years. As of May 18th, weekly prices were down 1 cent for regular and were unchanged for premium.
Weekly Economic Snapshot: Inflation Resurgence

The U.S. economic landscape in April was defined by a significant rebound in inflation across both consumer and wholesale sectors, complicating the path for future monetary policy.
Will I Be Replaced? Decoding the $1.5T AI Disruption in Finance

Explore how Women in ETFs & CFAOC experts believe AI will supplement, not replace, financial professionals.
Empire State Manufacturing Survey: Highest Level in Four Years
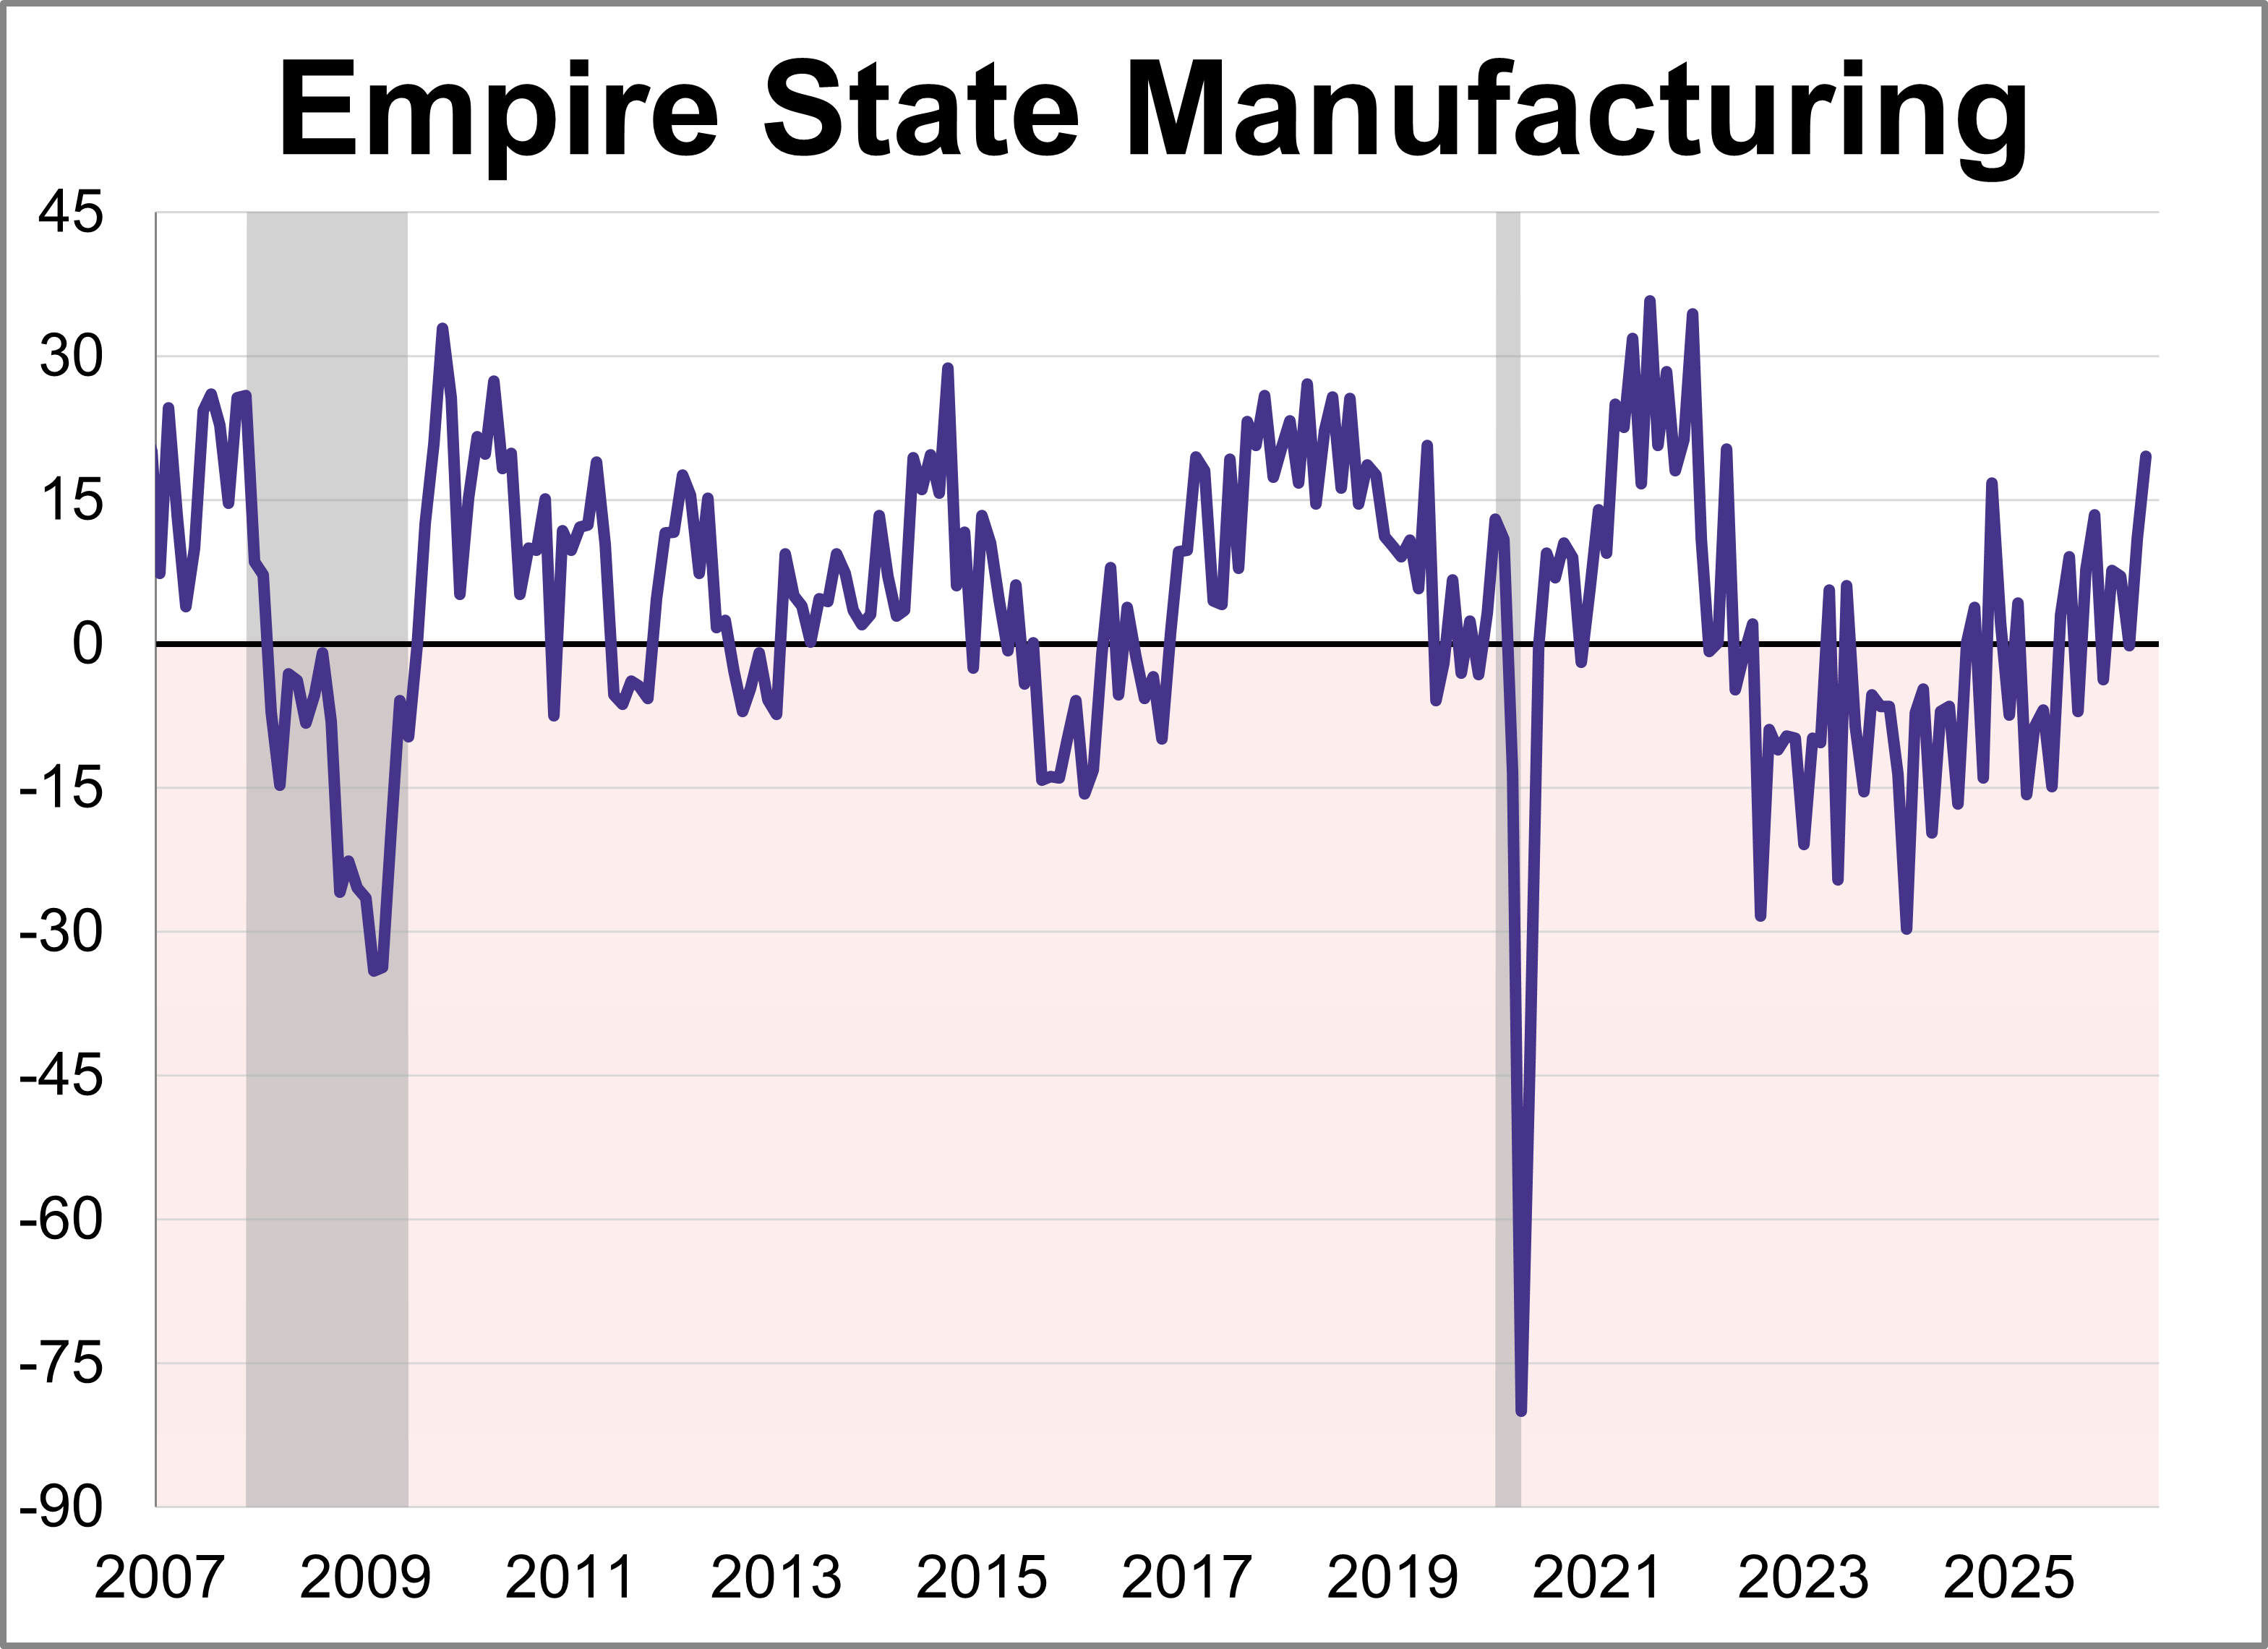
Manufacturing activity grew strongly in New York State, according to the Empire State Manufacturing May survey. The diffusion index for General Business Conditions rose 8.6 points to 19.6, its highest level in over four years.

Addressing Common 529 Savings Plan Concerns

Addressing common 529 Savings Plan concerns and how recent legislative updates have broadened the 529 scope.
Household Debt Rises to $18.79 Trillion in Q1 2026
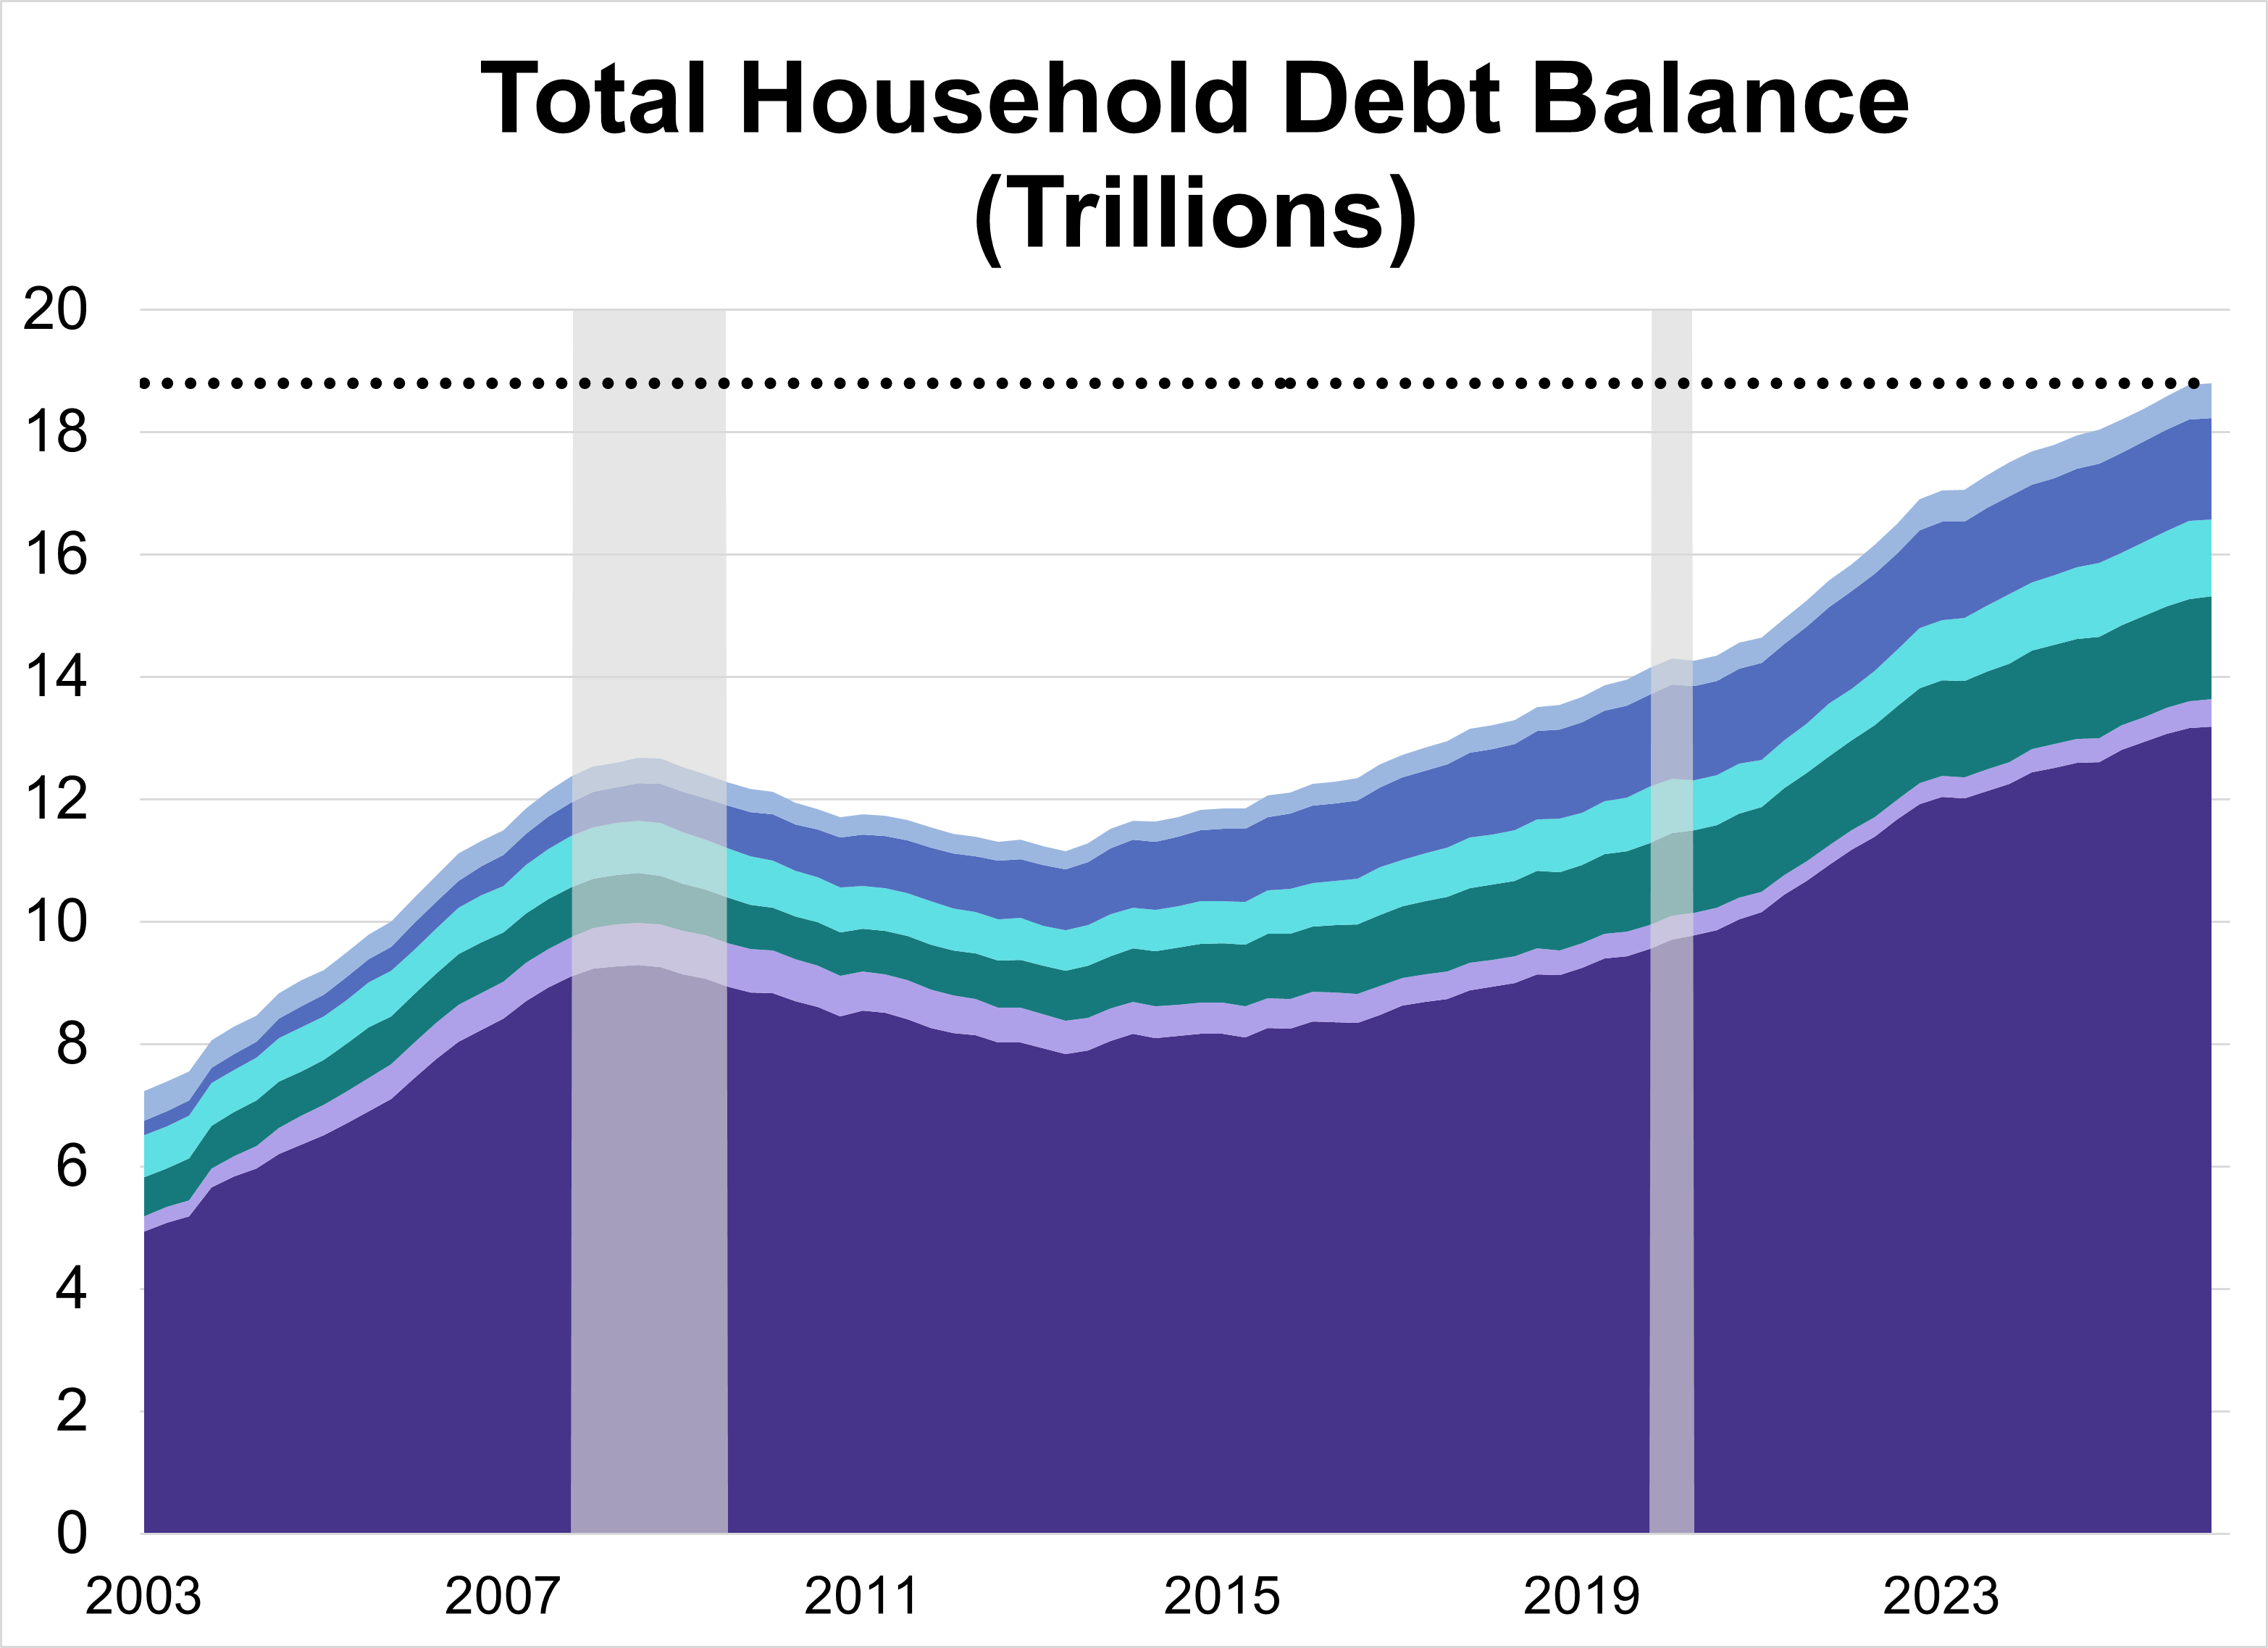
Total U.S. household debt climbed to a record $18.79 trillion in Q1 2026, a modest 0.1% ($18 billion) increase from the previous quarter. The overall rise was driven by increases across a handful of categories, specifically mortgage and auto loan balances.
Are Municipal Bonds Primed for a Summer Rebound?

Munis may have struggled a bit in March, but the long-term environment for these bonds remains full of potential.
The 529 Evolution: From College Savings to Versatile Financial Tool

Explore the new 529 rules, including Roth IRA rollovers, the grandparent loophole, and higher K-12 limits.
Weekly Economic Snapshot: Resilience in the Labor Market

The U.S. labor market demonstrated remarkable endurance in April, with job gains outpacing expectations and private sector expansion reaching its strongest point in over a year. As the Federal Reserve maintains a steady interest rate policy, the focus now turns to upcoming inflation and retail data to gauge the sustainability of this momentum.
S&P Persistence Scorecard Reveals Universal Struggles for Active Strategies

As market volatility lingers, the latest S&P Persistence Scorecard reveals a sobering reality for active managers.
Rethinking Growth: Why Glamour Isn't a Proxy for Performance

Research Affiliates explains how a fundamental growth strategy can outperform traditional market-cap-weighted growth indices.
PWRD: Solving the $5 Trillion Power Constraint

TCW's concentrated strategy targets power grid constraints over clean tech, riding demand from AI and manufacturing reshoring.
Goldman Sachs’ 2025 Retirement Investing Report: 3 Takeaways

Retirement is a challenge for countless investors and their advisors. A new report from Goldman Sachs has more.
Advisor Perspectives’ Top 5 Articles Examine Big Topics

April saw a variety of articles published on Advisor Perspectives address core questions with which advisors and their client must contend.
Top Concerns Reshaping Advisor Strategy in 2026

Advisors are rethinking strategy in 2026, as geopolitics, AI adoption, and downside risk reshape market expectations and investment decisions.
As a Matter of Factor, Momentum & Growth Dominated April

Momentum and growth dominated in April 2026, driving the S&P 500 to a massive 10.5% return. Discover the data behind this risk-on shift.
Weekly Economic Snapshot: Rising Inflation and Policy Dissent

The U.S. economy ended April with mixed signals: steady interest rates and high Fed dissent met persistent, energy-driven inflation. Despite these hurdles, accelerated Q1 growth and rising consumer confidence provided a buffer against ongoing global instability.
Volatility ETFs Seem Perfect for the Current Moment; Have They Performed?

Volatility ETFs have specific purposes to fulfill for investors -- so have they done so in a very volatile year?
Home Ownership Rate at 65.3% in Q1 2026
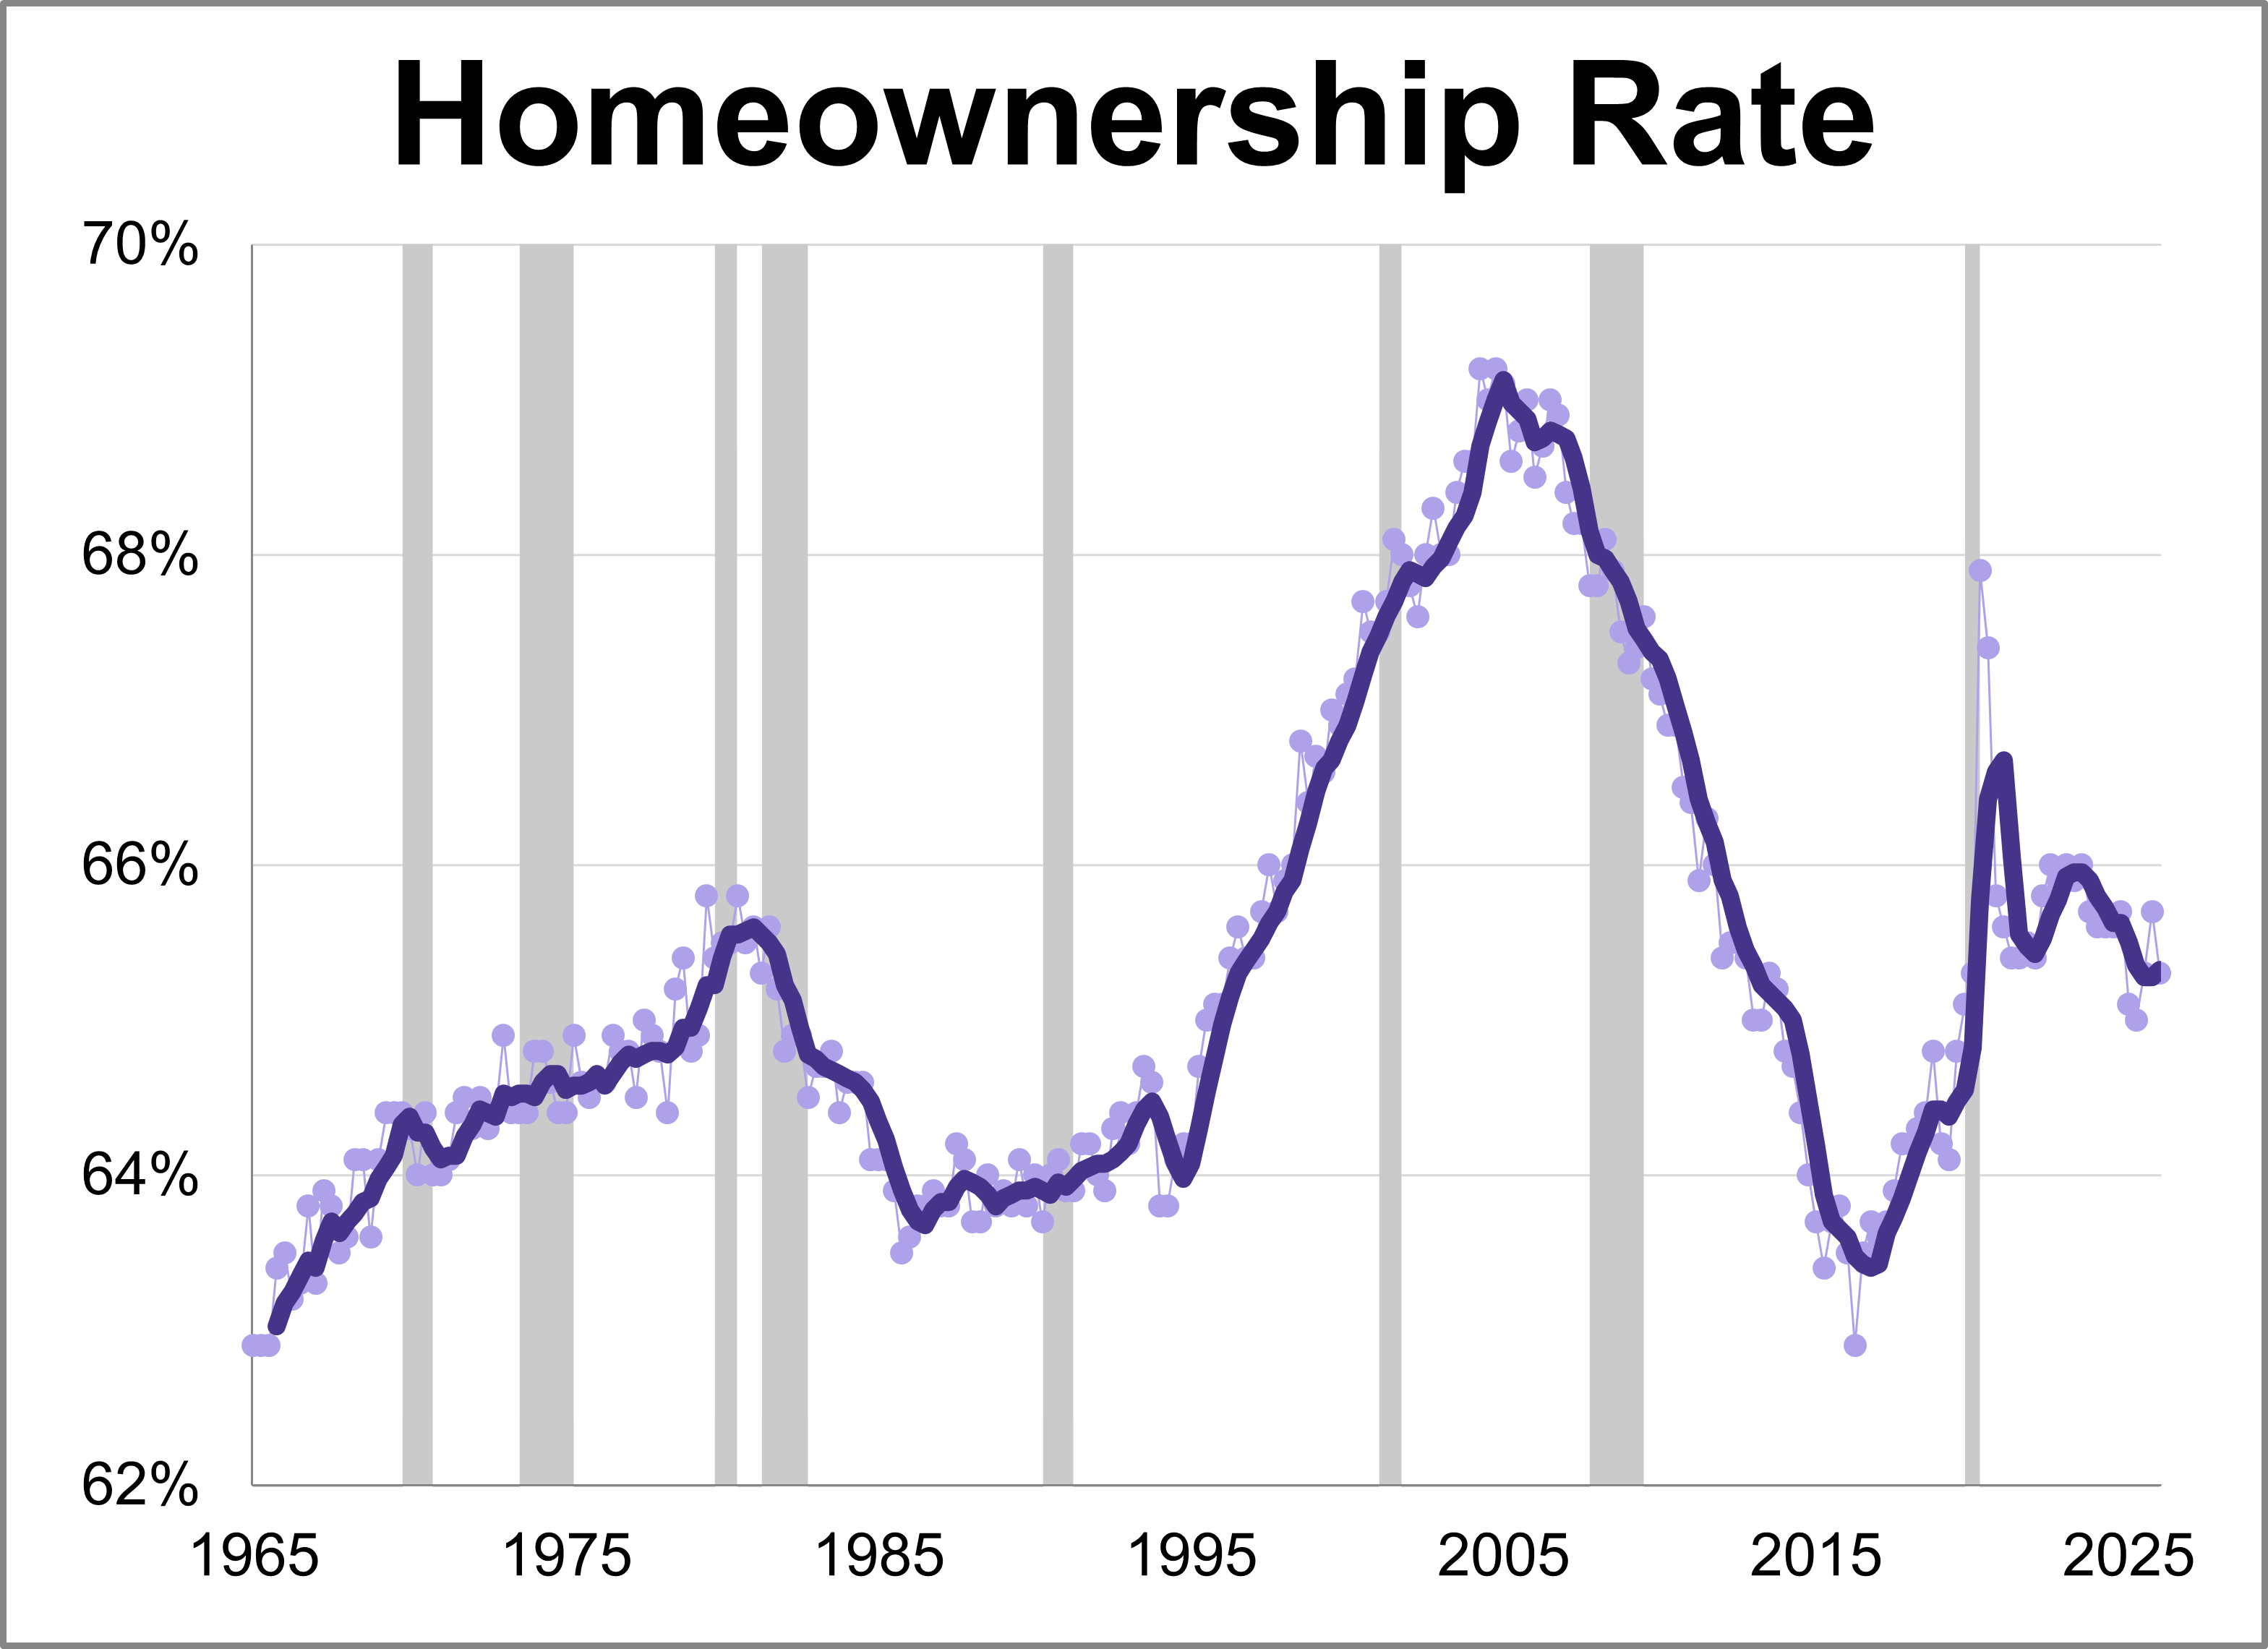
The Census Bureau released its latest quarterly report for Q1 2026 showing the latest homeownership rate is at 65.3%.
Richmond Manufacturing Index Reaches 20-Month High
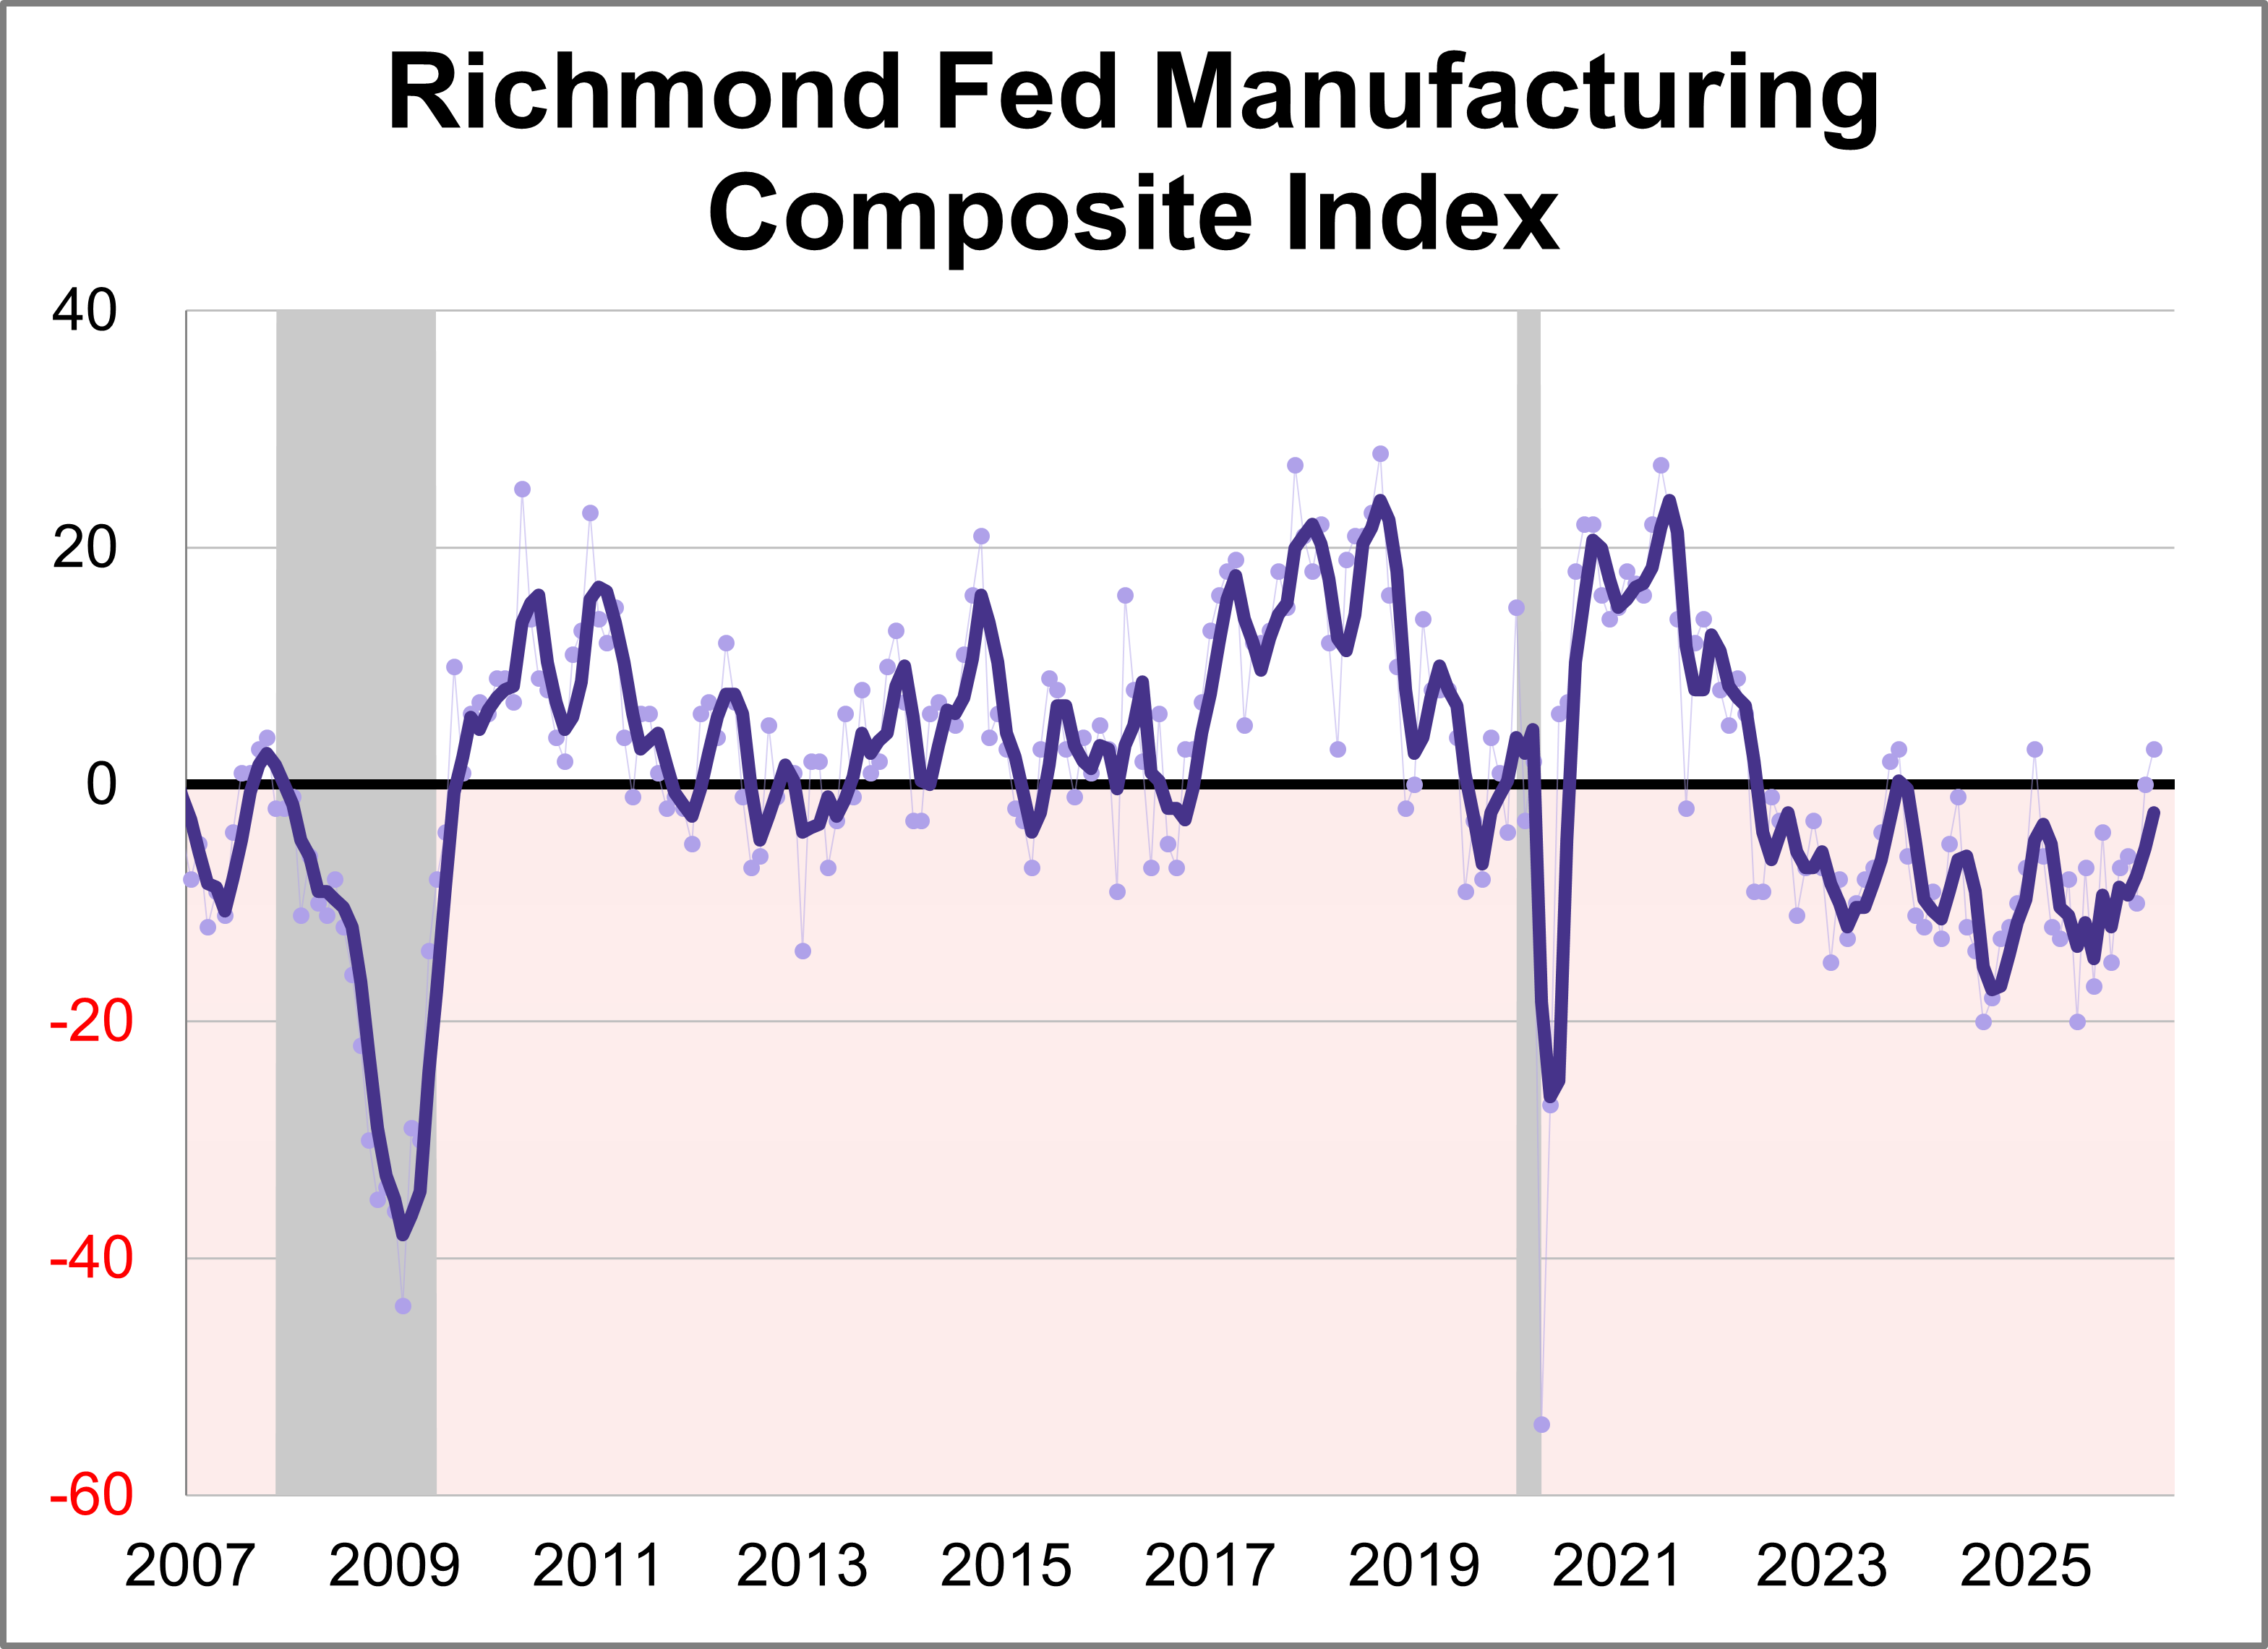
Fifth district manufacturing activity increased in April according to the most recent survey from the Federal Reserve Bank of Richmond. The composite manufacturing index rose three points points to 3, marking the highest level for the index in 20 months. This month's reading was above the forecast of 2.
Weekly Economic Snapshot: Resilience Amid Record Sentiment Lows

Last week’s economic data was defined by conflicting signals from the consumer. While retail figures suggest resilience, sentiment levels have plummeted to record lows. Meanwhile, the S&P 500 continued its historic rally as markets prepare for the upcoming Fed decision.
Why Flows Into Active ETFs Are Outpacing Total Market Share

Active ETFs are no longer a niche satellite play; they are becoming central pillars of modern portfolio construction.
Chart-ing the Economy: Week of April 6-10th, 2026

While recent market performance reflects optimism over potential geopolitical de-escalation, underlying economic data reveals a complex landscape of intensifying price pressures and cooling growth. This article examines the major economic news from the week of April 6-10th, 2026.
Weekly Economic Snapshot: Geopolitical Tensions and Inflationary Pressures

While recent market performance reflects optimism over potential geopolitical de-escalation, underlying economic data reveals a complex landscape of intensifying price pressures and cooling growth.
How Advisors Are Rewiring Fixed Income Portfolios

The traditional 60/40 portfolio is undergoing a structural renovation, but the fixed income sleeve is proving difficult to stabilize.
The Four Bad Bears: A Century of Market Recovery
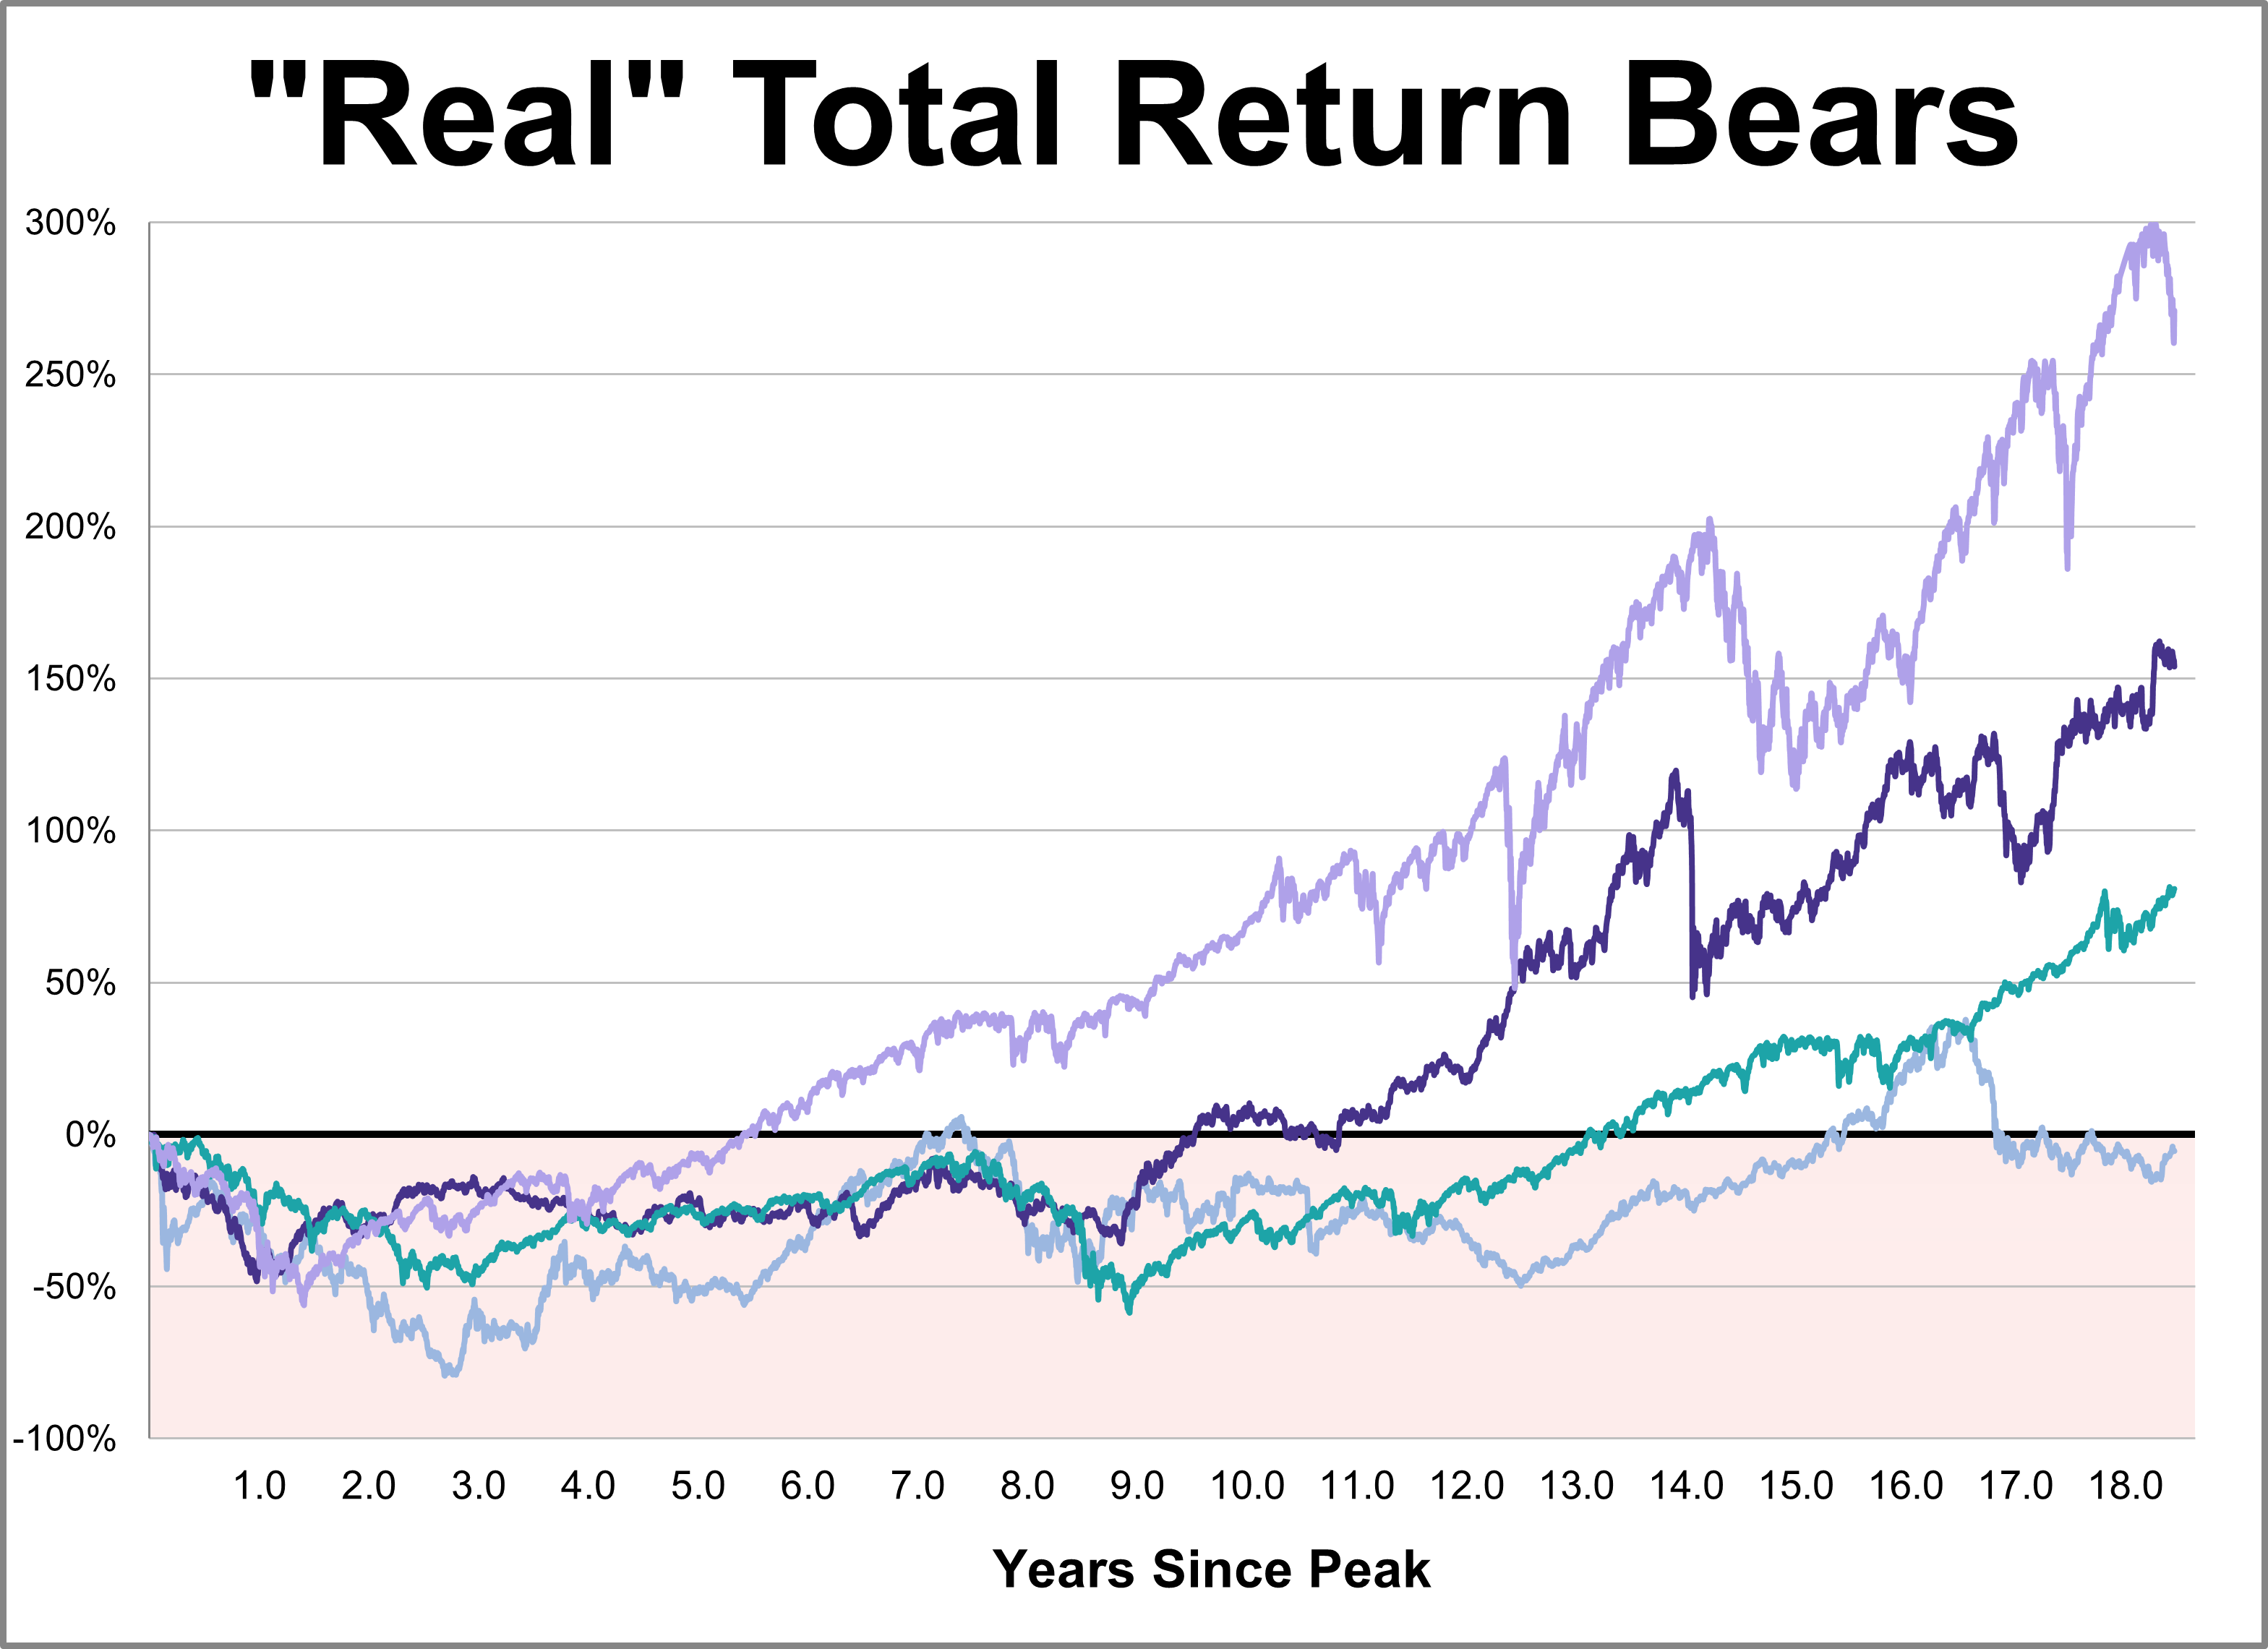
While every market downturn is unique, history offers a crucial lens for understanding recovery. This chart series provides a comprehensive overlay of the Four Bad Bears in U.S. history since the 1929 peak, comparing their recovery paths through the S&P 500's close on March 31, 2026.
Optimizing Late-Start 529 Plans: Tactical Strategies for Advisors

Learn how advisors can optimize late-start 529 plans using superfunding, SECURE 2.0 Roth rollovers, and multi-scenario modeling.
Broader Is Better: Why BCI Is Ideal for Commodities Exposure

Discover how abrdn’s K-1 free ETF outpaced gold and the S&P 500 in March 2026 by providing broad, tax-efficient commodities exposure.
Advisors, Families, & 529 Plans: Starting the Conversation

529 Plans are a huge part of many families' investing lives, but up until recently rarely involved advisors. Could that change?
Advisors Weigh Crypto Portfolio Strategies

An Exchange conference panel explored bitcoin's evolving role, allocation tactics, and ETF structures for advisors building crypto portfolios.
Weekly Economic Snapshot: Erosion of Confidence and Extended Market Losses

Heavily influenced by escalating geopolitical conflicts, last week's economic snapshot reveals a sharp erosion of confidence among consumers and investors alike.
What Advisors Should Know About the ETF/Mutual Fund Convergence

The convergence of ETFs, mutual funds, and tokenization is gaining momentum as asset managers seek to modernize product structures, expand distribution, and future-proof their businesses without abandoning established regulatory frameworks.


How Advisors Are Leveling Up With 351 ETF Conversions

Learn how RIAs are using Section 351 ETF conversions to modernize SMA strategies, defer capital gains, and boost firm valuation.
Why Few Advisors Plan for Succession

Industry experts at Exchange 2026 explored why only a quarter of advisors have formal succession planning in place and what it takes to execute well.
The Fed's Financial Accounts: What Are Uncle Sam's Largest Assets?
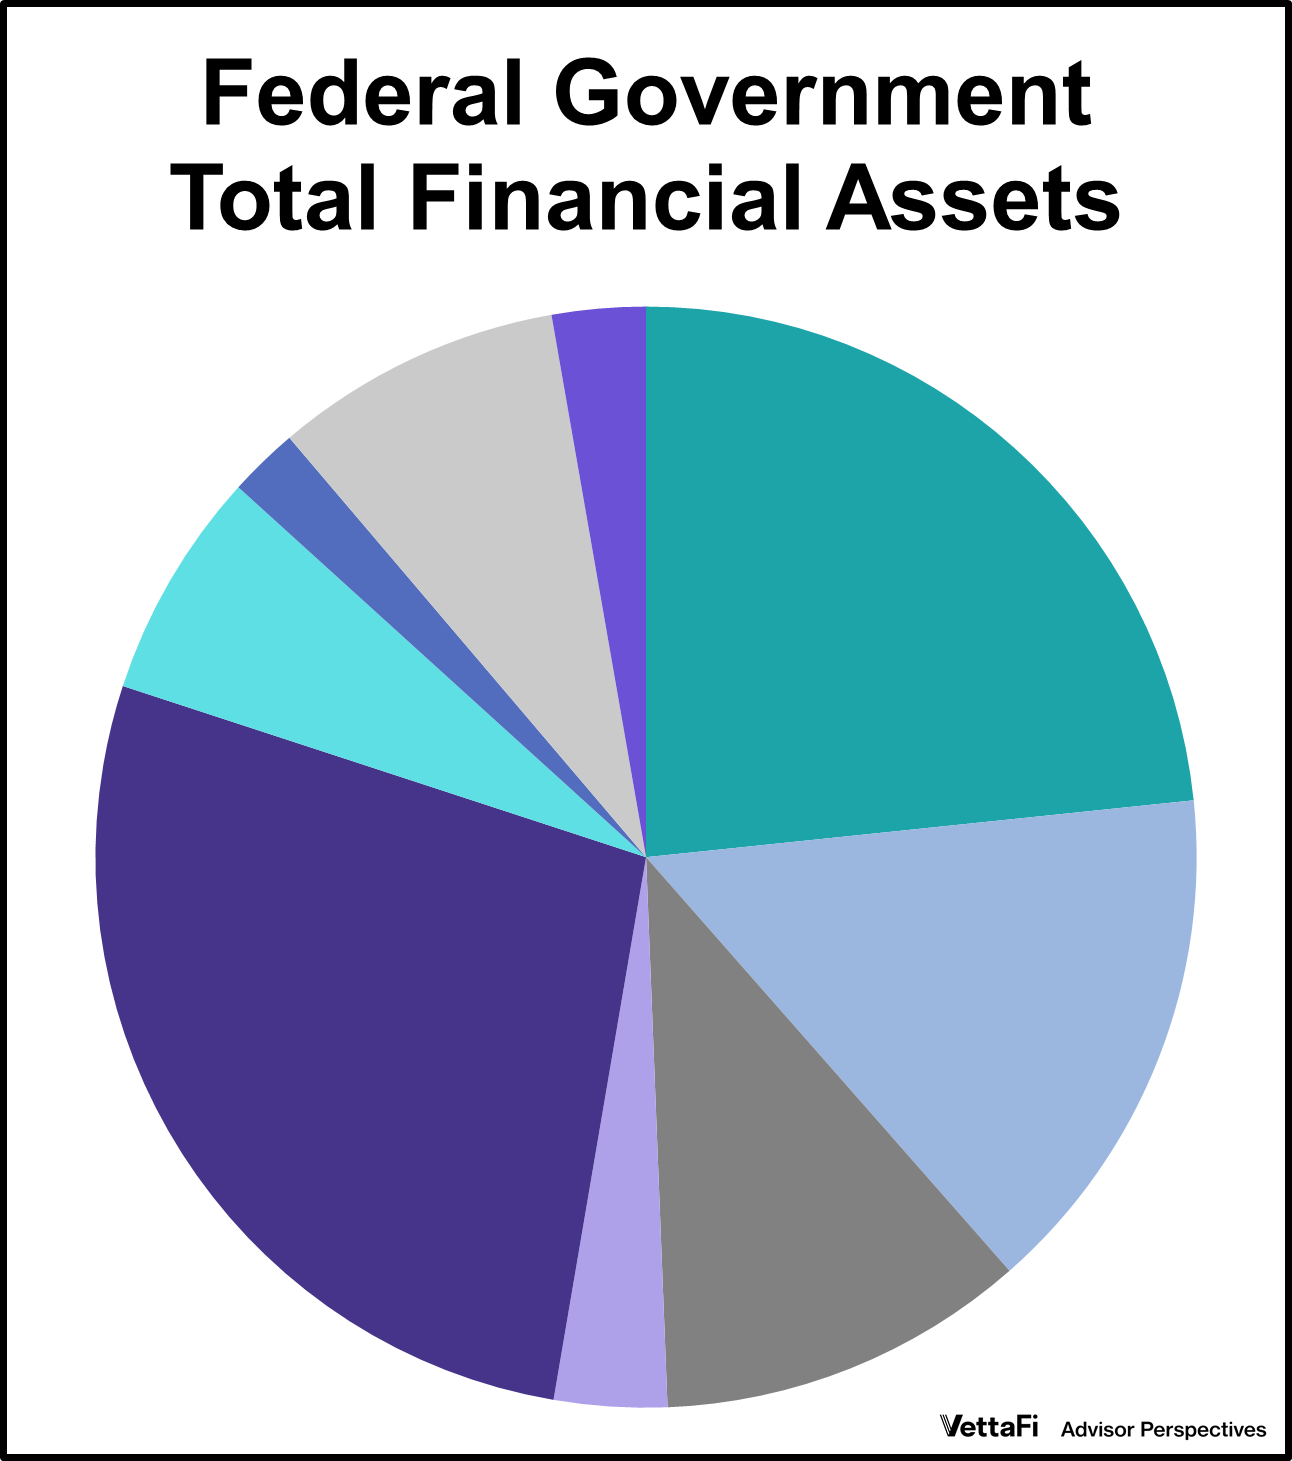
When we think of the U.S. government's finances, we often focus on the massive debt. But what about the assets? What does Uncle Sam actually own, and which asset is the largest?
Household Net Worth Q4 2025: The "Real" Story
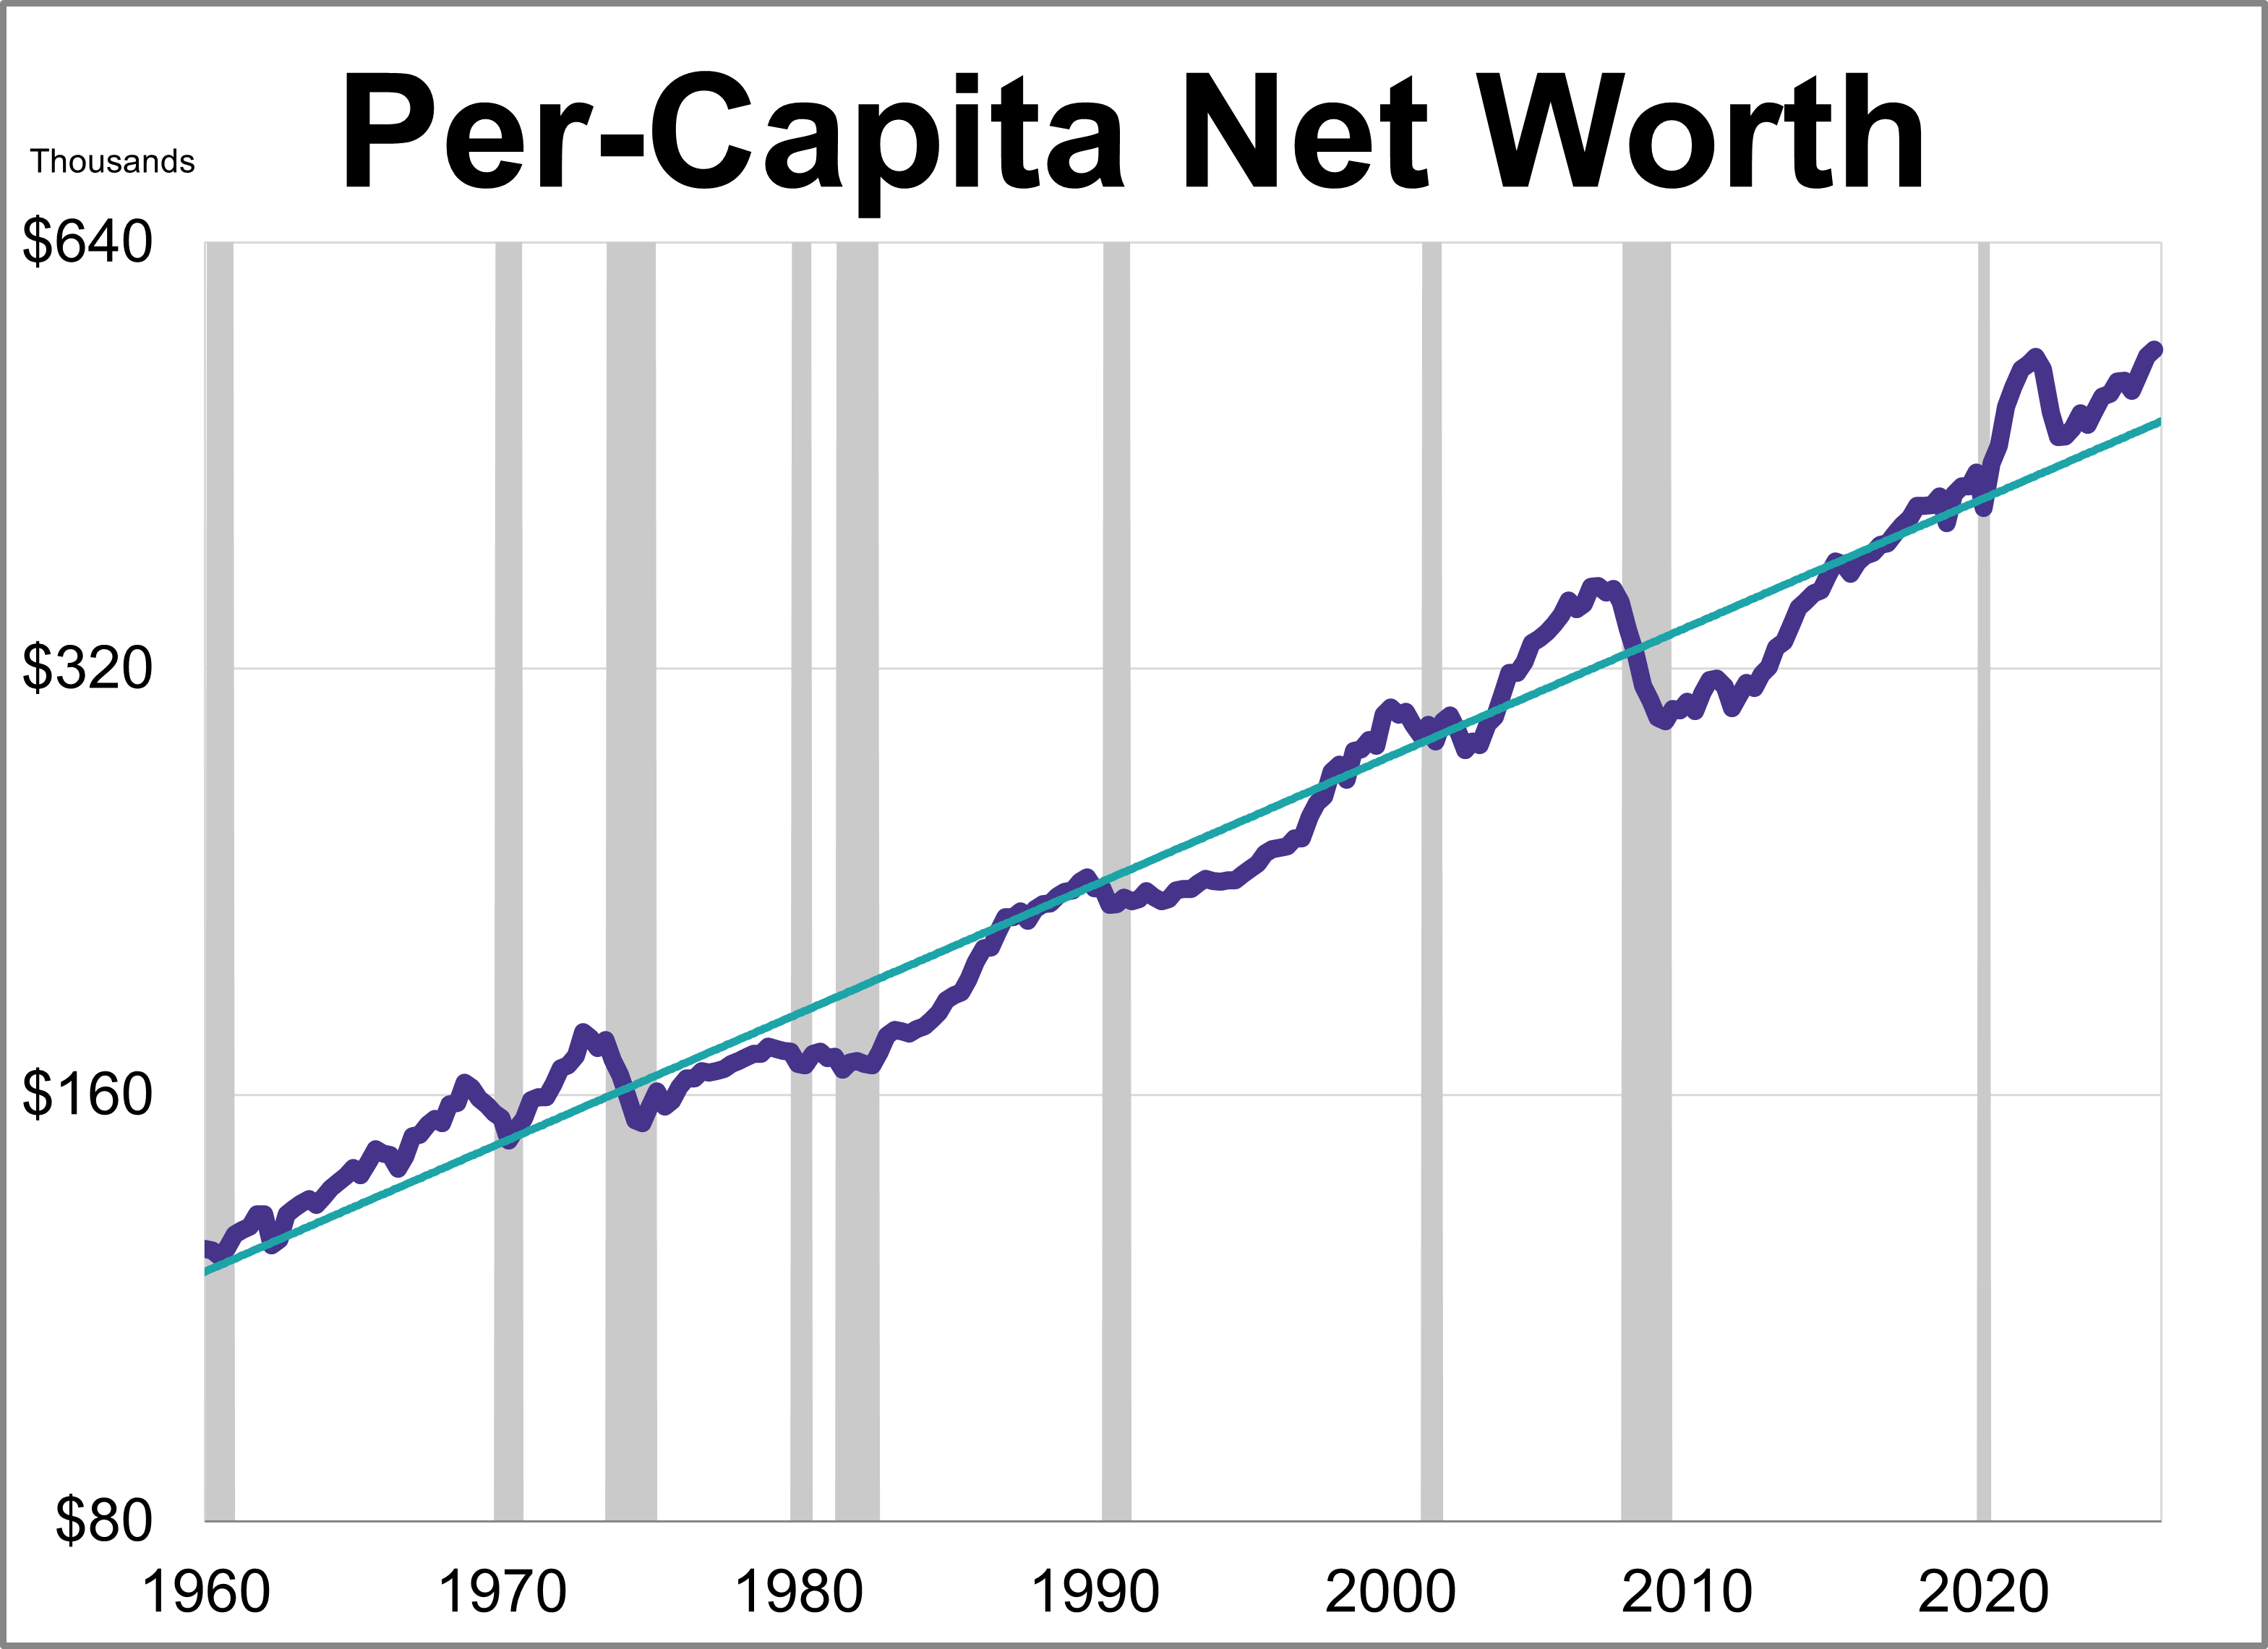
How much wealthier are Americans since the Great Recession? While a look at the headlines shows a staggering 211% increase in household net worth since 2009, adjusting for inflation tells a much different story.
DoubleLine’s Jeffrey Sherman on the Fed’s TACO Trade & Fixed Income Strategy

Jeffrey Sherman of DoubleLine provided a candid assessment of the Federal Reserve's current trajectory and fixed income at Exchange.
Dimensional Launches the First Actively Managed ETF Share Class

History made: Dimensional launches first active ETF share class. Access 40 years of micro-cap expertise in a tax-efficient ETF wrapper.
How Active ETFs Brought Muni Bonds Investing to Life

Muni bonds have been a strong performer so far in 2026, benefitting from an important transition to the ETF wrapper from mutual funds.
March Madness: The 2026 AP Charts Bracket
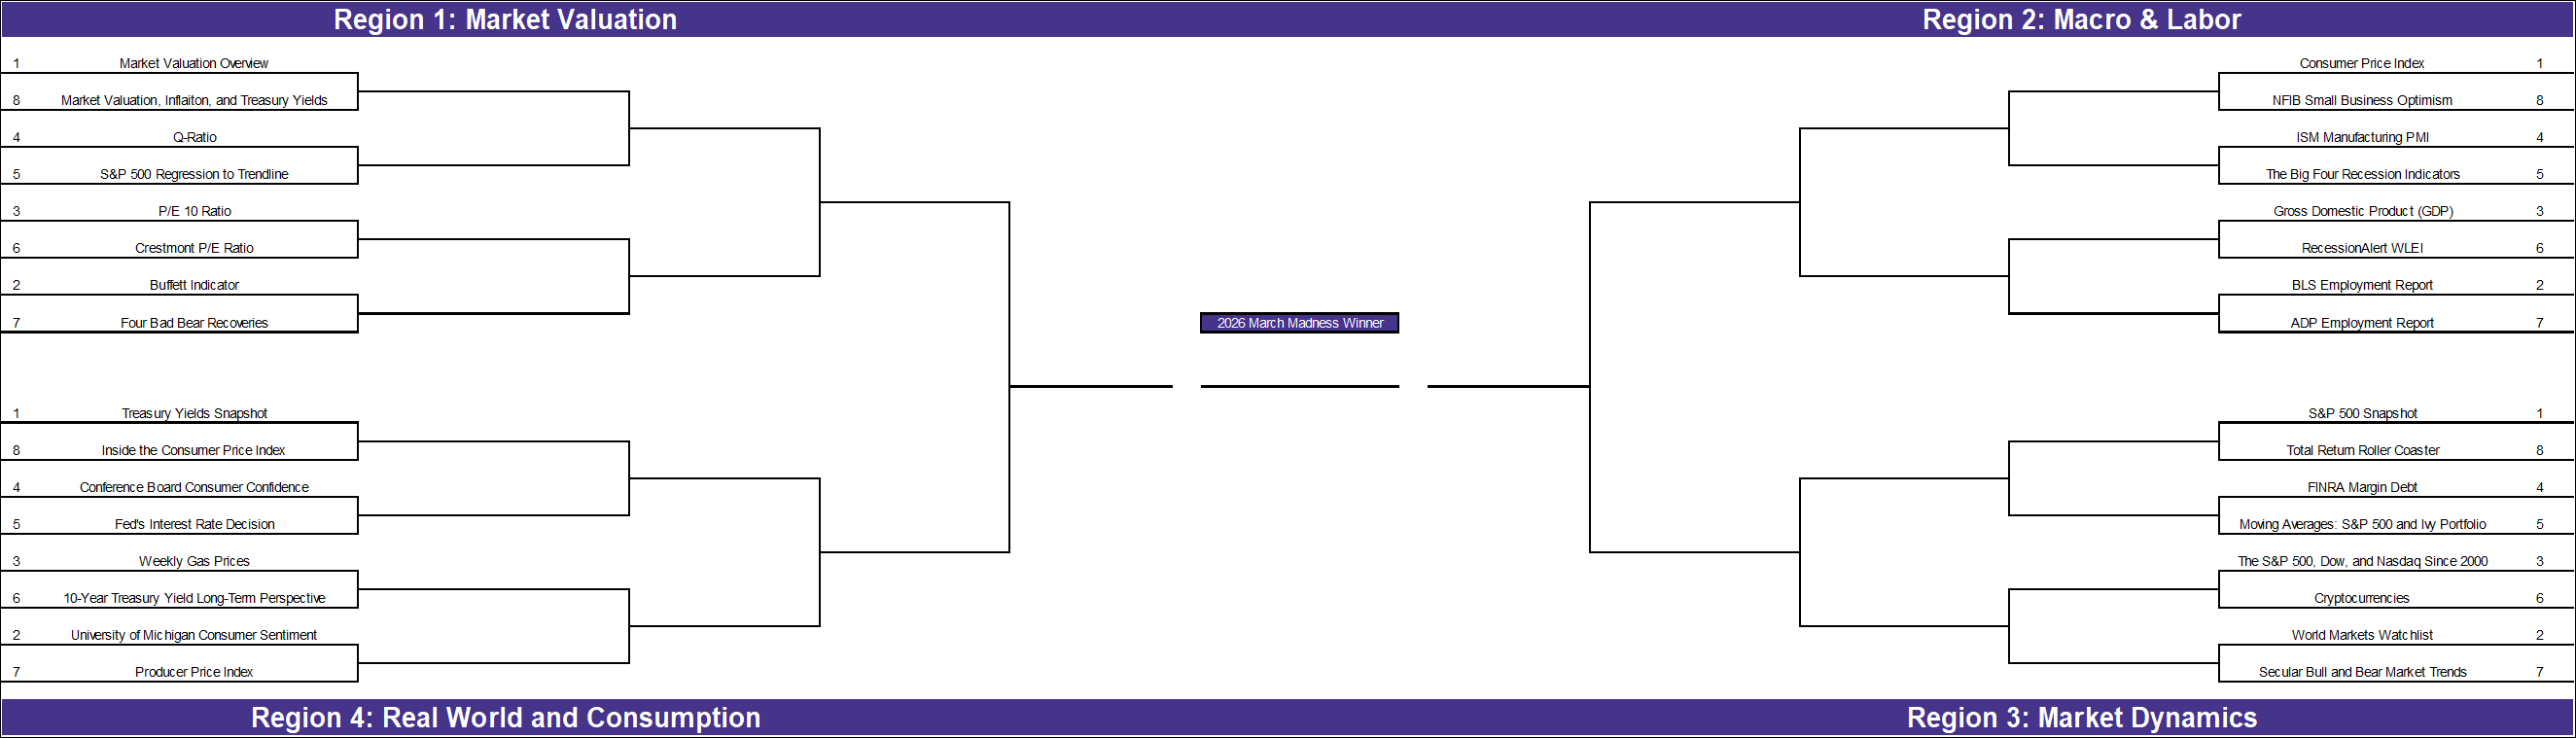
With the NCAA tournament beginning in just a few days, we’ve applied the bracket format to our own research. While economic theory often dictates what should be most important to investors, our reader engagement reveals which topics truly commanded investor attention over the past year.
ETF Roundup: 3 New ETF Launches in February to Watch

February saw more than 50 new ETF launches according to ETF Database data, with some standout offerings to note.
Olympic Arbitrage: Normalizing Success at the 2026 Winter Olympics
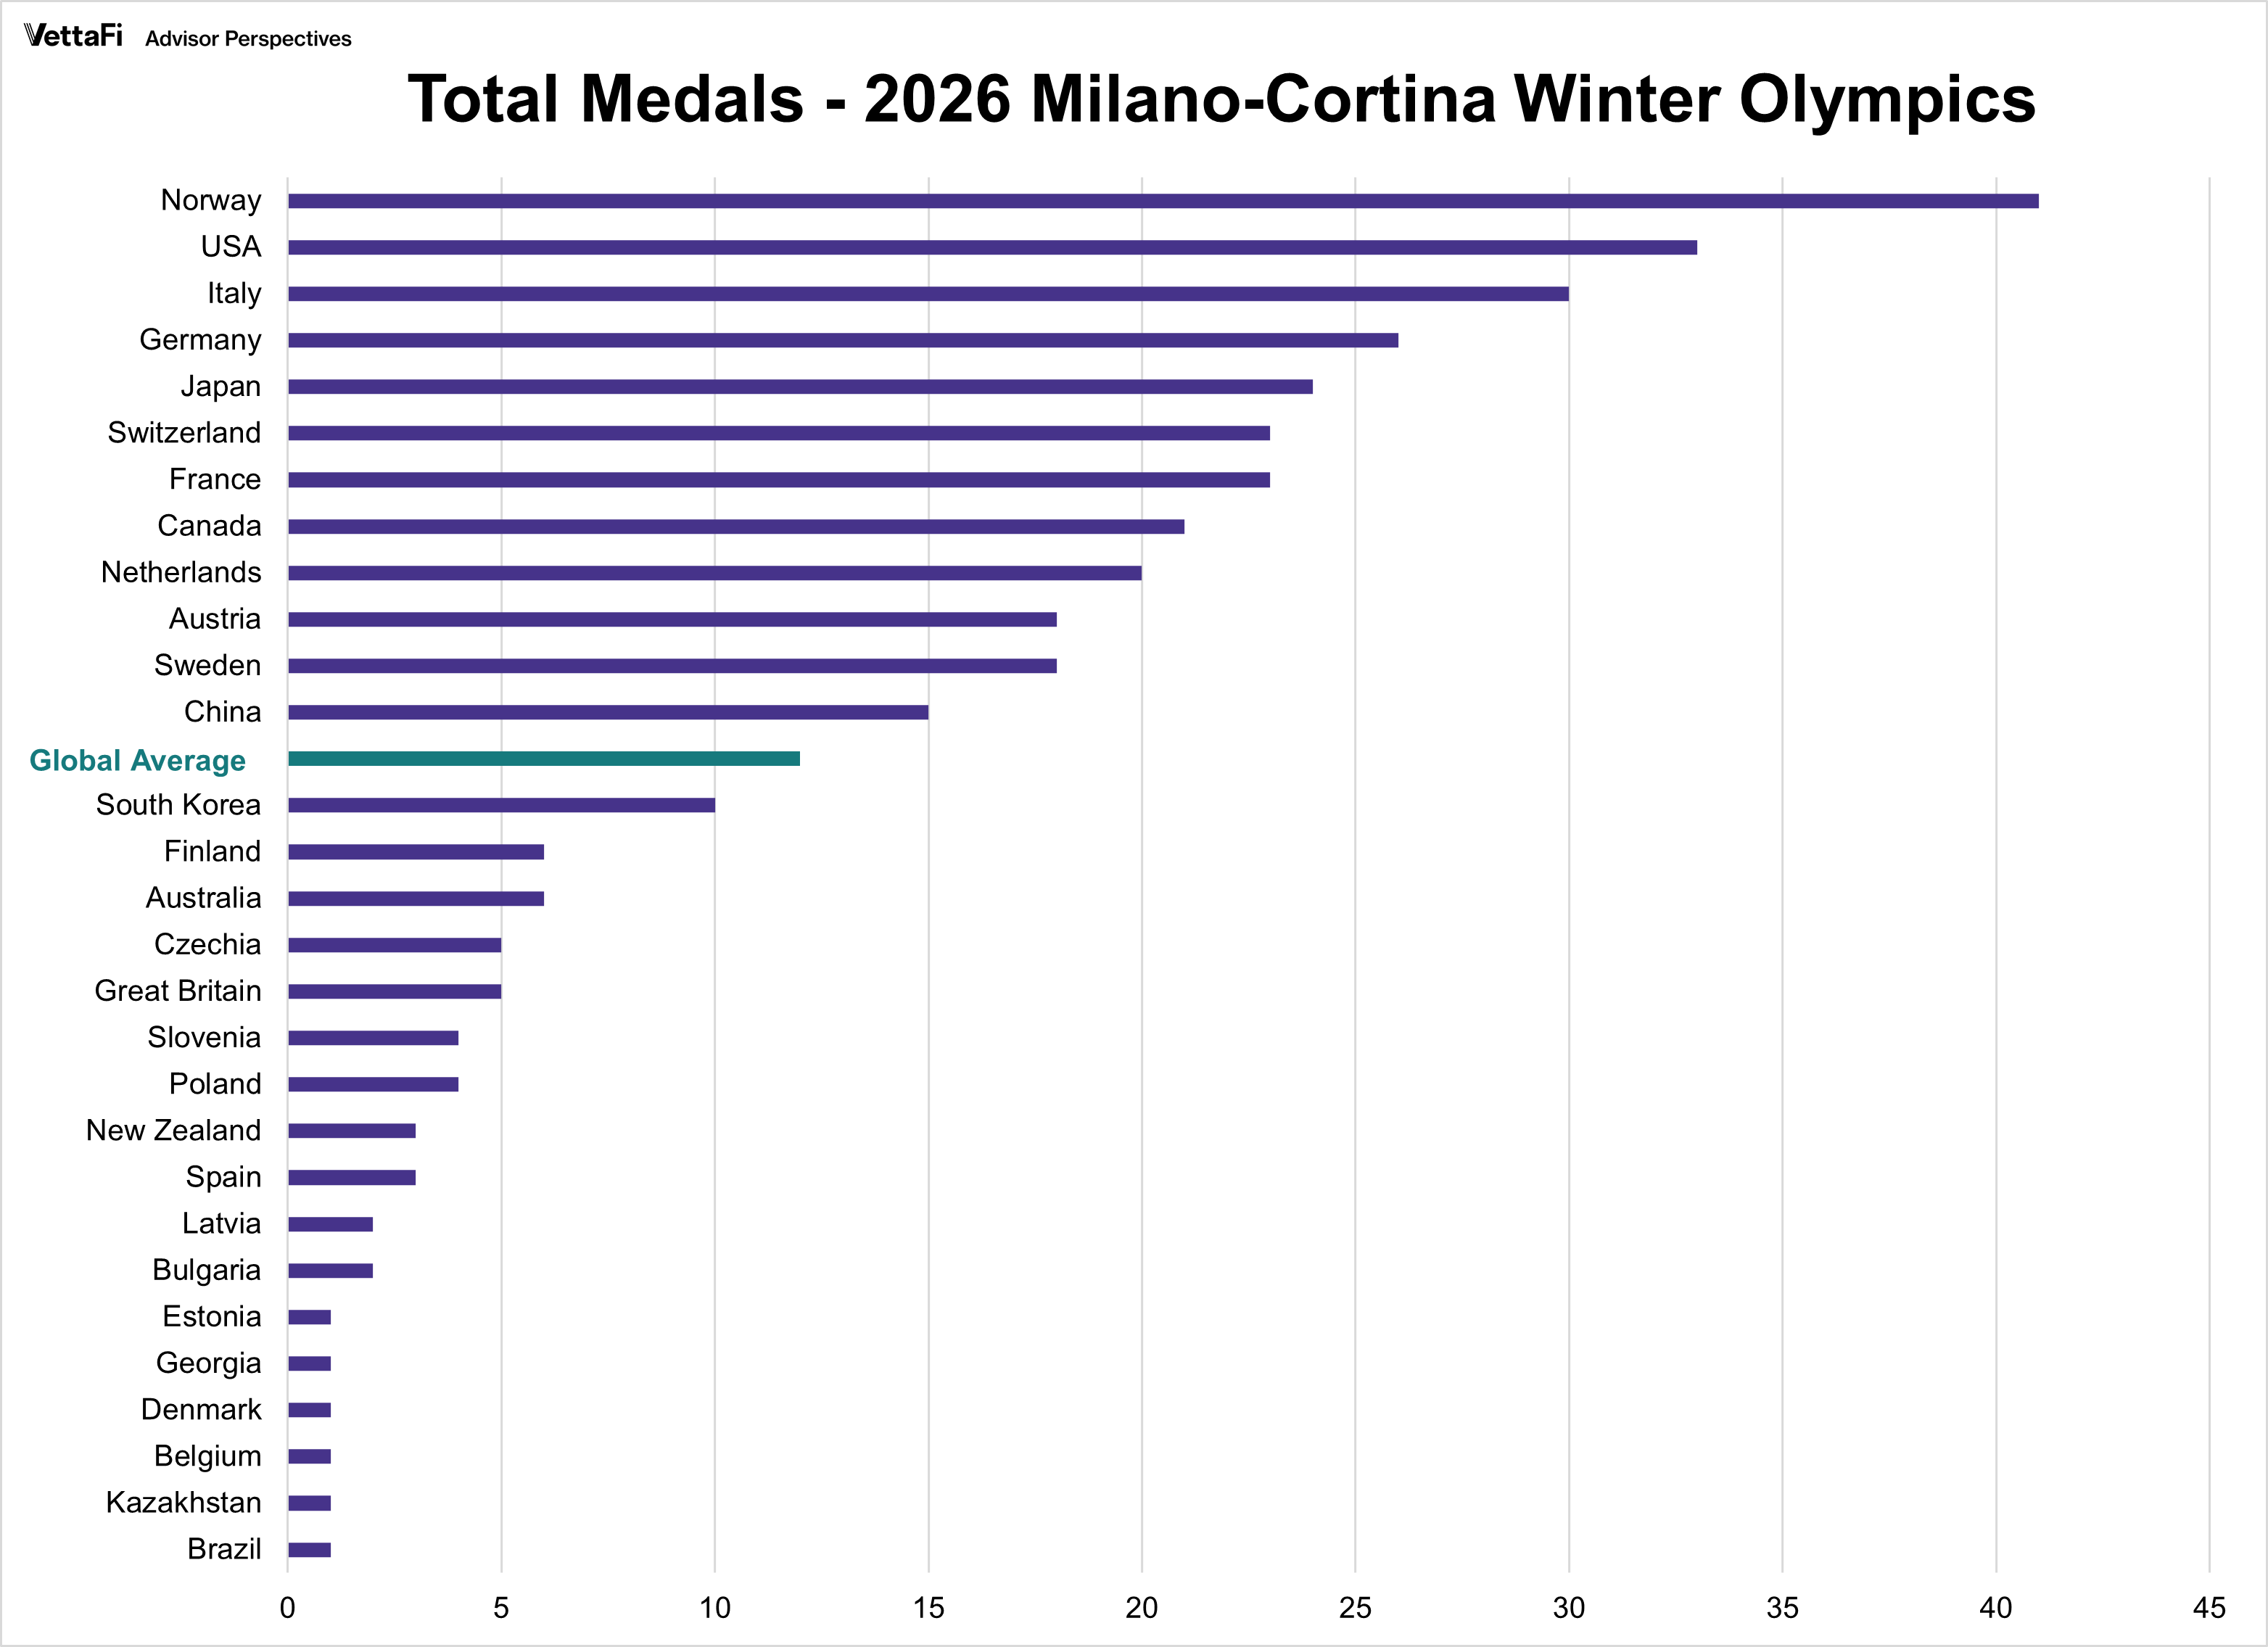
The Milano-Cortina 2026 Winter Games concluded with a familiar hierarchy at the top of the medal table. But in the world of economic indicators, we rarely look at totals without normalizing for scale. The 2026 Winter Games are no different.
Tactical Philanthropy & Legacy Planning for HNW Investors

A guide to helping HNW investors align tax efficiency with philanthropy, retirement strategy, and multi-generational wealth transfer planning.
Tax Strategies Every High-Net-Worth Advisor Should Know

From real estate to multi-generational planning, learn the key strategies high-net-worth individuals use to maximize wealth and legacy.
ETF Innovation: Preparing for the Unexpected

With uncertainty rising through geopolitical conflict, AI risk, and inflation, ETFs that offer greater portfolio control may be the way to go.


Weekly Economic Snapshot: Inflation Heat Meets a Cooling Economy

The U.S. economy sent conflicting signals last week as a sharp deceleration in growth collided with unexpectedly stubborn inflation.
Augmenting Advisor-Client Relationships With Charitable Giving

Advisors can foster a stronger relationship with their clients through providing advice over charitable giving.
Weekly Economic Snapshot: Labor Strength Meets Cooling Inflation

The U.S. economy began 2026 with a display of unexpected resilience in the labor market and cooling inflation.
The Reality of Fund Merger Fee Savings

SEC White Paper: Do fund mergers lower fees? Explore how economies of scale impact expense ratios and performance for ETFs and mutual funds.
What Advisors Need to Know About the Rapid Rise of Active ETFs

The surge in active ETF launches aligns with broader market trends. For example, active ETF strategies accounted for roughly 60% of new ETF launches in the early months of 2025, underscoring the category’s growing momentum and advisor interest.
Weekly Economic Snapshot: Jobs Data Softens While Consumer Sentiment Rises

The U.S. labor market showed further signs of cooling last week as private sector hiring slowed and job openings reached their lowest levels in over five years.
An Advisor’s Roadmap to AI Integration From Vanguard’s CIO

Vanguard CIO Lauren Wilkinson shares a strategic roadmap for RIAs curious about AI integration for their practice.
Not Just Stocks: State Street Leader Bartolini Talks Diversification, ETFs in 2026

ETF industry and State Street Investment Management leader Matt Bartolini joined VettaFi's Todd Rosenbluth to talk diversification.
Silver ETFs: Not Always Second Place

Throughout most of 2025, silver has recently outperformed gold, proving (ironically) that it is not always second place. Strength in silver built gradually through last year, but the latest pullbacks are a reminder that near-term market reactions can outweigh fundamentals and long-term investor sentiment.
Mutual Fund to ETF Conversion Data Boosts Active Fixed Income ETF Case

Active fixed income ETFs stand out amid the broader transition from mutual funds to ETFs, with DSCO a recent switch.
Record January ETF Flows Highlight Rotation Away From Concentration

The ETF industry has carried its record-breaking momentum from 2025, surpassing $100 billion in flows before the end of January.
Vanguard Aggressively Cuts Fees Across 53 Funds, Totaling $250 Million in Savings

In a move that underscores the relentless downward pressure on investment costs, Vanguard announced that it has slashed fees for 84 mutual fund and exchange-traded share classes. These reductions, spanning 53 different funds, represent nearly $250 million in estimated savings for investors in 2026 alone.
Weekly Economic Snapshot: Fed Shifts to “Wait-and-See” as Confidence Plummets

The final week of January saw a stark divergence between official policy and the American consumer's outlook. While the Federal Reserve maintained a "solid" view of economic growth, the public’s mood plummeted to a decade-low as sticky amid sticky wholesale inflation.


The Hidden Growth Crisis Facing Newly Independent RIAs

The champagne has gone flat. After months of planning the great breakaway, signing independence paperwork, and celebrating freedom from wirehouse constraints, newly minted registered investment advisors (RIA) owners face a sobering reality. They've traded a boss for a back-office burden that's quietly strangling their growth.
Weekly Economic Snapshot: Consumer Prices Ease as Margin Debt Hits Historic Highs

As the second half of January begins, the U.S. economy presents a picture of cooling inflation and resilient consumer activity.
WisdomTree Experts Talk Fed’s Independence, CPI, & More

Market experts from the WisdomTree recently discussed how the market is responding to the latest headlines, and where opportunities lie.
Bond King Reviews 2025, Offers Clues to 2026 in Webcast

DoubleLine CEO/CIO Jeffrey Gundlach looked back at 2025 and ahead in 2026 for opportunities, with charts to support his assertions.
JPMorgan, Delta Offer Opportunities Amid Earnings Season

JPMorgan Chase and Delta Air Lines have both posted fascinating Q4 earnings, creating compelling opportunities for crafty advisors.
Seeking Diversification as the S&P 500 Nears 7,000

As the S&P 500 continues its record-breaking ascent into early 2026, financial advisors are prioritizing diversification.
Independent Advisors Rethink Research Models for 2026

Rising operational costs & complex market conditions are forcing some advisors to reconsider how they deliver investment insights to clients.
December 2025 ETF Launches: 3 Standout Funds to Consider

The ETF ecosystem grew once more in December with more than 100 new launches joining the fray. Three funds invite a closer look.
Why Fixed Income ETFs Are Going Active

JPAPM forecasts the global fixed income ETF market to grow to $6 trillion by 2030, up from approximately $3.2 trillion today.
Top 10 Charts of 2025

Now that 2025 has come to an end, let’s take a look at the top 10 most-read charts of the year.
3 Ways to Boost New Independent Advisor Productivity in 2026

Three ways financial advisors can be more productive in the new year after starting their own independent practice.
These Income ETFs Can Meet — & Exceed — Retiree Needs

Income ETFs can help retirees and their advisors navigate complicated economic times as they strive to meet their goals.
RecessionAlert Weekly Leading Economic Index
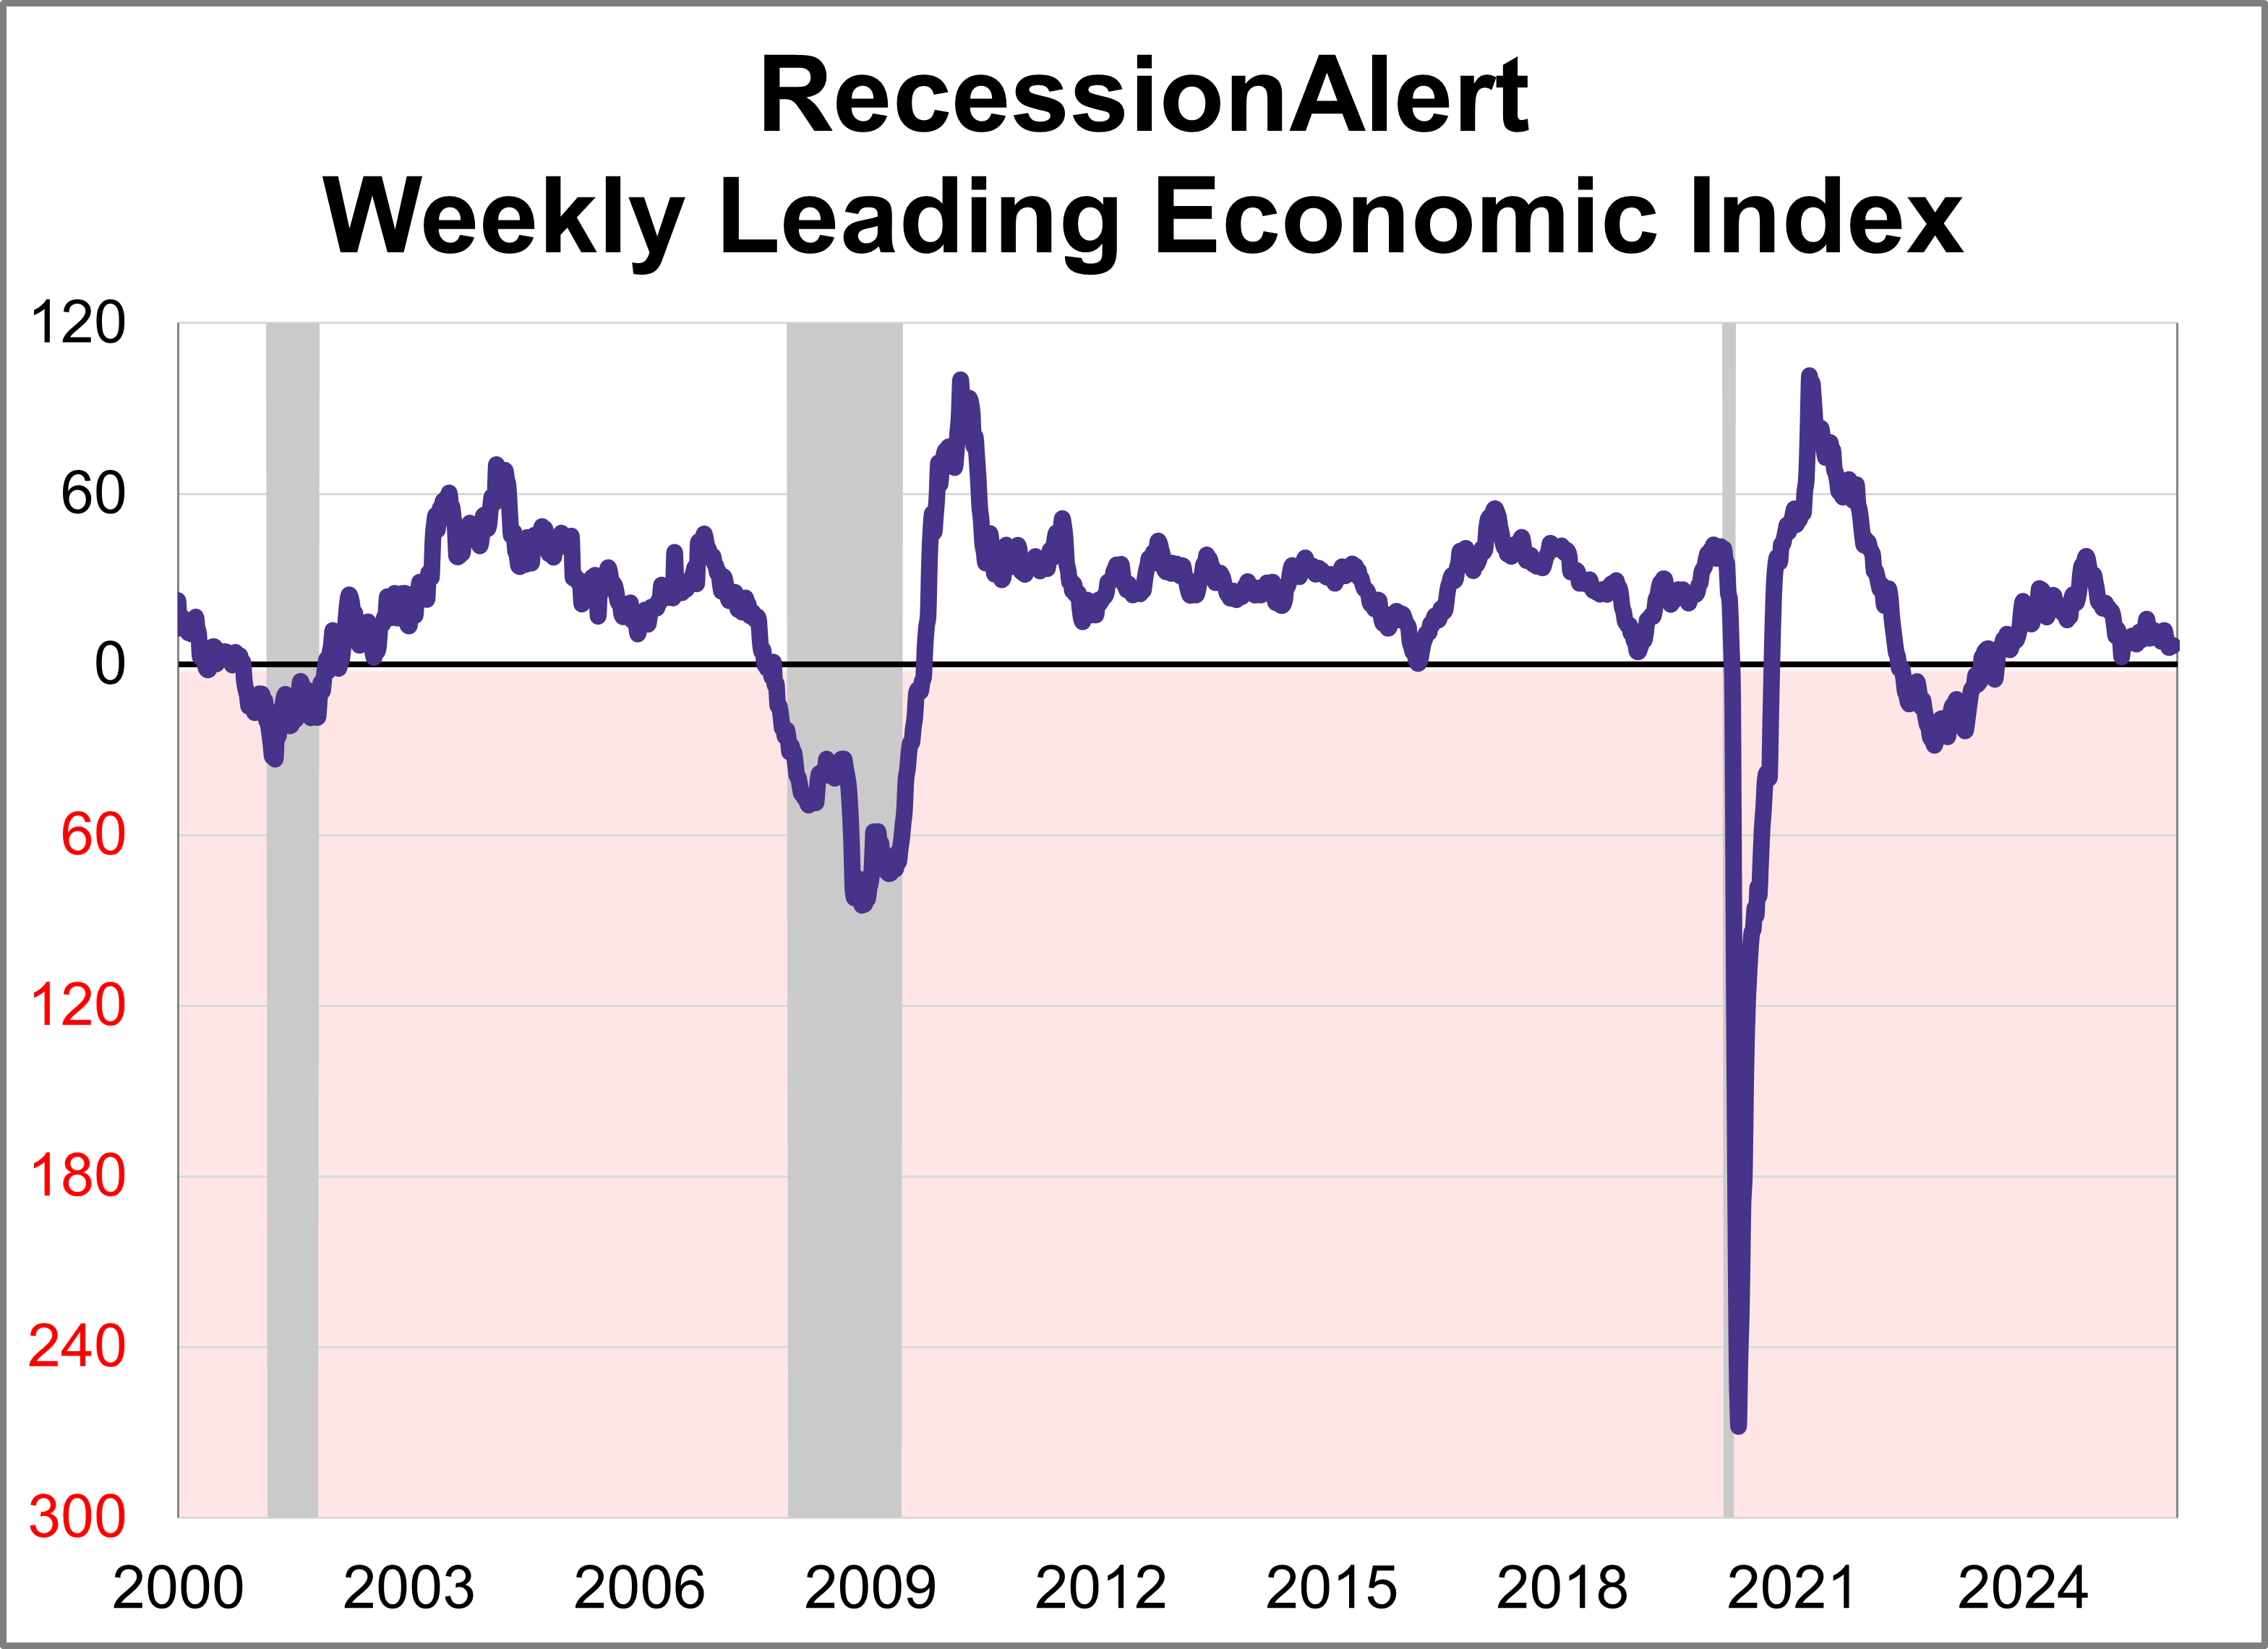
The weekly leading economic index (WLEI) is a composite for the U.S economy that draws from over 20 time-series and groups them into the following six broad categories which are then used to construct an equally weighted average. As of December 12th, the index was at 6.71 with 3 of the 6 components in expansion territory.
U.S. Workforce Recovery Analysis: November 2025
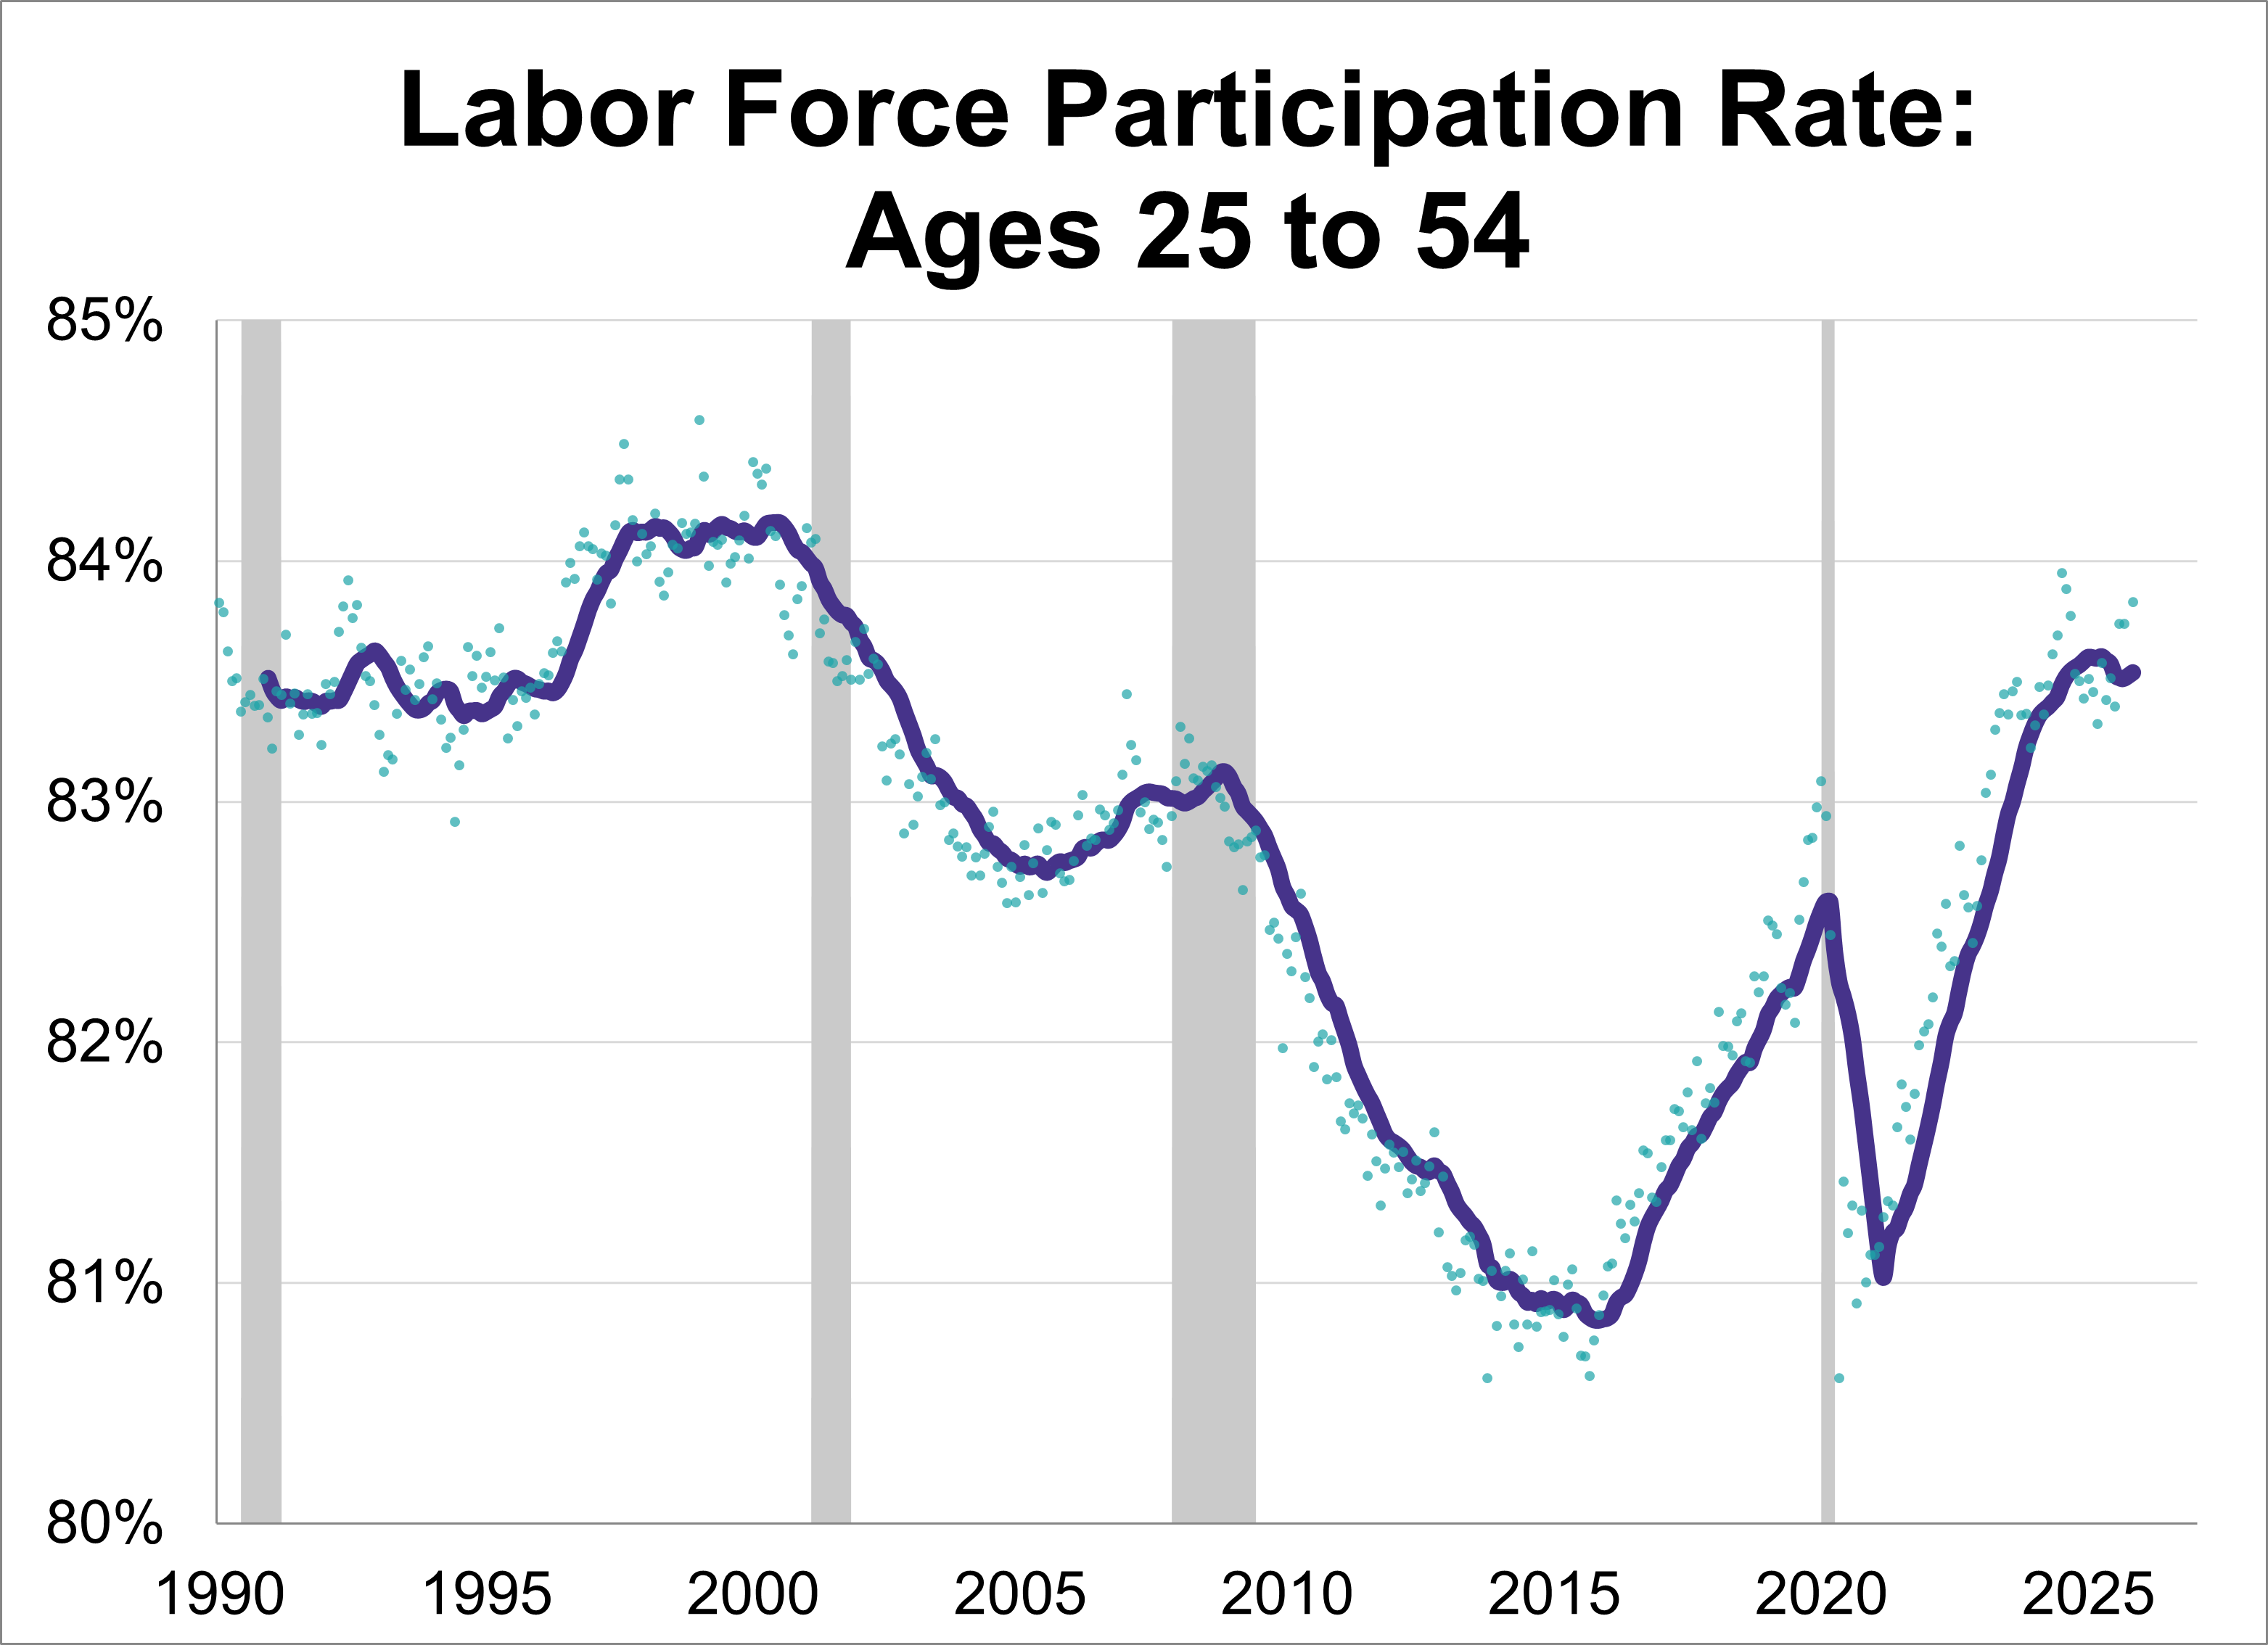
Our monthly workforce recovery analysis has been updated to include the latest employment report for November. The unemployment rate inched up to 4.6%, its highest level since 2021. Additionally, the number of new non-farm jobs (a relatively volatile number subject to extensive revisions) came in at 64,000.

Weekly Economic Snapshot: Softening Labor Market and Cooling Inflation

The economic narrative last week was dominated by a mix of cooling inflation and a softening labor market.
Baby Boomer Employment Through the Decades: September 2025
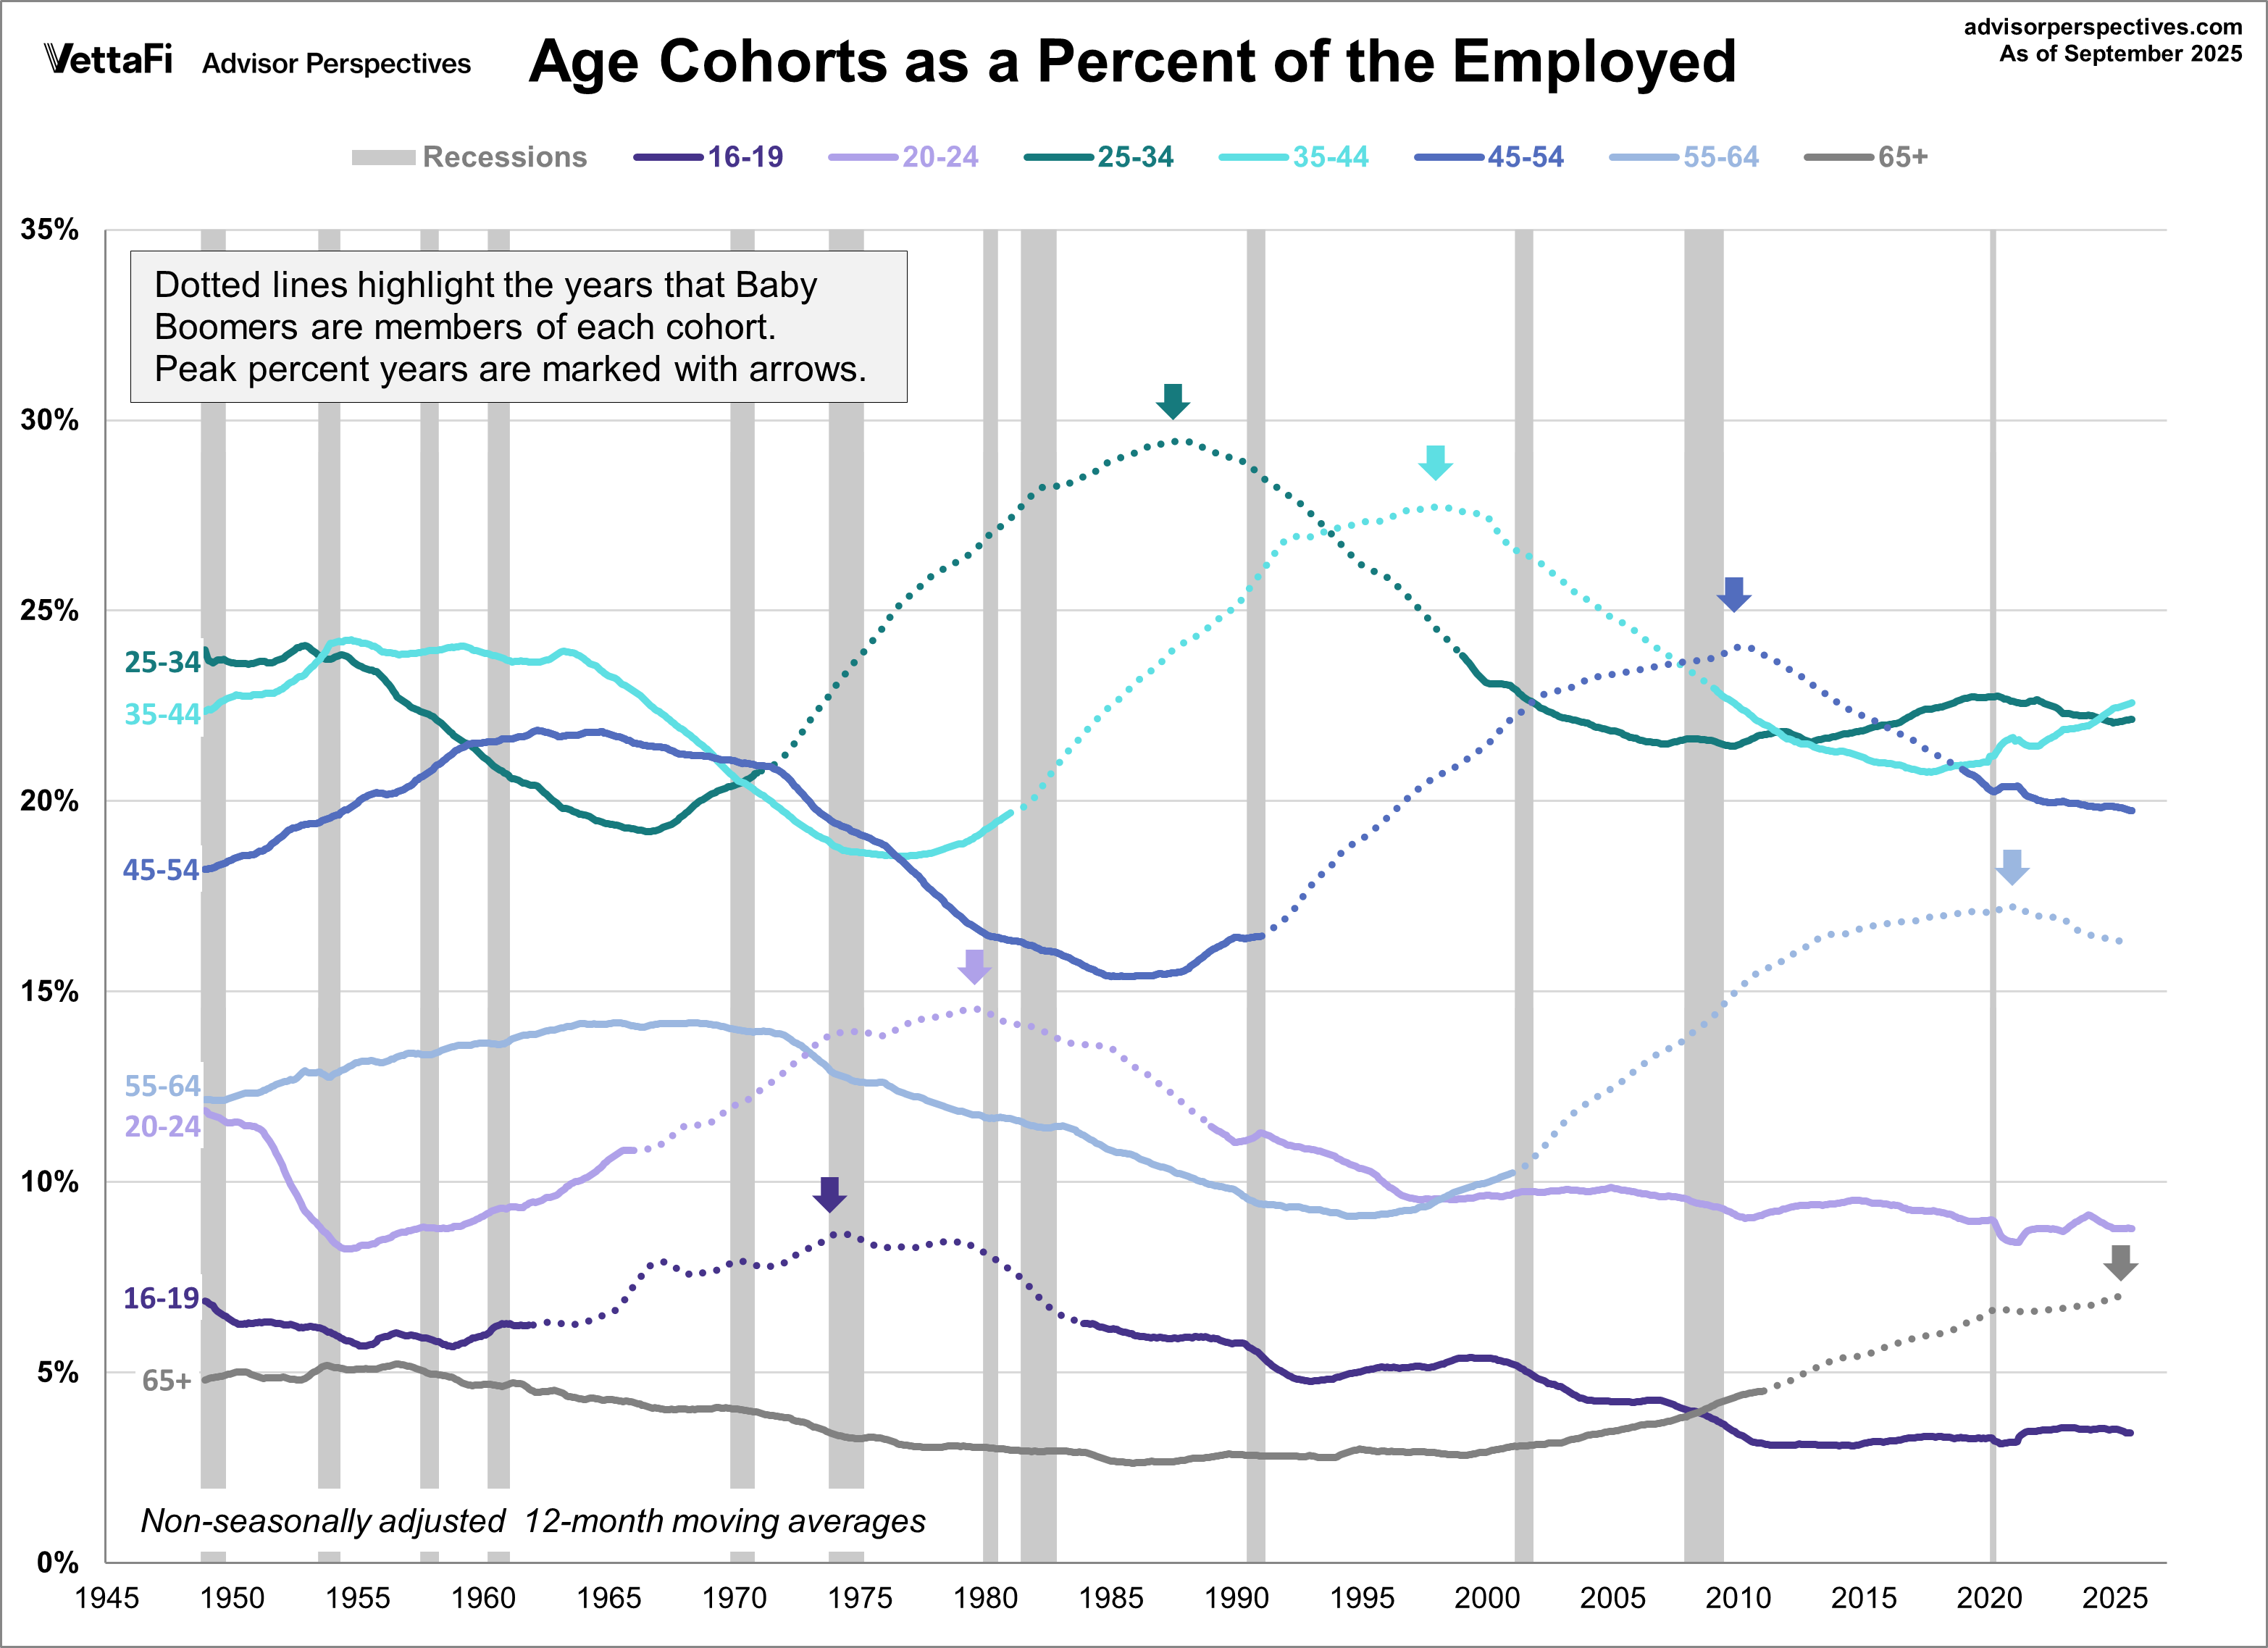
The 20th century Baby Boom was one of the most powerful demographic events in the history of the United States. We've created a series of charts to show seven age cohorts of the employed population from 1948 to the present.
Employment Trends for the 50+ Workforce: September 2025
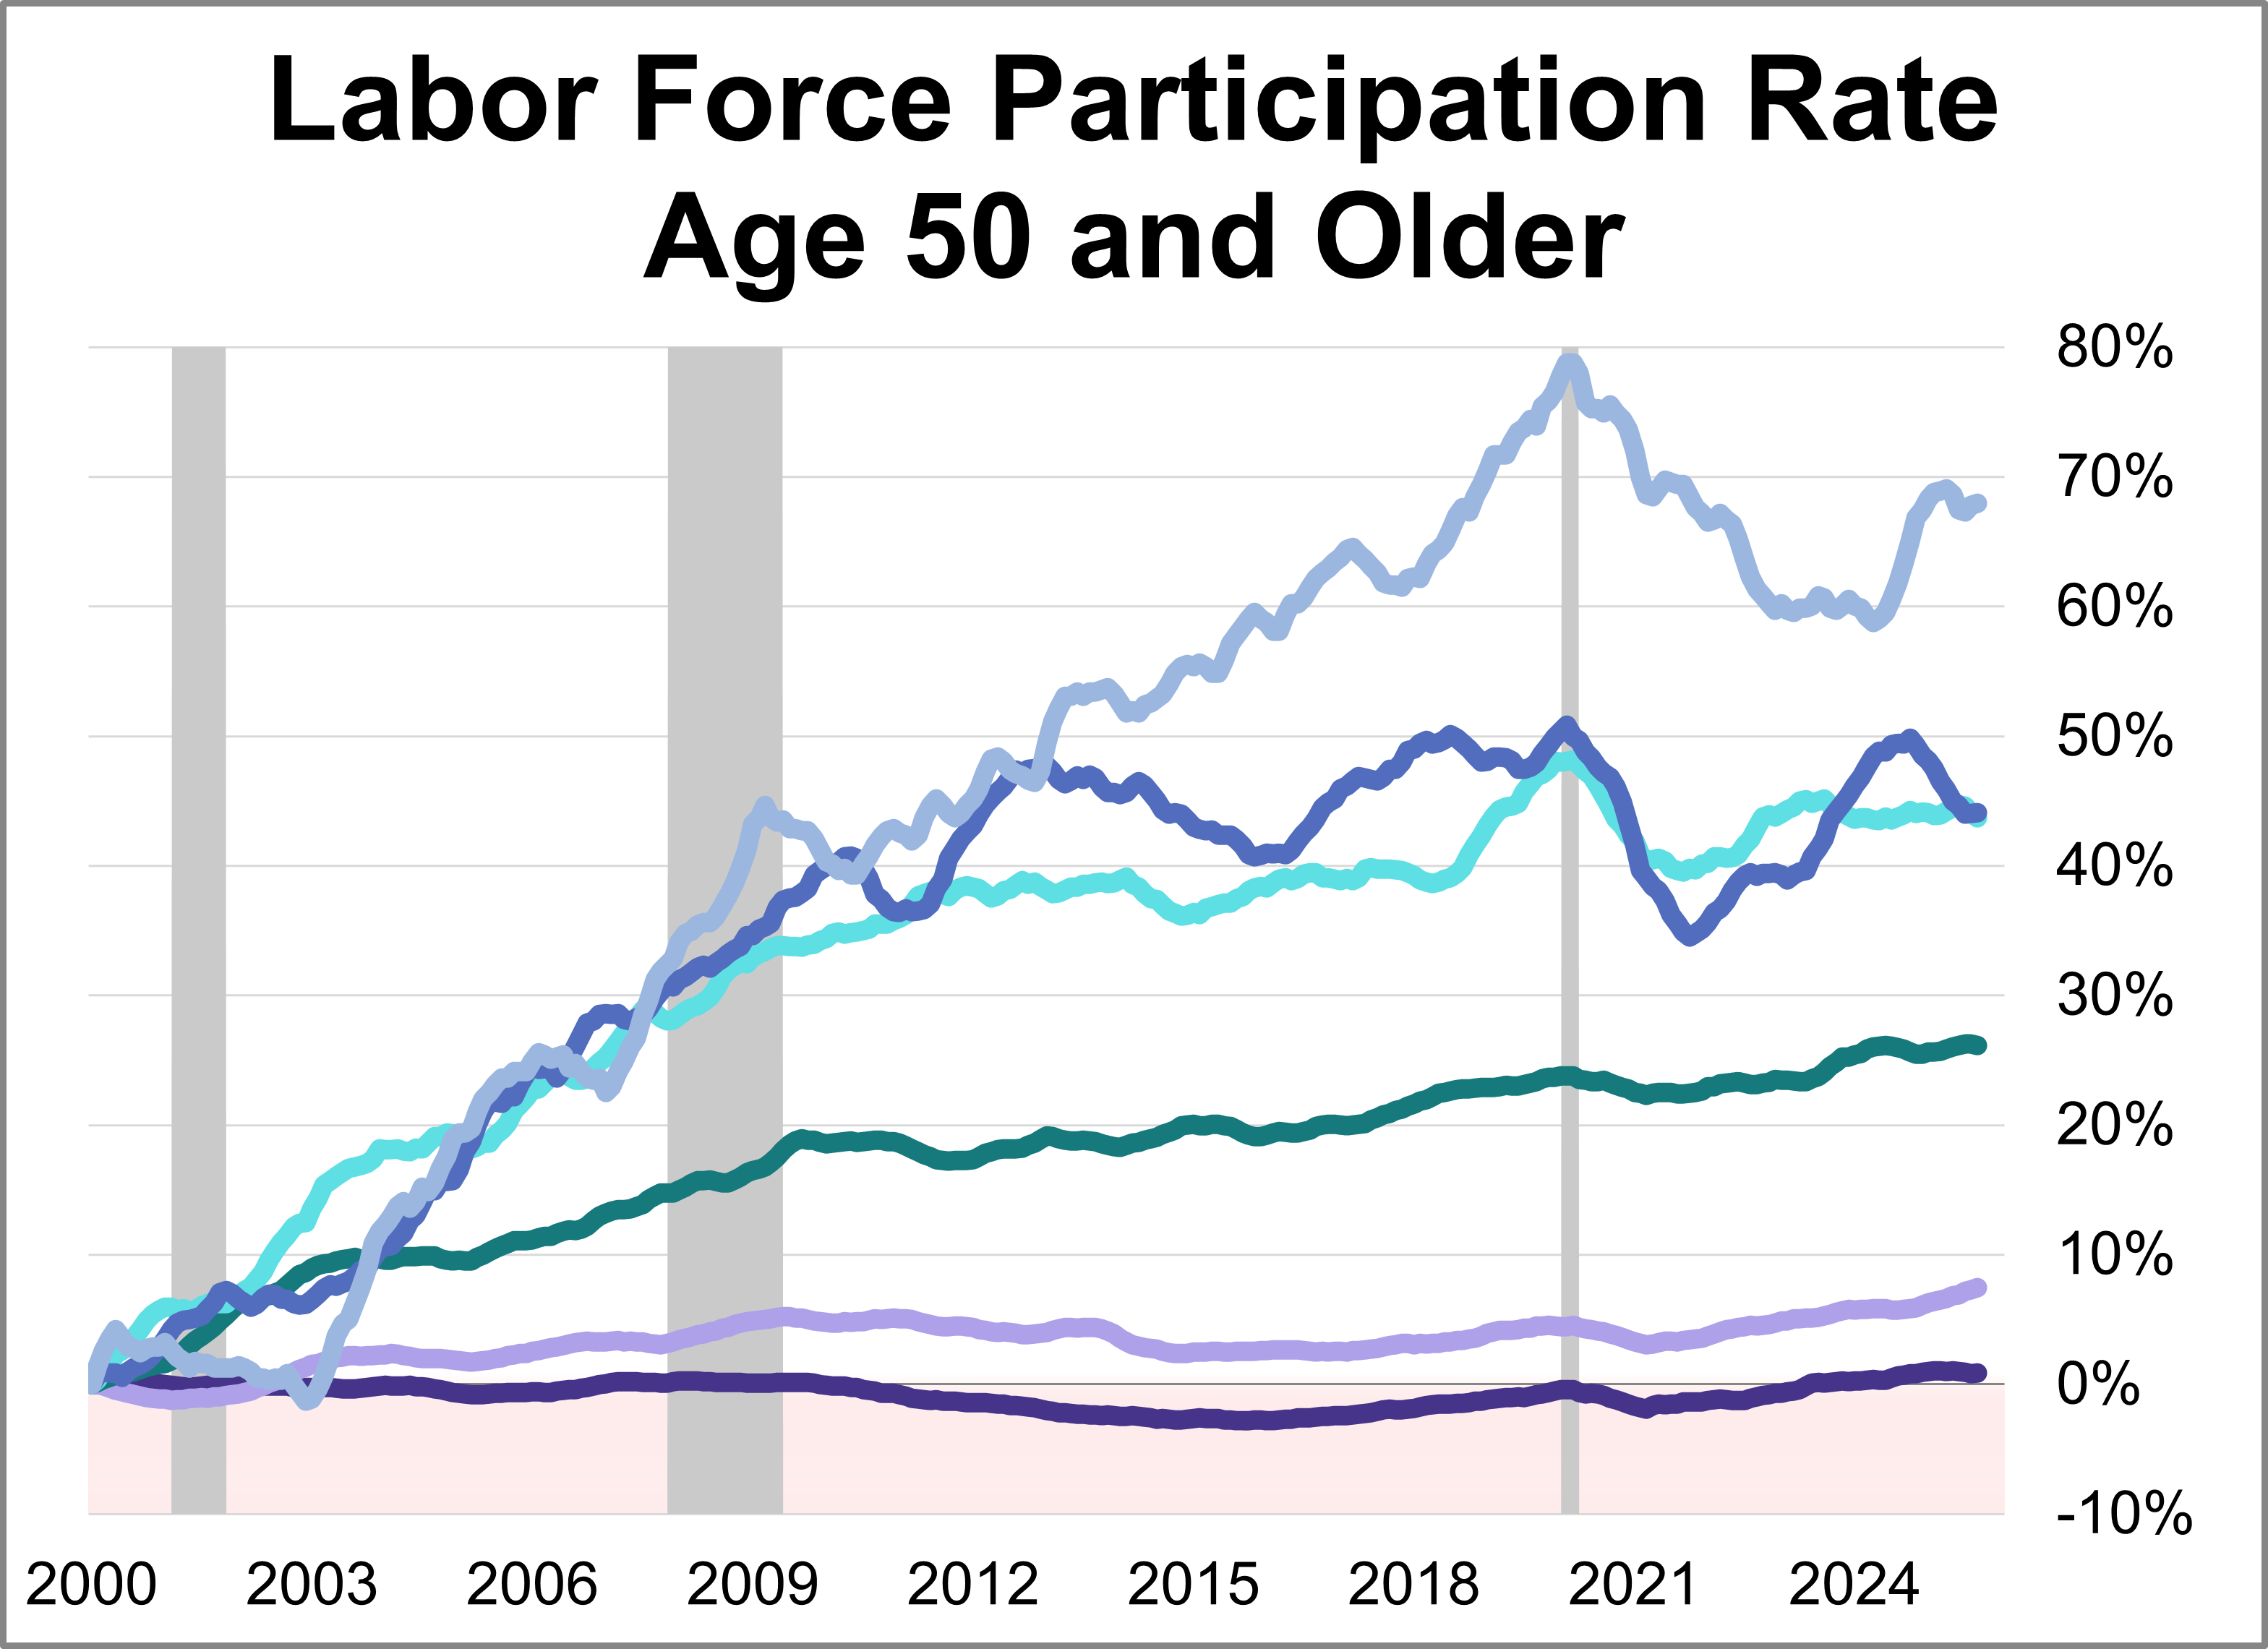
Today, one in three of the 65-69 cohort, one in five of the 70-74 cohort, and one in ten of the 75+ cohort are in the labor force.
Long-Term Employment Trends by Age and Gender: September 2025
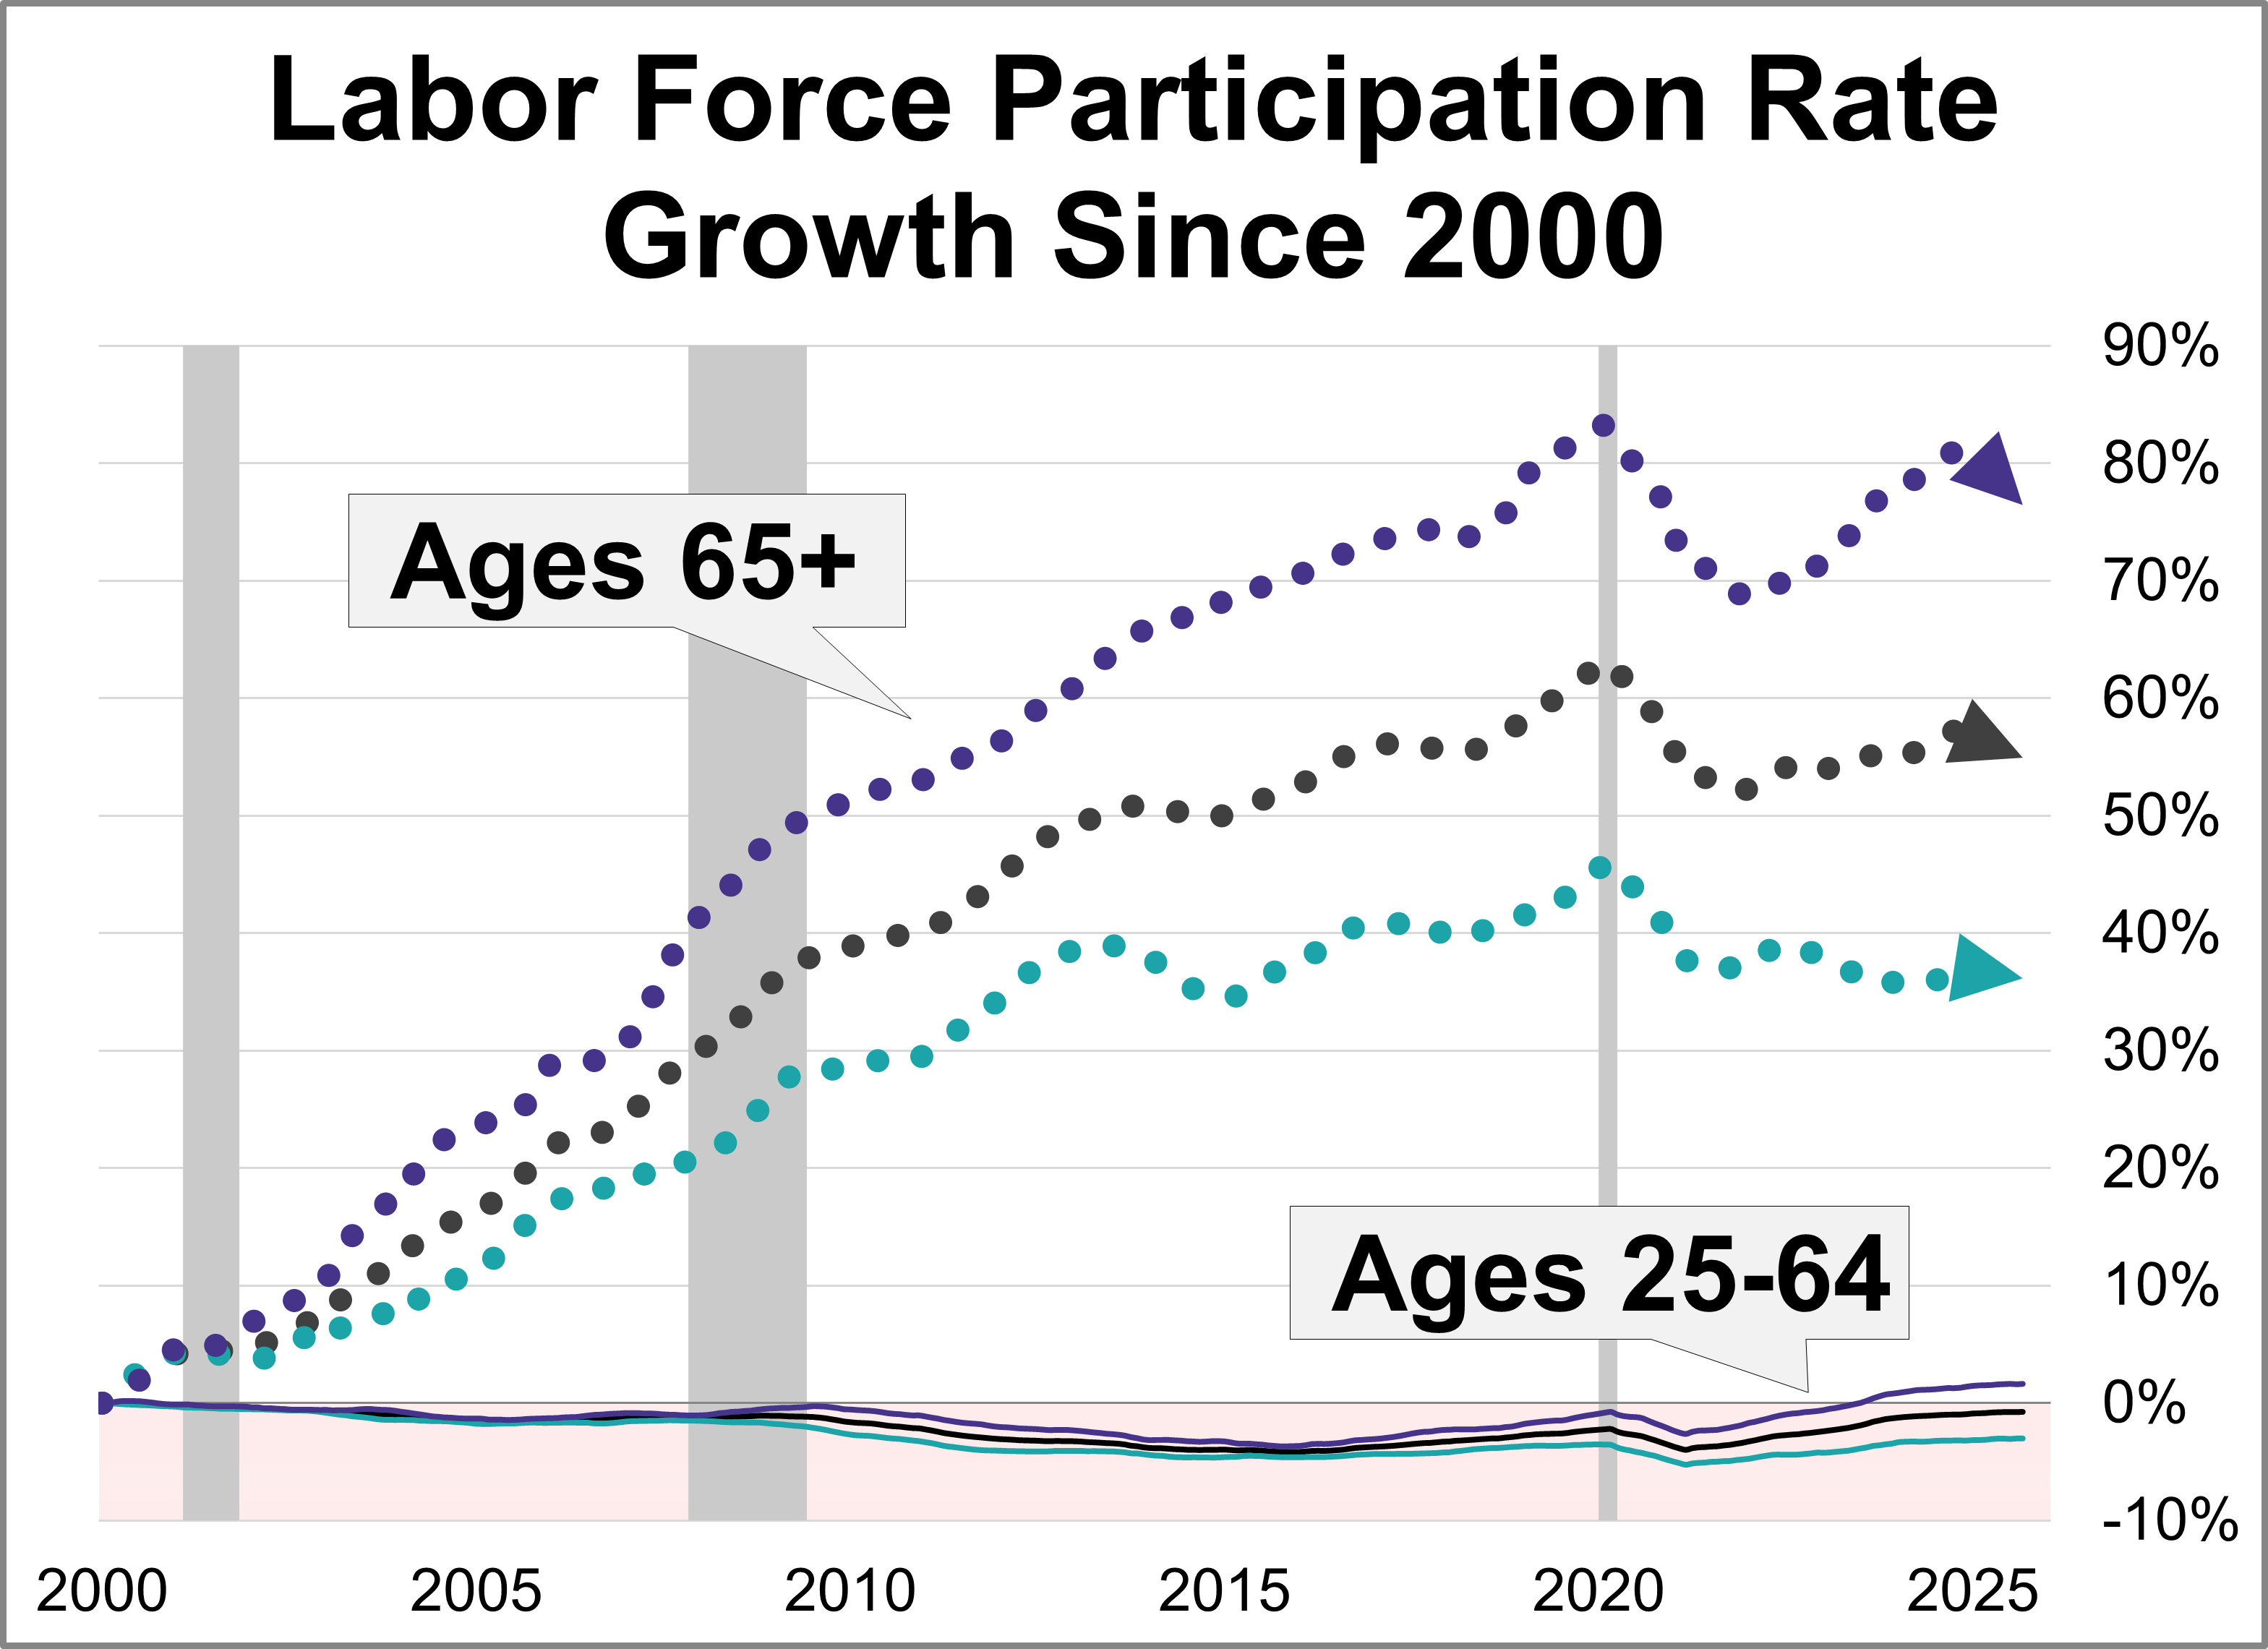
The labor force participation rate (LFPR) is a simple computation: You take the civilian labor force (people aged 16 and over employed or seeking employment) and divide it by the civilian non-institutional population (those 16 and over not in the military and or committed to an institution). As of September, the labor force participation rate is at 62.4%, up from 62.3% the previous month.
Weekly Economic Snapshot: Record Investor Risk and Near-Historic Sentiment Lows

Last week's economic landscape was defined by conflicting signals from key indicators, suggesting a growing divergence between investor behavior and underlying consumer health.
The Four Economic Reports We’re Excited to See

Now that government workers are back in the office, the data flood is coming. Here are the four reports we’re most excited for, why they matter, and what we last heard from them.
Chart-ing the Economy: Week of November 3rd - 7th

Last week’s economic data sent mixed signals. Consumer sentiment plummeted to a near-record low on economic anxiety, and the manufacturing sector continued its long contraction.
Weekly Economic Snapshot: Sour Sentiment, Conflicting Sectors, and Modest Job Growth

Last week’s economic data sent mixed signals. Consumer sentiment plummeted to a near-record low on economic anxiety, and the manufacturing sector continued its long contraction.
Weekly Economic Snapshot: Policy Decisions and Market Divergence

Last week’s economic narrative centered around the Federal Reserve's latest rate cut, a decision complicated by the government shutdown and lack of economic data.
Weekly Economic Snapshot: Inflation Cools Yet Consumer Sentiment Stumbles

While the ongoing government shutdown continues to delay the release of many reports, a key piece of economic data managed to break through last week.
Chart-ing the Economy: Week of October 13th - 18th

Secondary economic indicators have taken on heightened importance amid the ongoing government shutdown. Read through a handful of these secondary reports from the week of October 13th-18th.
Weekly Economic Snapshot: Navigating the Data Void with Secondary Reports

In a week marked by renewed S&P 500 volatility stemming from reignited tariff talks and the ongoing challenge of a government shutdown that continues to delay crucial government reports, investors and analysts have increasingly turned to secondary economic indicators for a timely view of the U.S. economy.
Weekly Economic Snapshot: Flying Blind as Private Data Points to Cooling Labor Market

In the absence of primary government indicators, policymakers and investors alike must turn to private sector releases to find clarity. These secondary reports paint a picture of a cooling labor market and an increasingly cautious consumer.
Weekly Economic Snapshot: Strong Economy but Worried Consumers

Last week’s economic data presented a sharp contradiction between a resilient U.S. economy and increasingly concerned American households.
Household Incomes: The Decline of the "Middle Class" 2024 Update
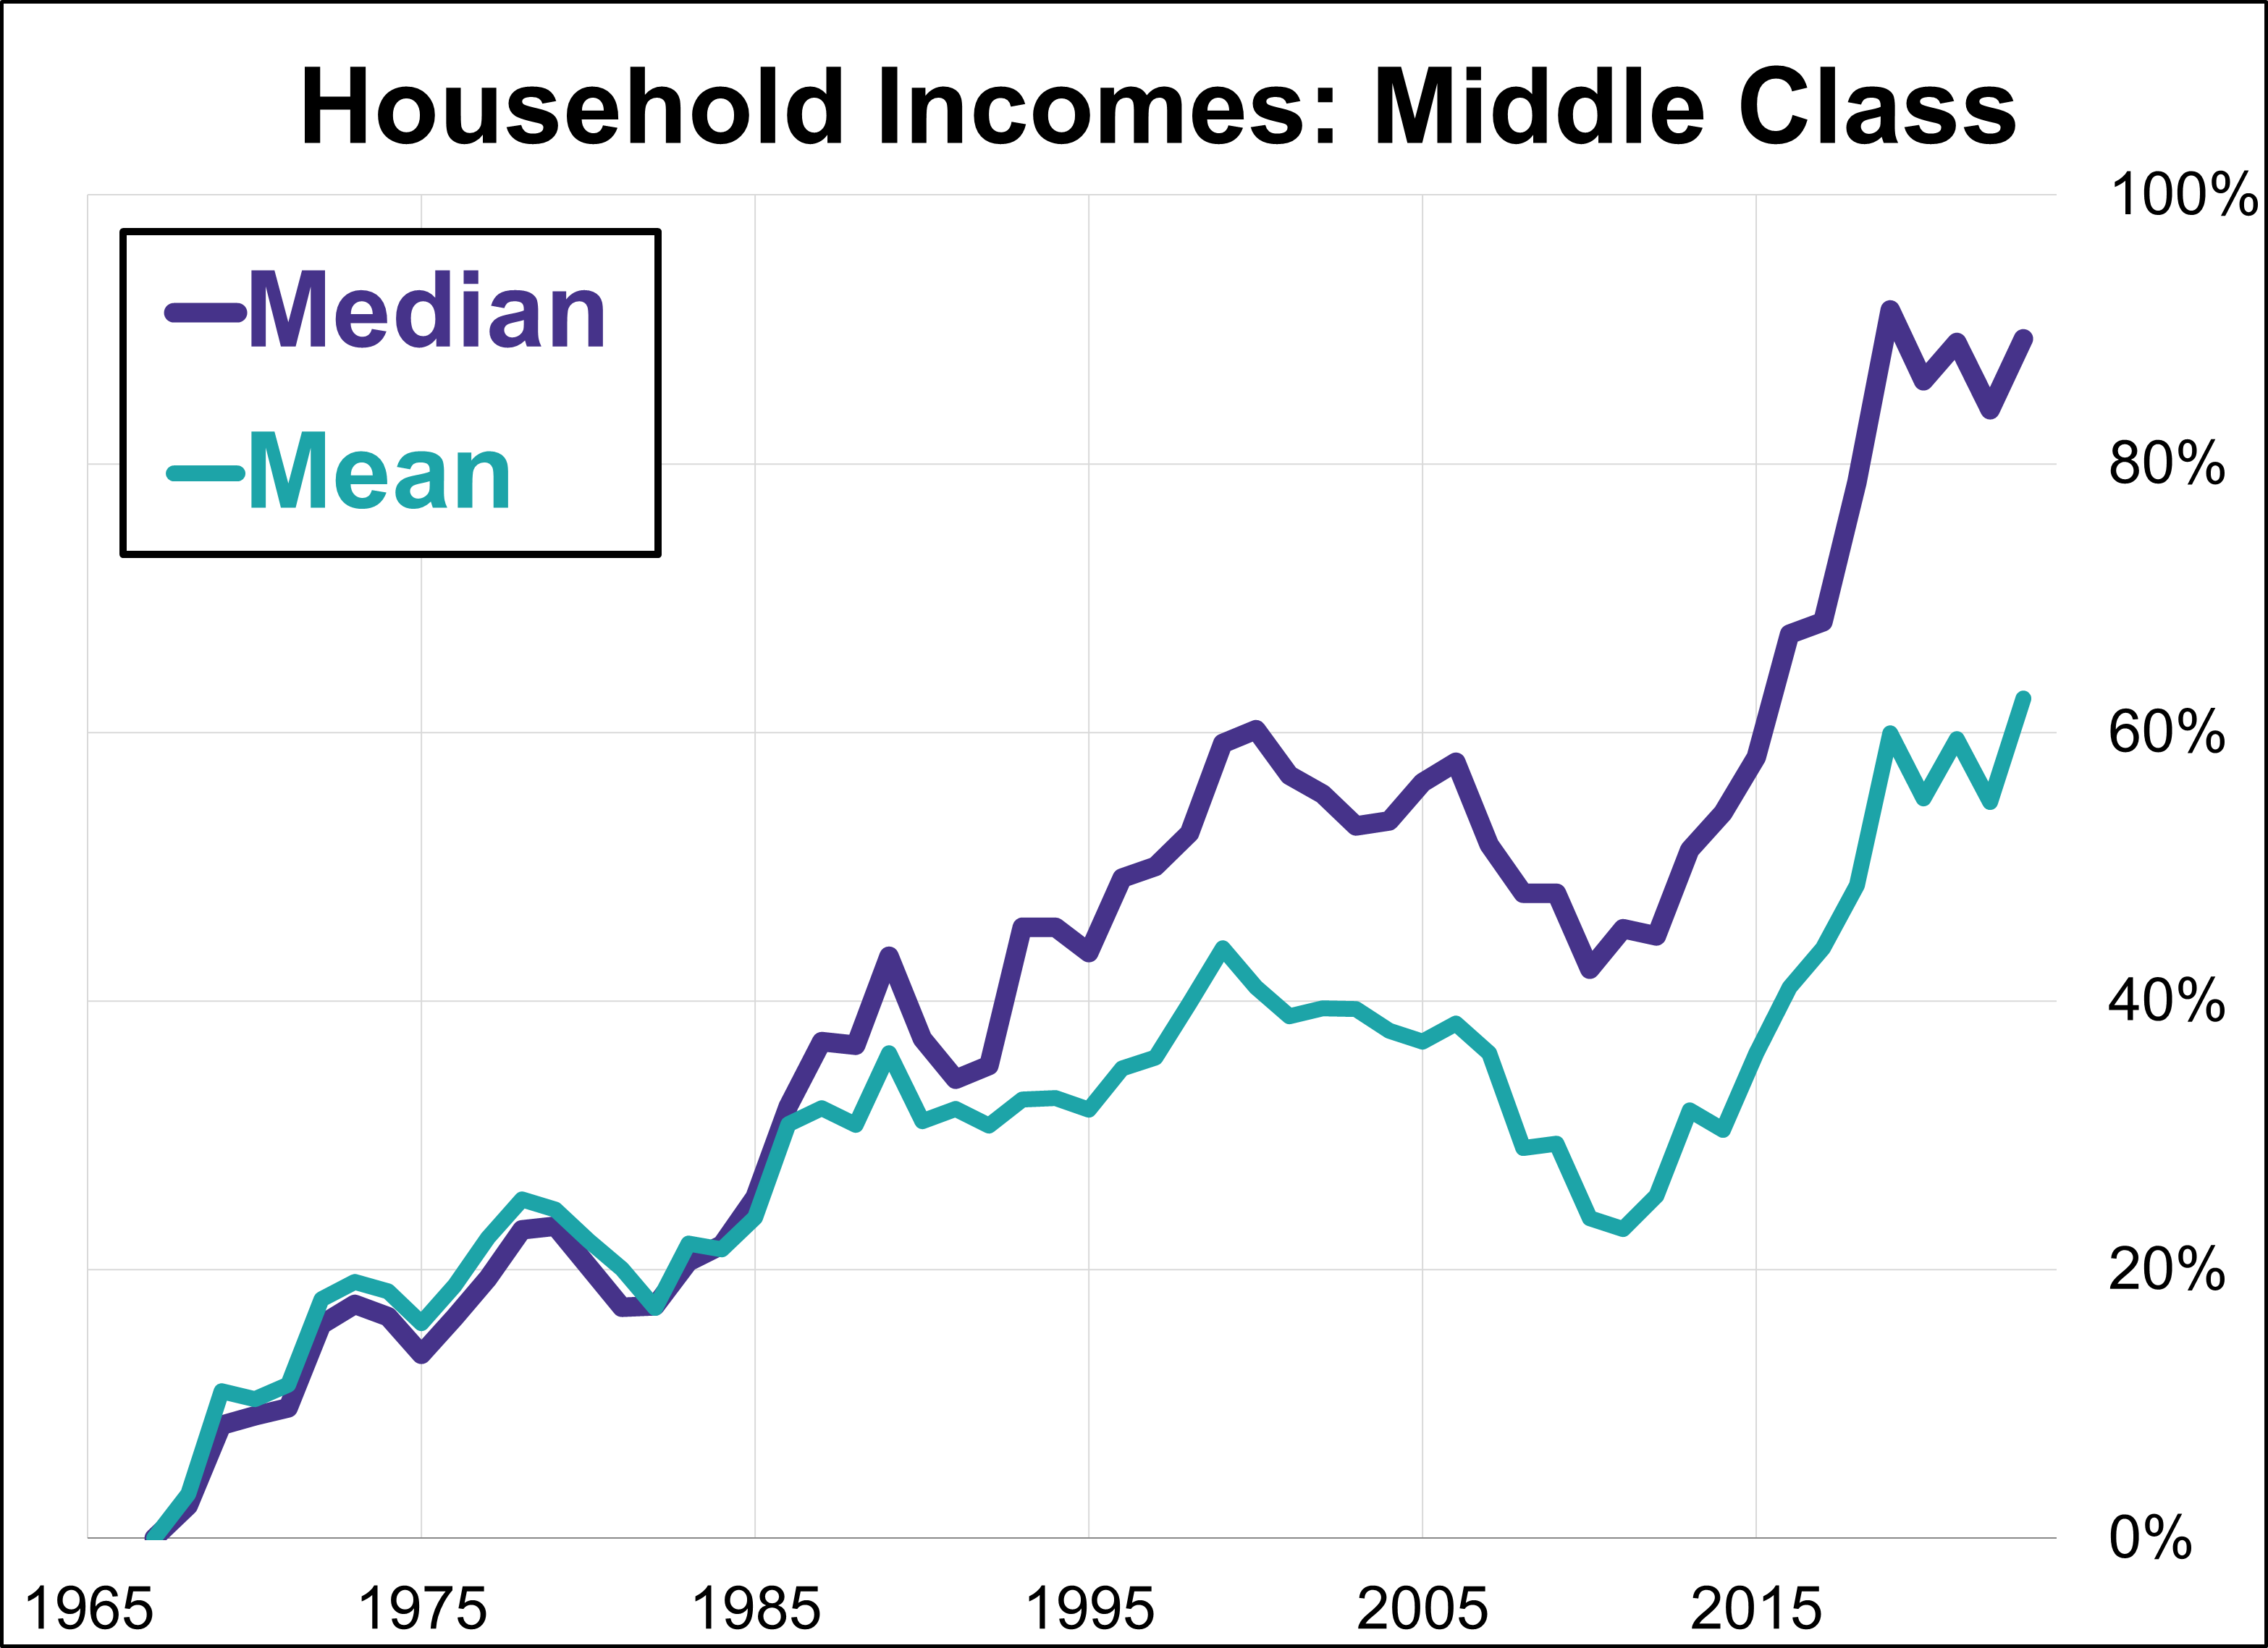
The median household is the statistical center of the Middle Class. Let's take a closer look at the Census Bureau's latest annual household income data with a focus on middle class income. In this update, we'll focus on the growing gap between the median (middle) and mean (average) household incomes across the complete time frame of the Census Bureau's annual reporting from 1867 to 2024.
Household Incomes 2024: The Value of Higher Education
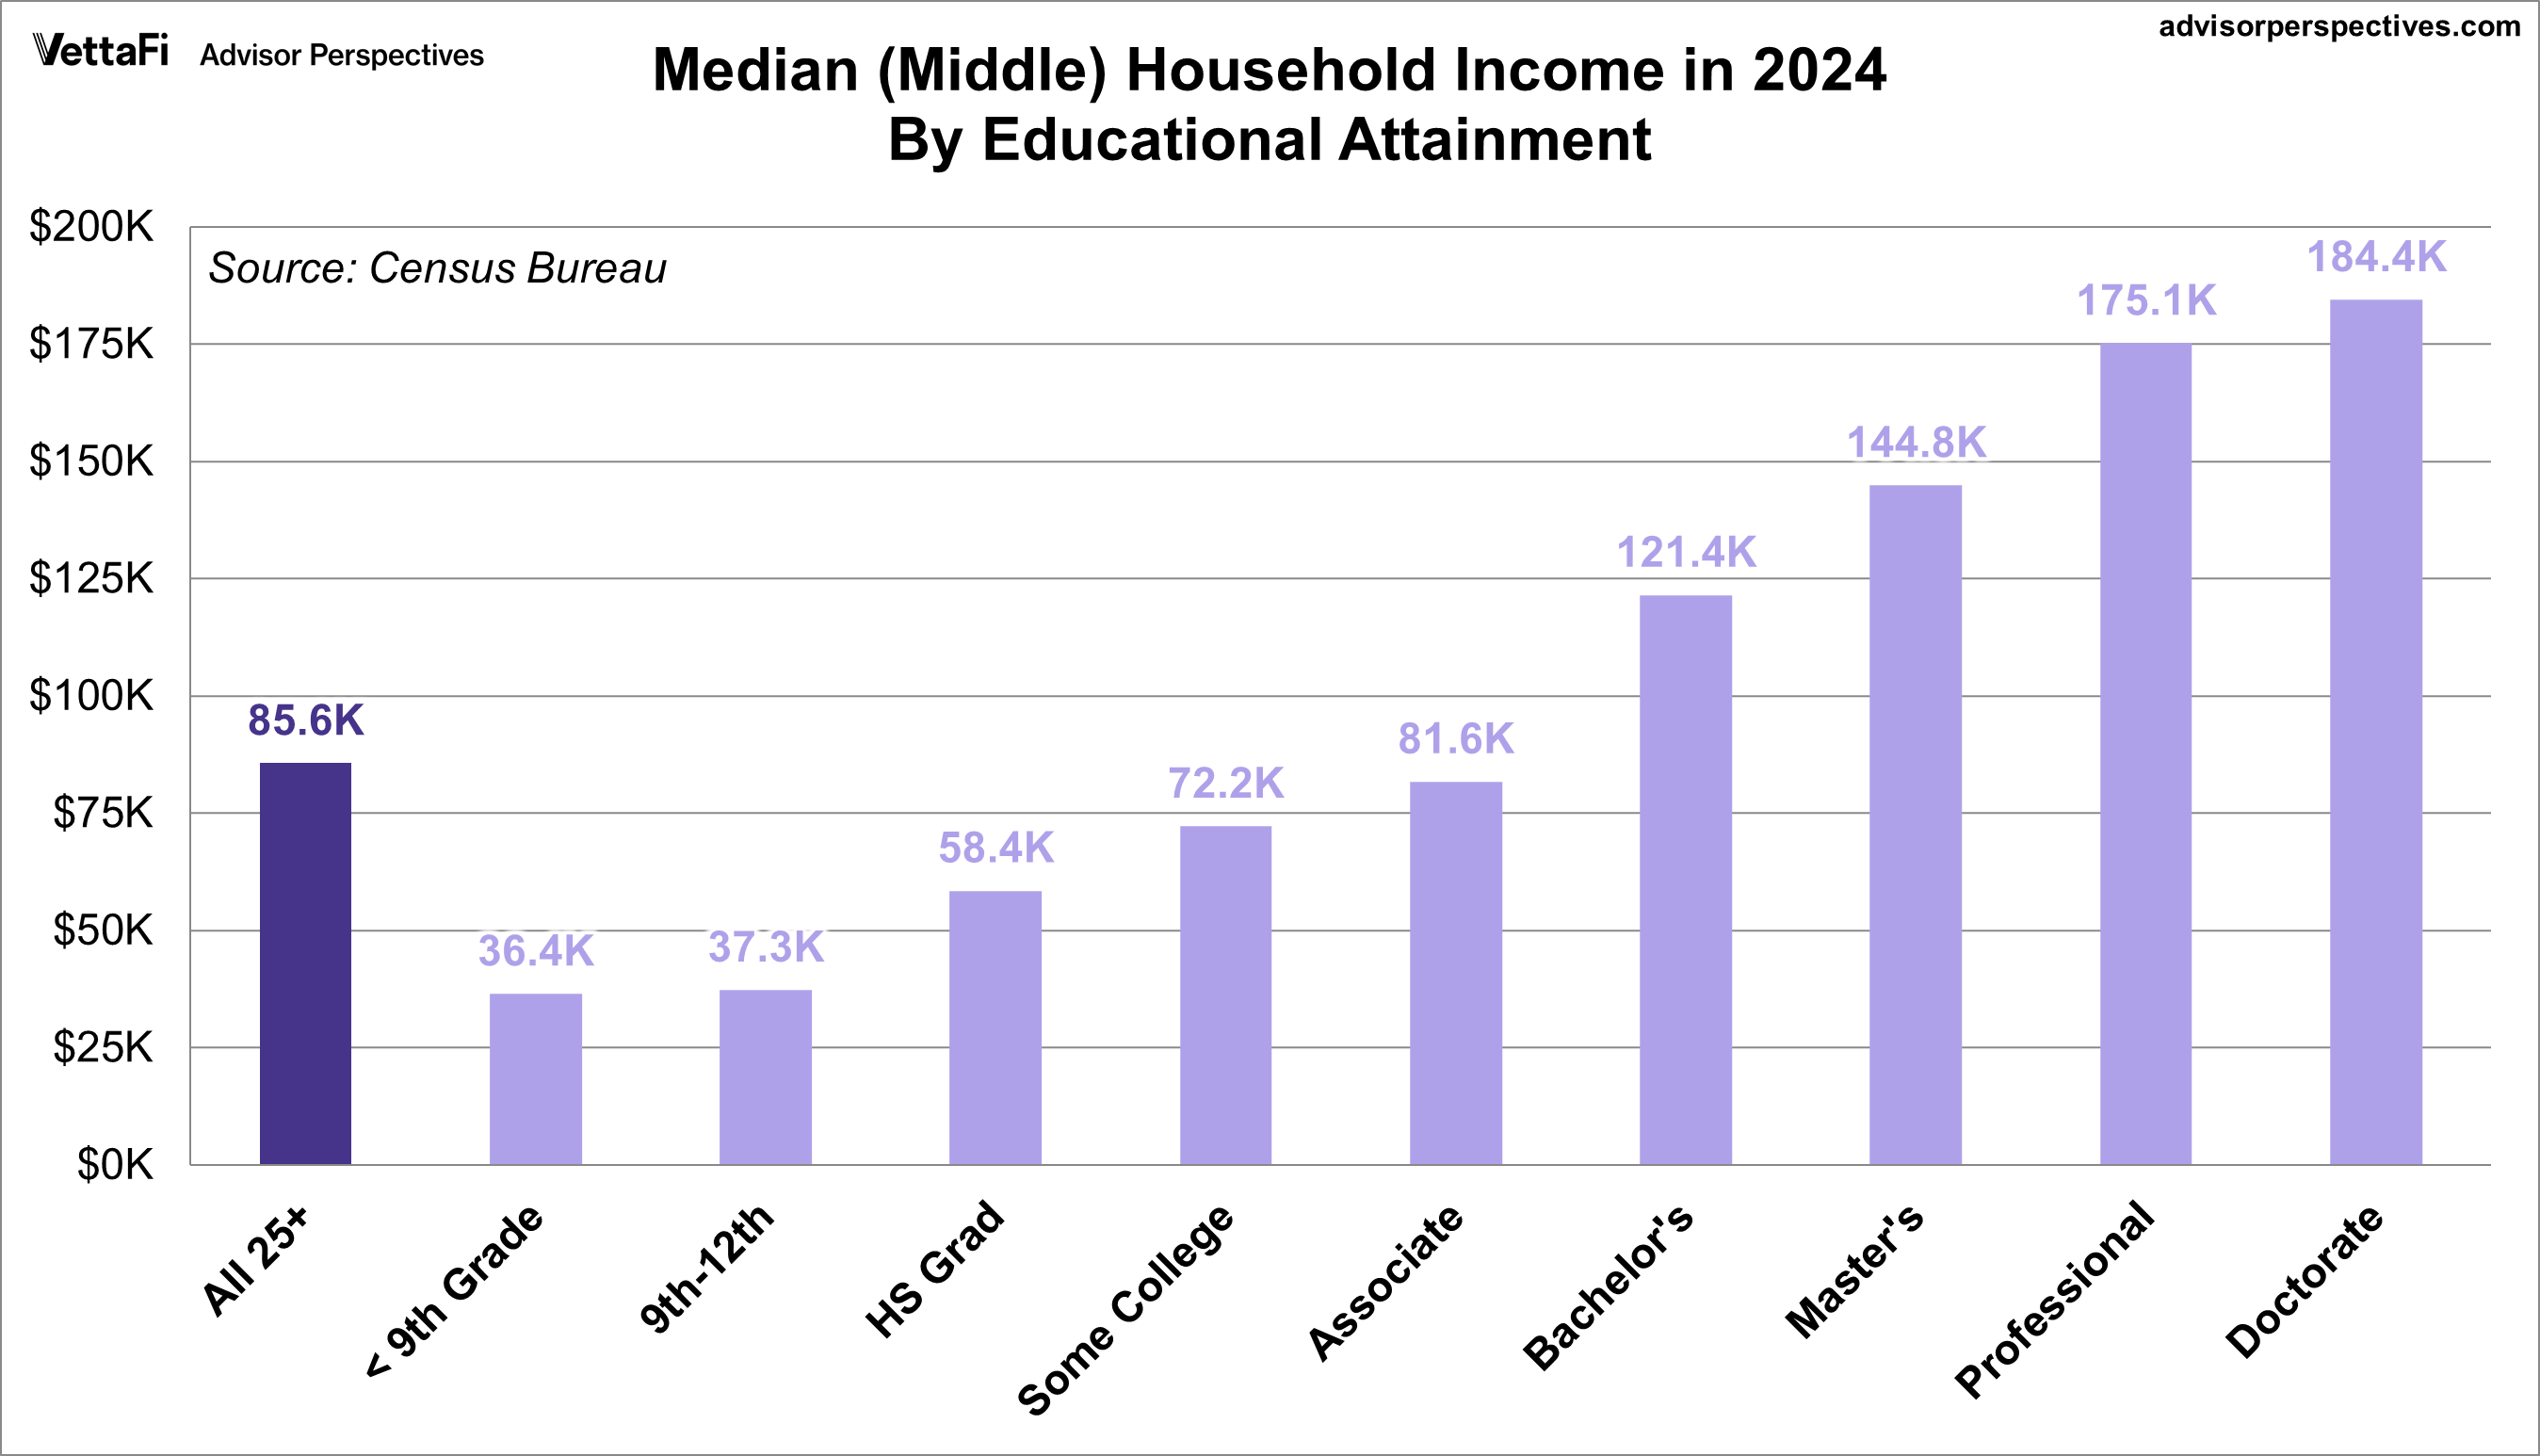
What is the relationship between education and household income? The Census Bureau’s 2024 annual survey data provides valuable insights into this question. The median household income for individuals aged 25 and older was $85,580, but how does this figure vary based on educational attainment?
Chart-ing the Economy: Week of September 8th - 12th

Last week's economic data presented a challenging picture for the U.S. economy with key inflation reports delivering conflicting signals and a timely labor market indicator added to the narrative of a softening labor market. Read through the major economic news from the week of September 8th - 12th.
Median Household Income by State: 2024 Update
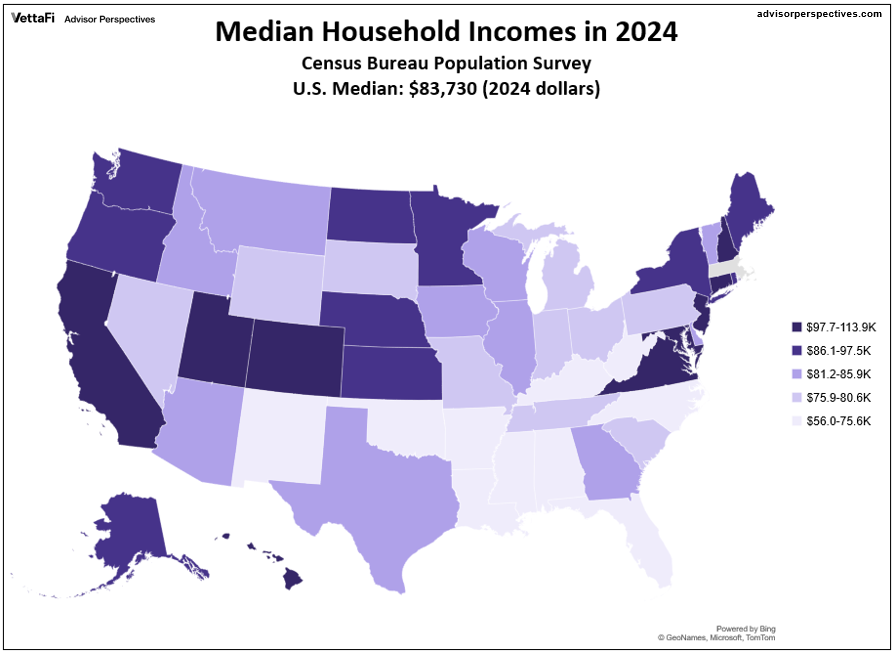
The median US income in 2024 was $83,730, up from $22,420 in 1984 — a 274% rise over the 40-year time frame. However, if we adjust for inflation chained in 2024 dollars, the 1984 median is $60.420 and the increase drops to 39%.
Median Household Incomes by Age Bracket: 1967-2024
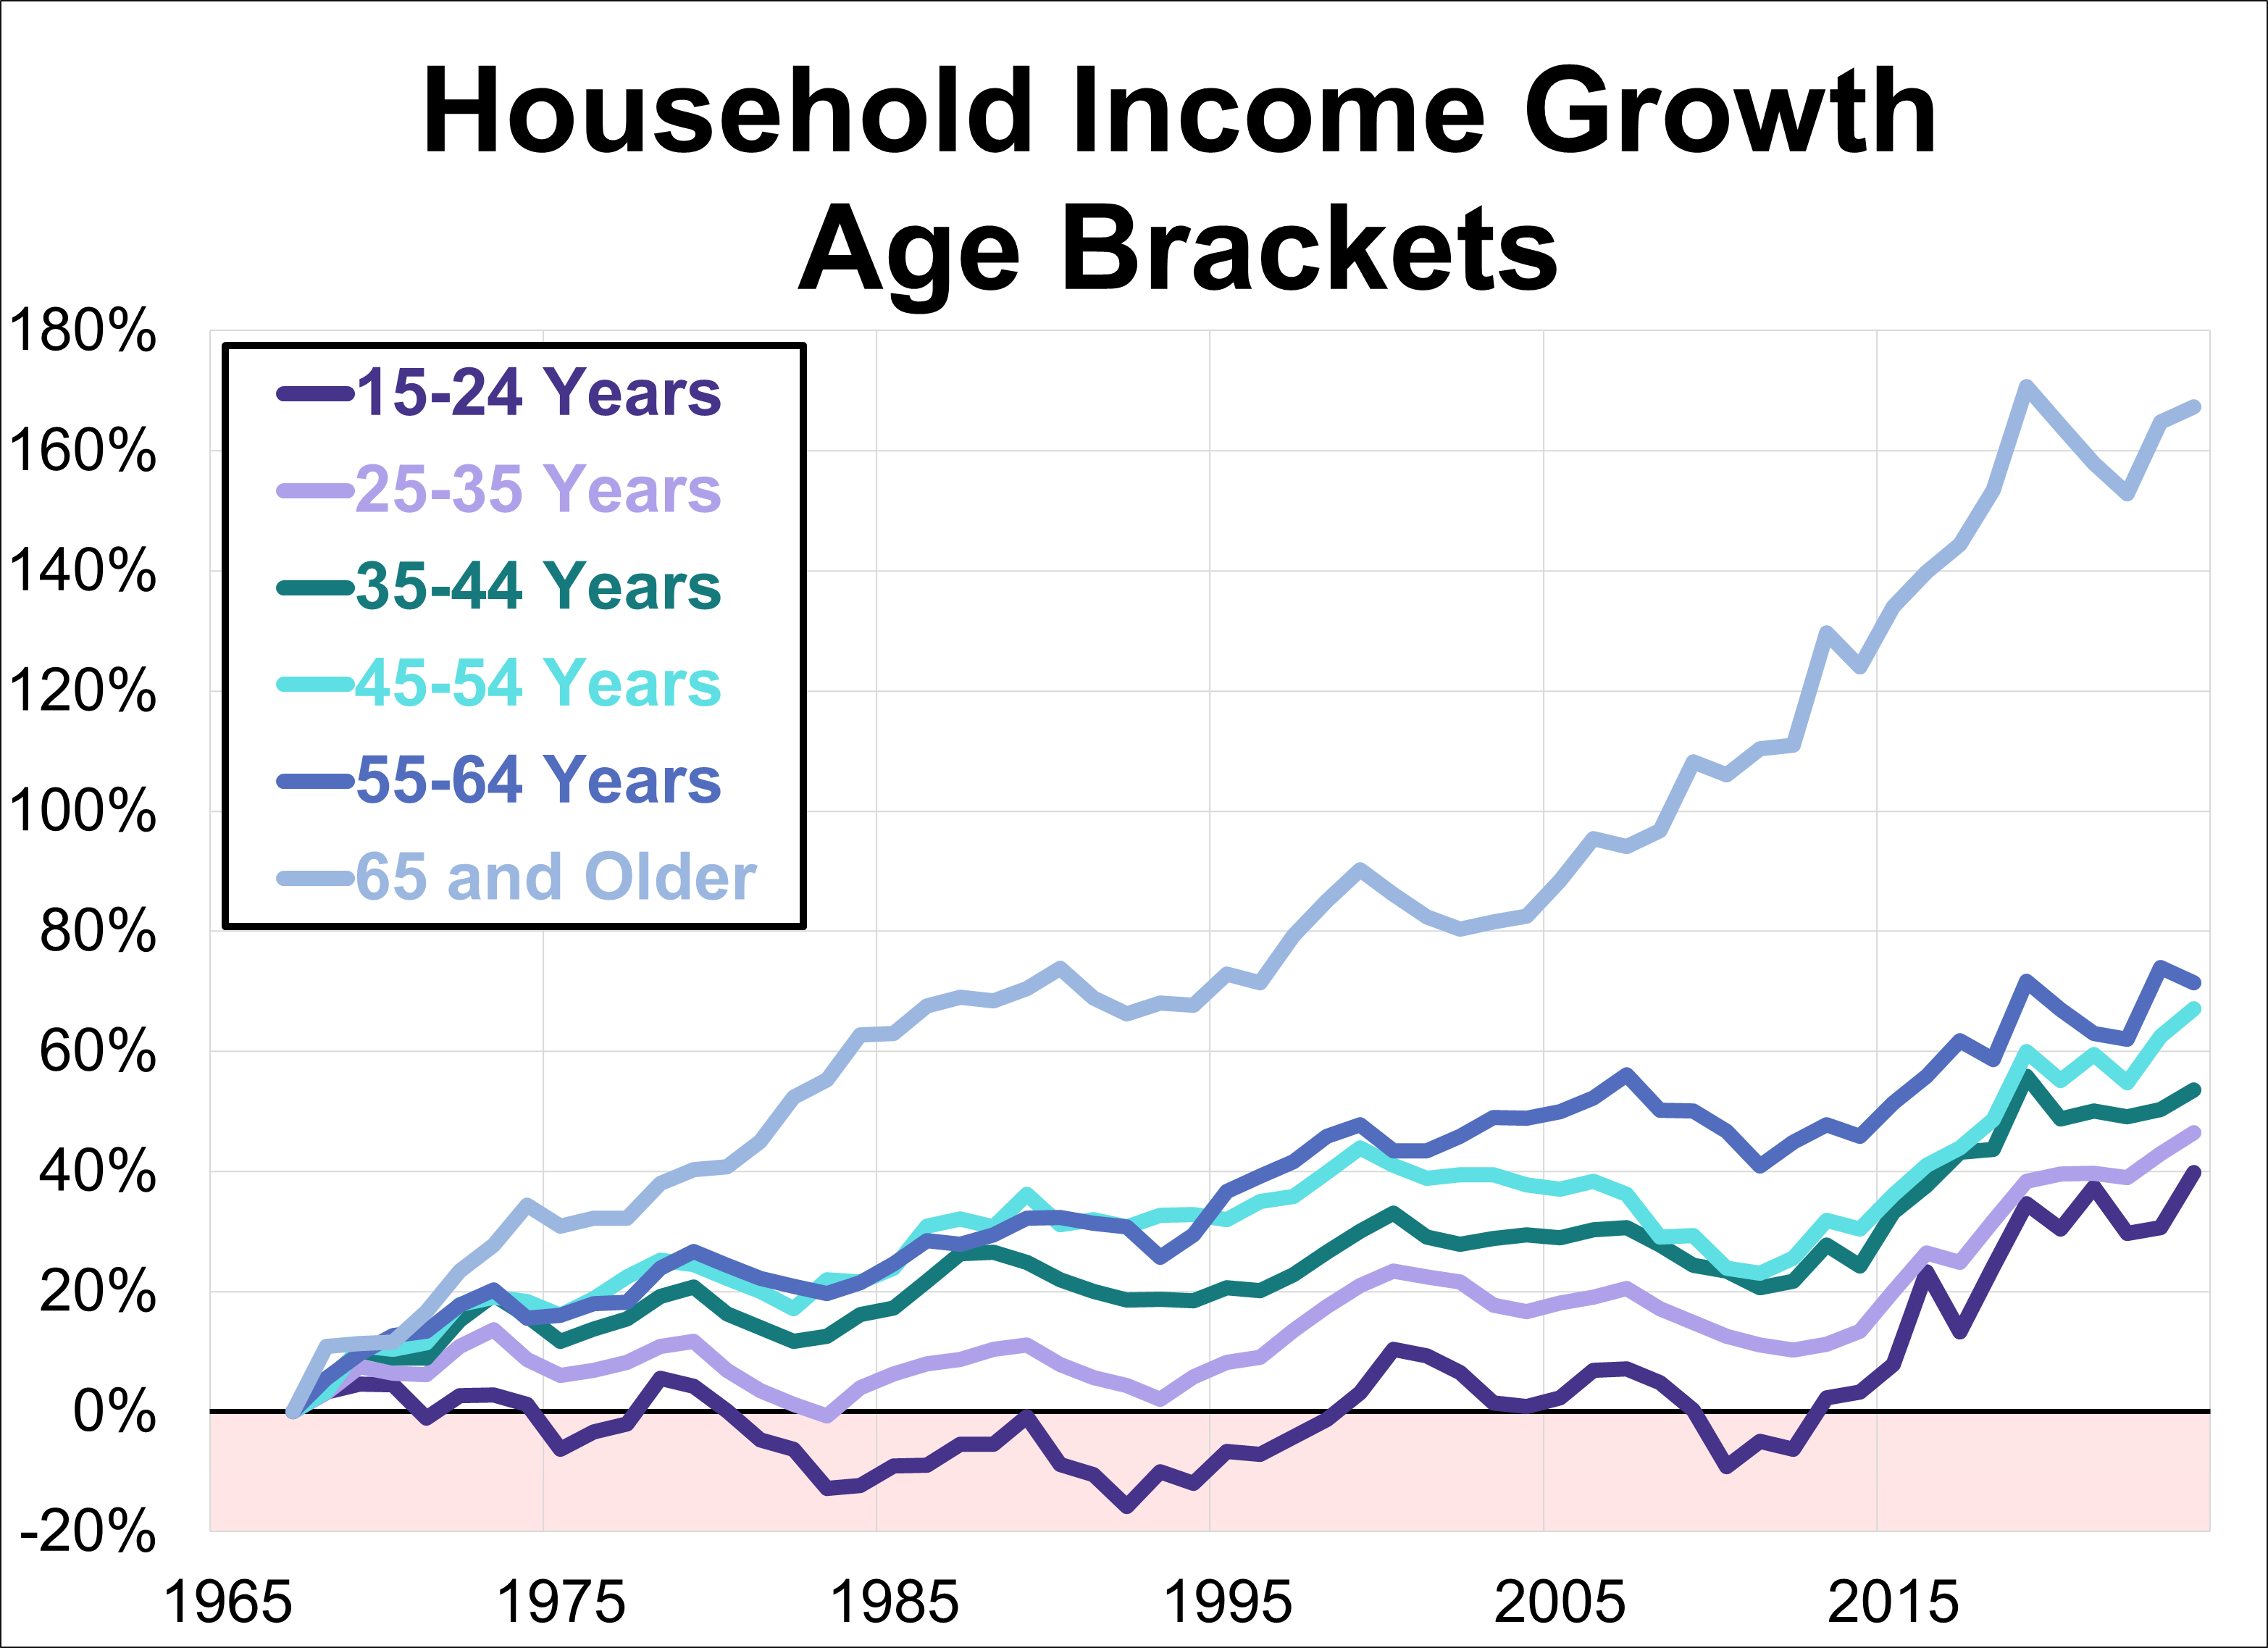
Our commentary on household income distribution offers some fascinating insights into average U.S. household incomes, but misses the implications of age for income. In this update, we examine household income with a focus on age bracket.
U.S. Household Incomes Over 50+ Years: The Great Divide
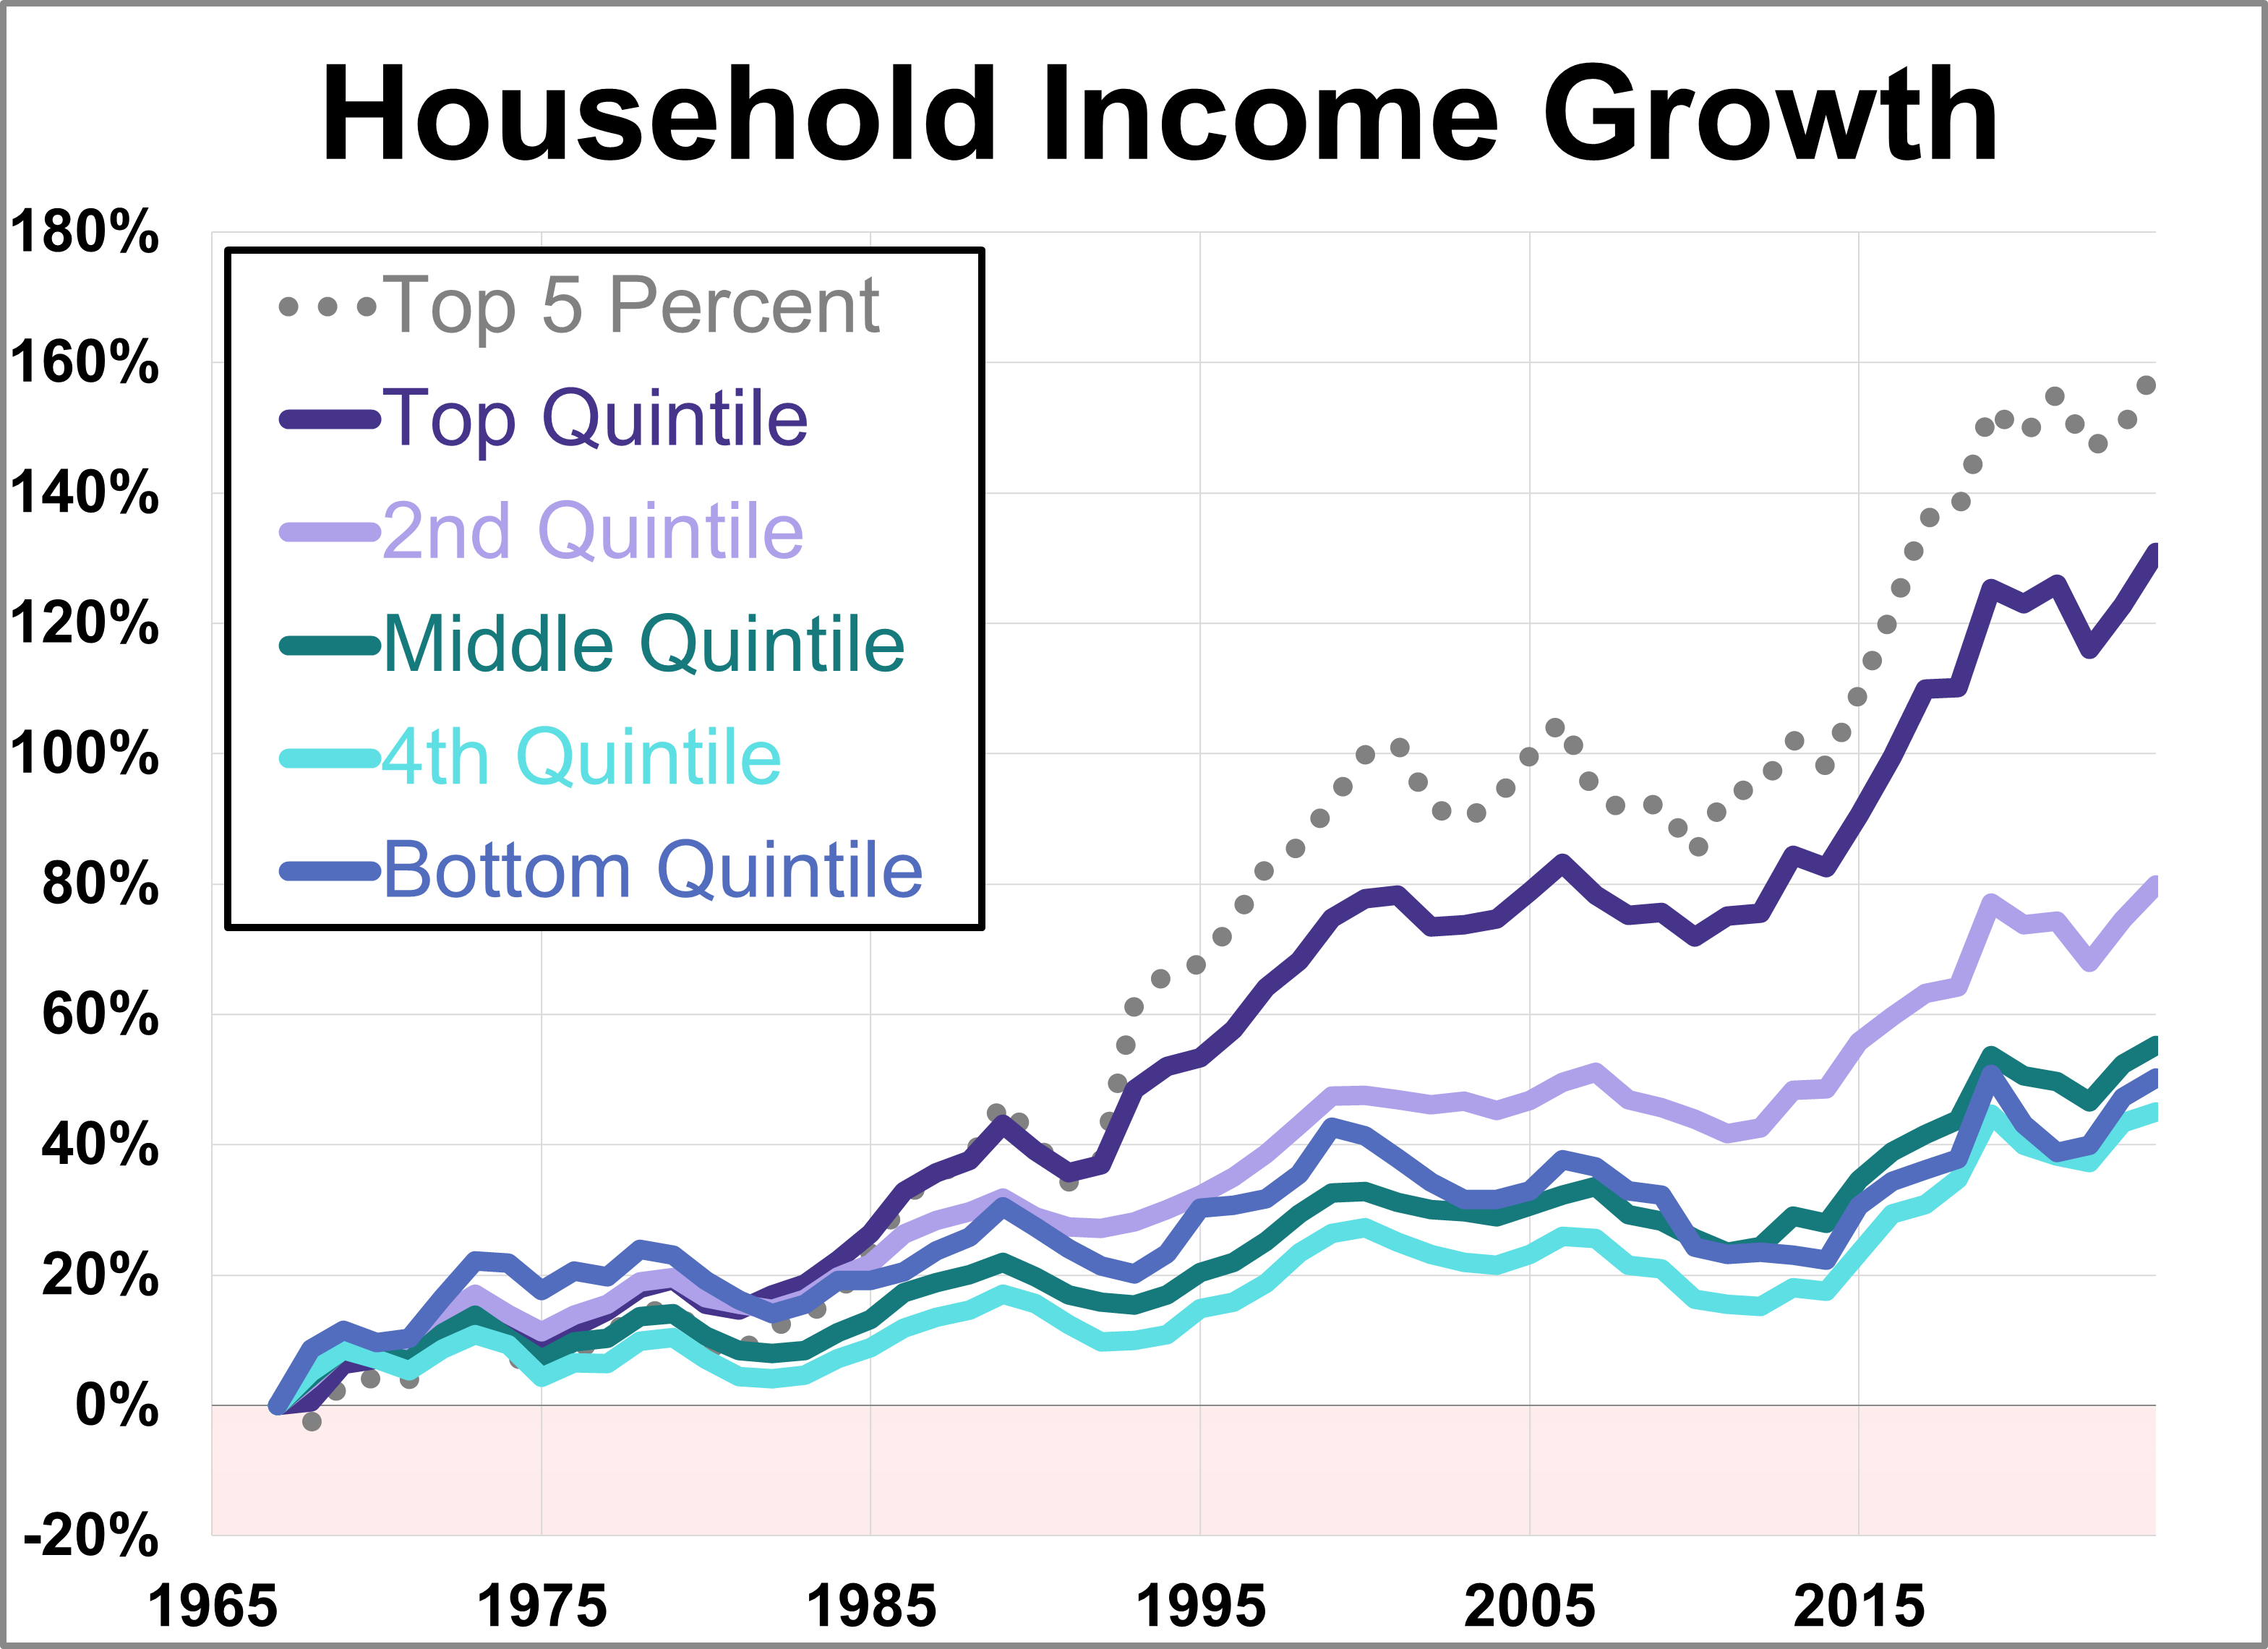
The Census Bureau recently released its annual report on household income data for 2024. The mean (average) household income for the middle quintile rose 4.5% to $84,390. Let's take a closer look at the quintile averages, which date back to 1967, along with the statistics for the top 5%.
Weekly Economic Snapshot: Rising Prices and a Softening Labor Market

Last week's economic data presented a challenging picture for the U.S. economy with key inflation reports delivering conflicting signals and a timely labor market indicator added to the narrative of a softening labor market.
Chart-ing the Economy: Week of September 2nd - 5th

The U.S. labor market continued to show signs of cooling, with all major labor indicators pointing to a softening trend and a weak hiring environment. Read through the major economic news from the week of September 2nd - 5th.
Weekly Economic Snapshot: Labor Market Weakness

The U.S. labor market continued to show signs of cooling, with all major labor indicators pointing to a softening trend and a weak hiring environment.
Weekly Economic Snapshot: Rising Prices and Falling Confidence

Last week's economic data revealed strong economic growth running up against rising prices and falling confidence.
Chart-ing the Economy: Week of August 18th - 22nd

Last week was dominated by a major event in the financial world, the Jackson Hole symposium, and the subsequent reaction from the markets. Read through the major economic news form the week of August 18th - 22nd.
Weekly Economic Snapshot: Labor Market Weakness & the Jackson Hole Rally

In economic news other than that from Jackson Hole, the week included a new record high for margin debt and more.
Chart-ing the Economy: Week of August 11th - 15th

Last week, the S&P 500 had a rally that took it to three straight record highs but the momentum cooled as economic data painted a complex picture. Read through the major economic news from the week of August 11th-15th.
Weekly Economic Snapshot: Market Hits New High as Conflicting Inflation Data Emerges

Last week, the S&P 500 had a rally that took it to 3 straight record highs. The momentum cooled as economic data painted a complex picture.
3 Interesting ETFs That Could Outperform the Market

Many advisors have come to agree that the key to navigating 2025’s uncertain market is to do so through a well-diversified portfolio.
Chart-ing the Economy: Week of July 28th - August 1st

Read through the major economic news from the week of July 28th-August 1st.
Weekly Economic Snapshot: Fed Holds Steady as Jobs & Inflation Signal Trouble

A strong GDP rebound was quickly overshadowed by a weaker-than-expected jobs report and hotter-than-anticipated inflation.
Looking Beyond Cap-Weighted ETF Giants

Heading into August, with over $680 billion of net inflows YTD, the ETF industry is on track to surpass the $1 trillion mark again.
Emerging Markets Comeback Story Could Be in Early Stages

Emerging markets (EM) could finally be in the throes of a comeback, and there are already signs it could be in its early stages.
ETF Experts Agree Chasing Commodities Is a Costly Mistake

Investing in commodities can be a difficult path for investors who react impulsively to market headlines and short-term price movements.
Top 10 Charts of 2025: Midyear Review

Now that we're more than halfway through 2025, let's take a look at the top 10 most-read charts so far for the year.
Weekly Economic Snapshot: Inflation Relief Meets Consumer Woes

While April brought further welcome news on the inflation front, underlying consumer fundamentals painted a more concerning picture.
Weekly Economic Snapshot: Fed Holds Steady Amid Services Growth & Record Trade Gap

Last week featured a light economic calendar, with the Fed holding its benchmark interest rate steady for the third consecutive meeting.
Emerging Markets Watchlist: April 11, 2025
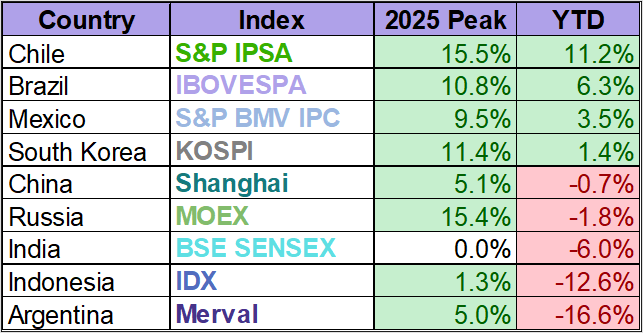
Four of the nine indexes on our emerging markets watch list have posted gains through April 11, 2025. Chile's IPSA is in the top spot with a year to date gain of 11.2%. Brazil's IBOVESPA is in second with a year to date gain of 6.3% while Mexico's BMV IPC is in third with a year to date gain of 3.5%.
Unemployment Claims Down 21K, Lower Than Expected
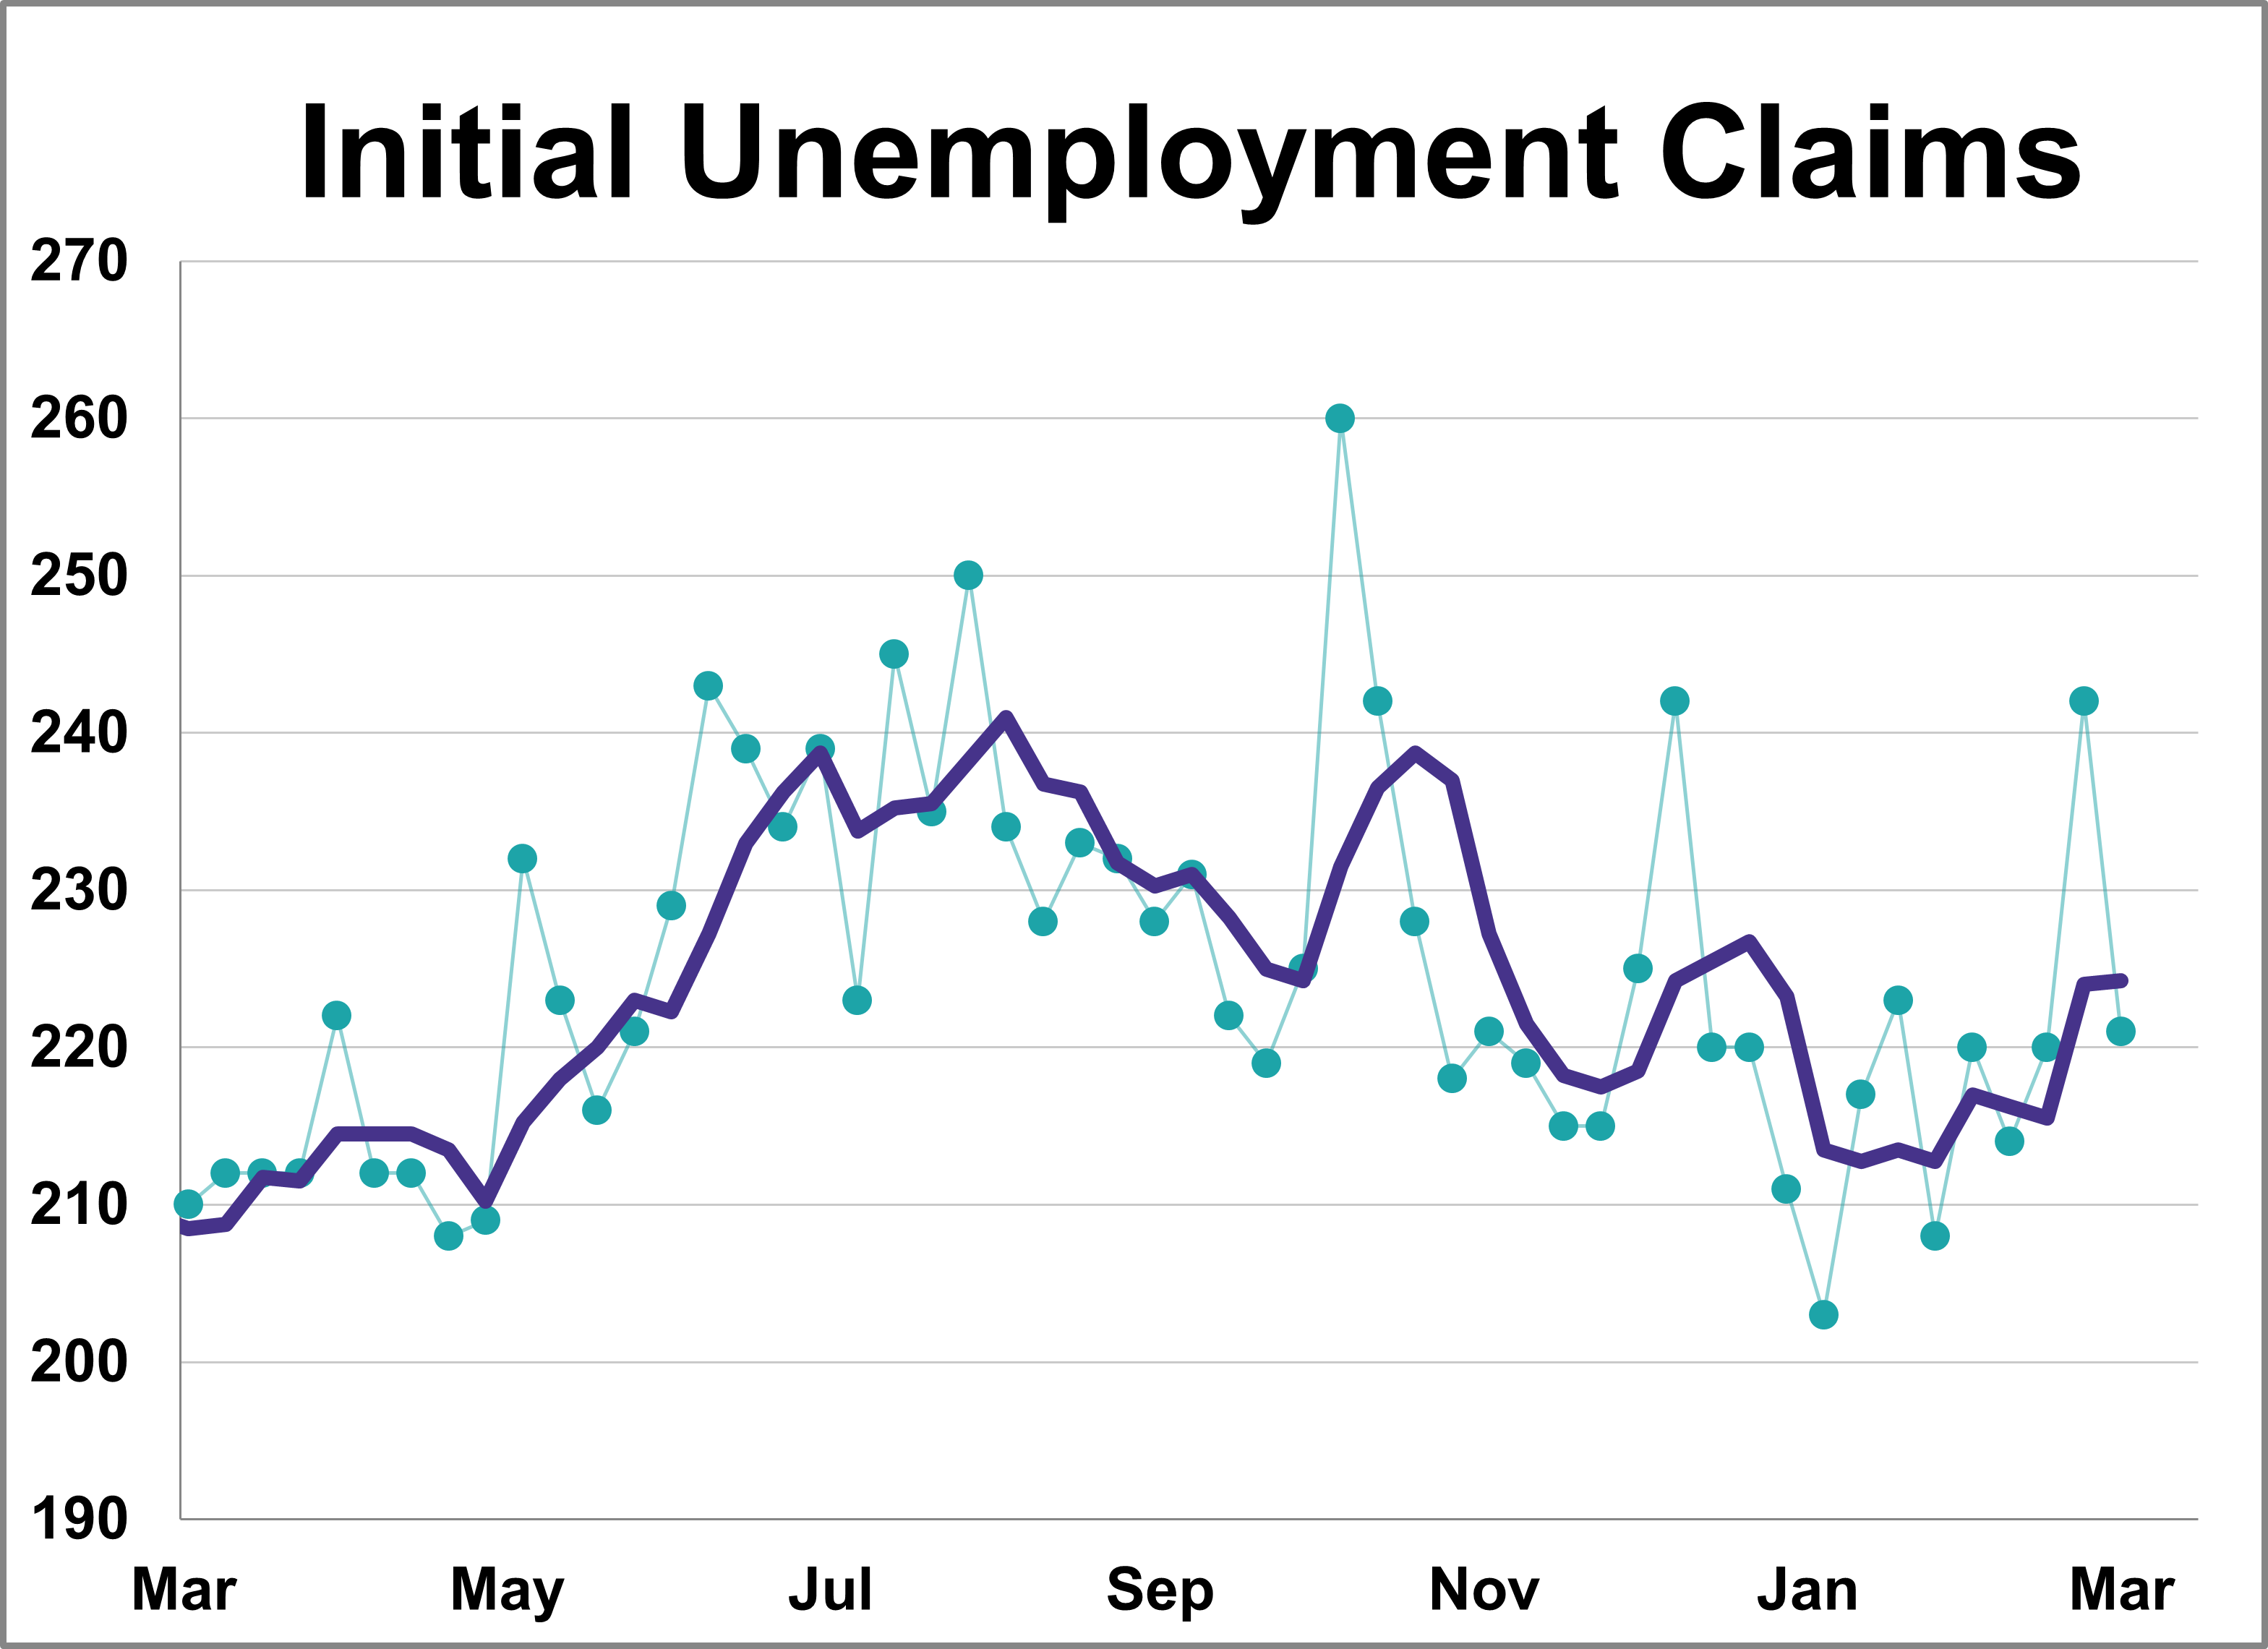
In the week ending March 1st, initial jobless claims were at a seasonally adjusted level of 221,000. This represents a decrease of 21,000 from the previous week's figure. The latest reading was lower than the 234,000 forecast.
Median Household Purchasing Power for the 50 States and DC: 2023 Update
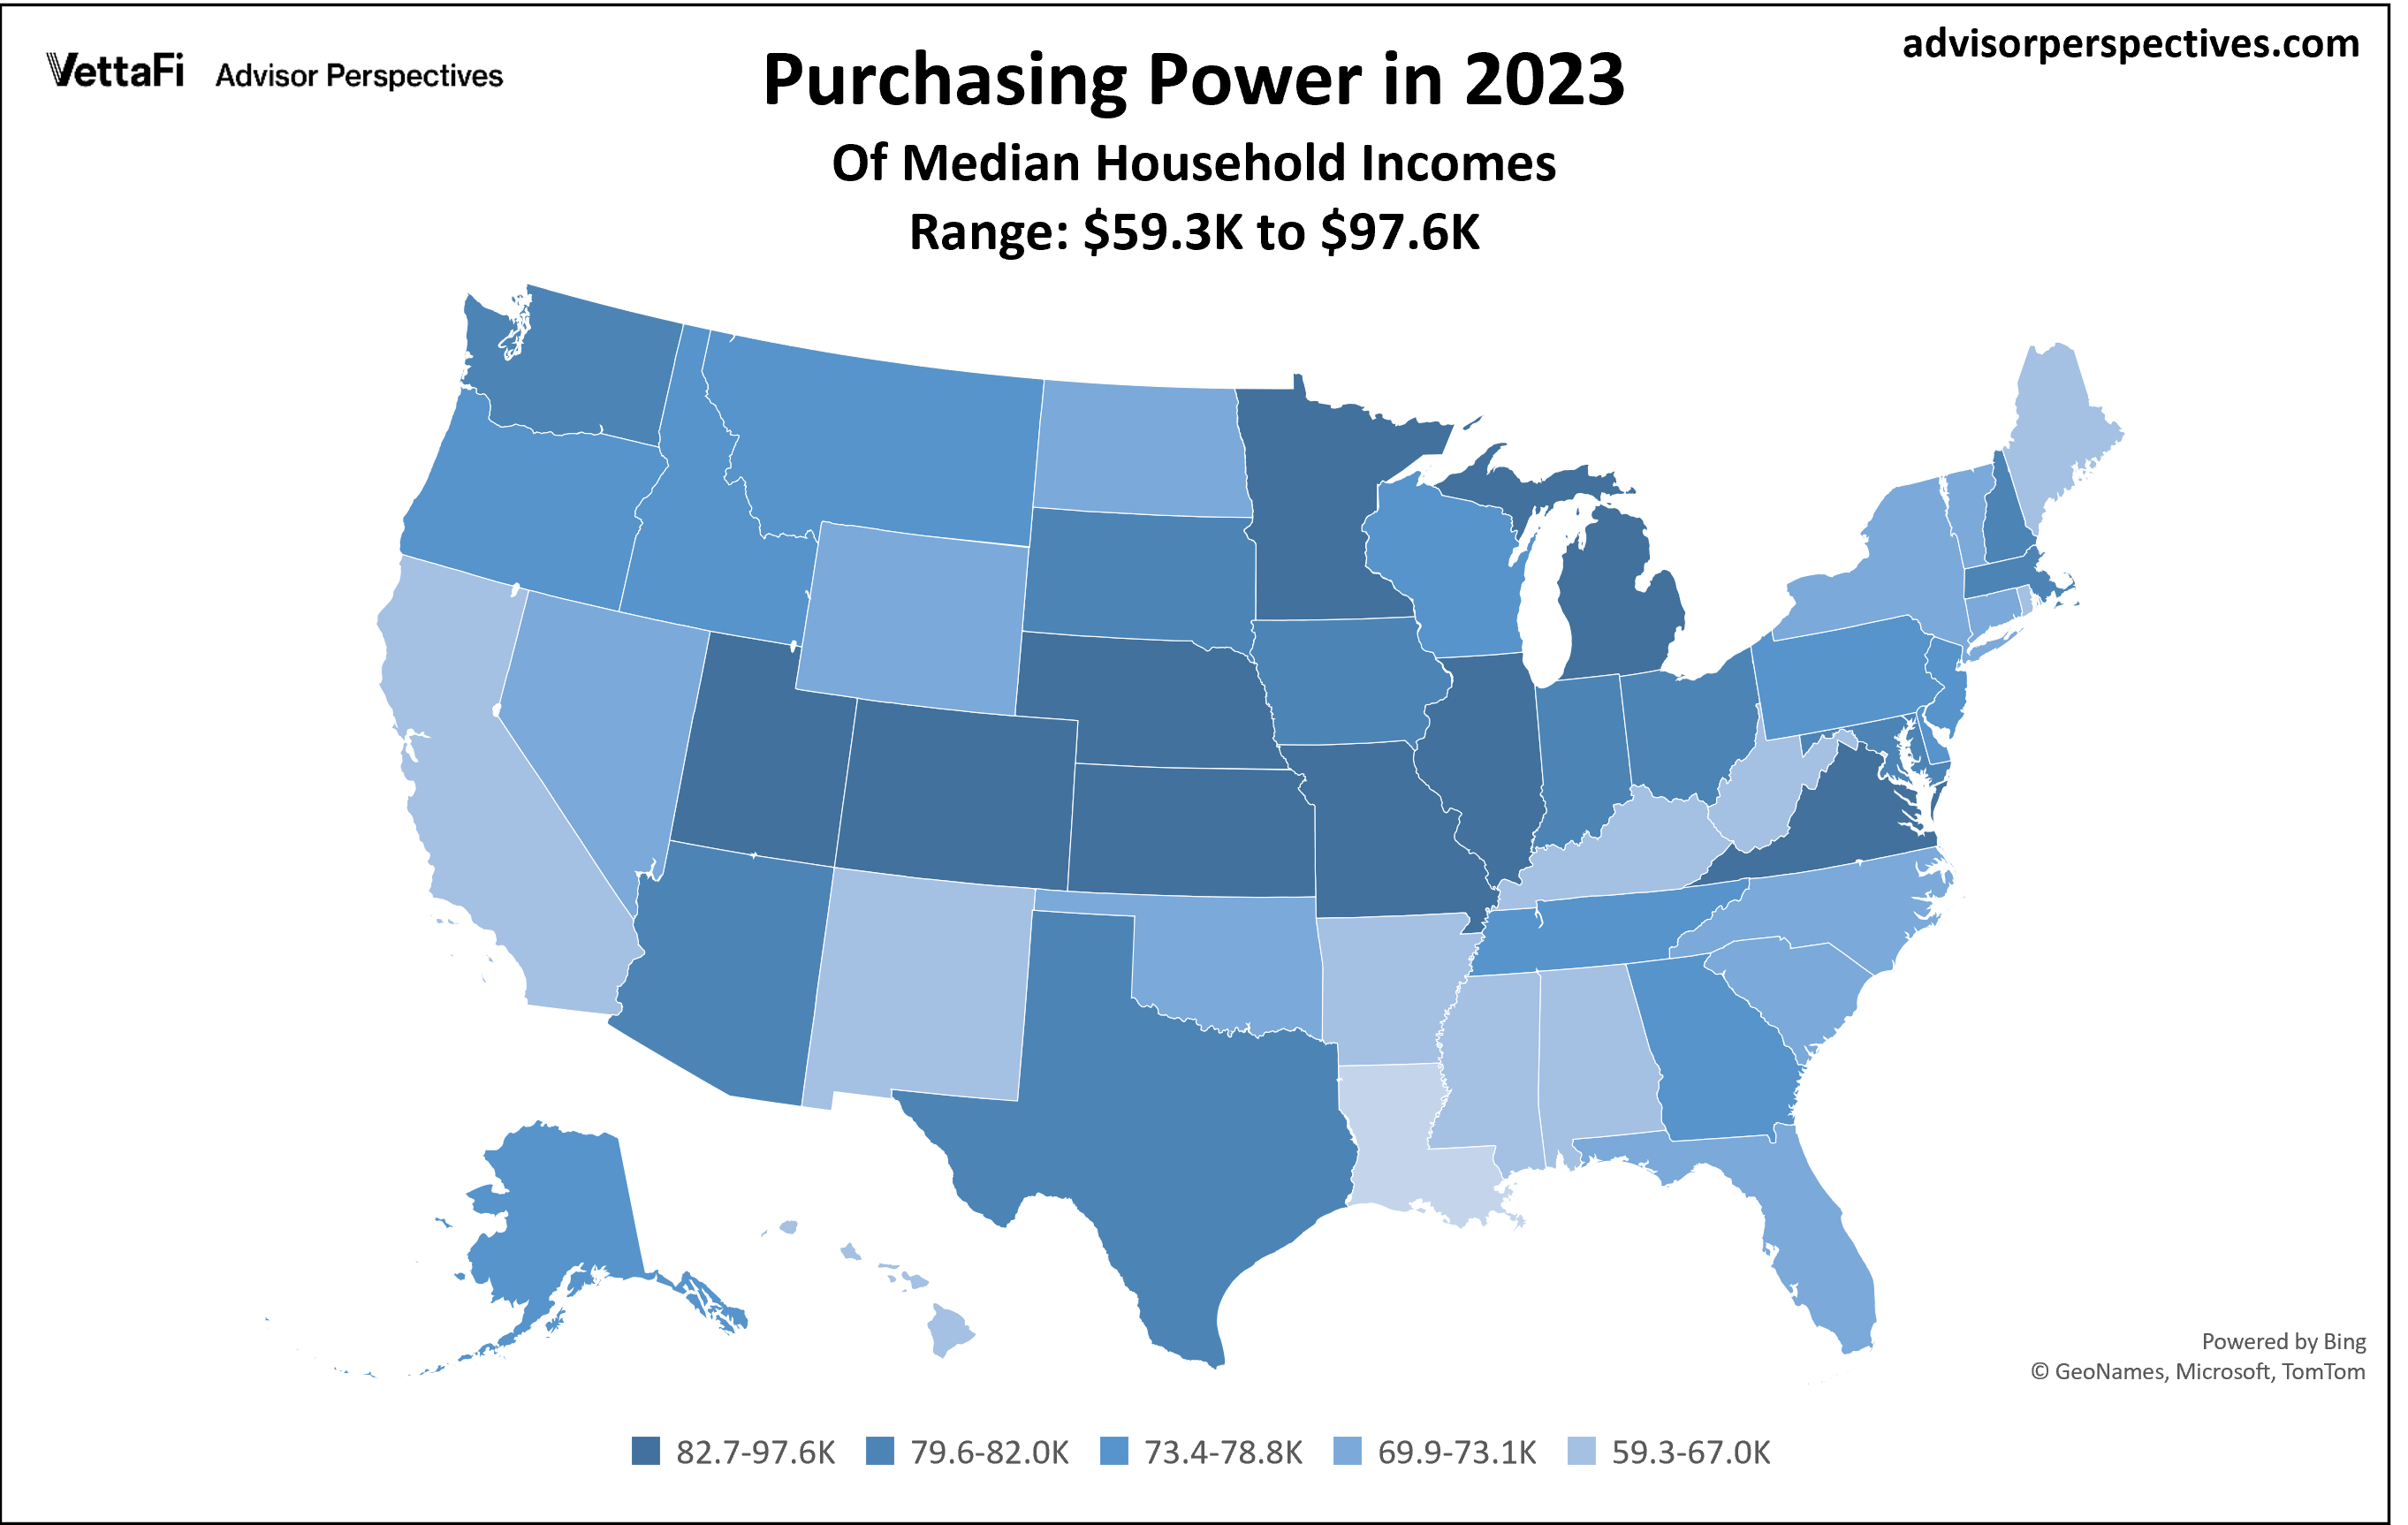
Earlier this week we posted an update on the median household income for the 50 states and DC which includes annual data from 1984 to 2023. Let's now look at the actual purchasing power of those median incomes. For this adjustment, we're using the "C2ER Cost of Living Index" produced by C2ER, the Council for Community and Economic Research.
Unemployment Claims Drop to 11-Month Low
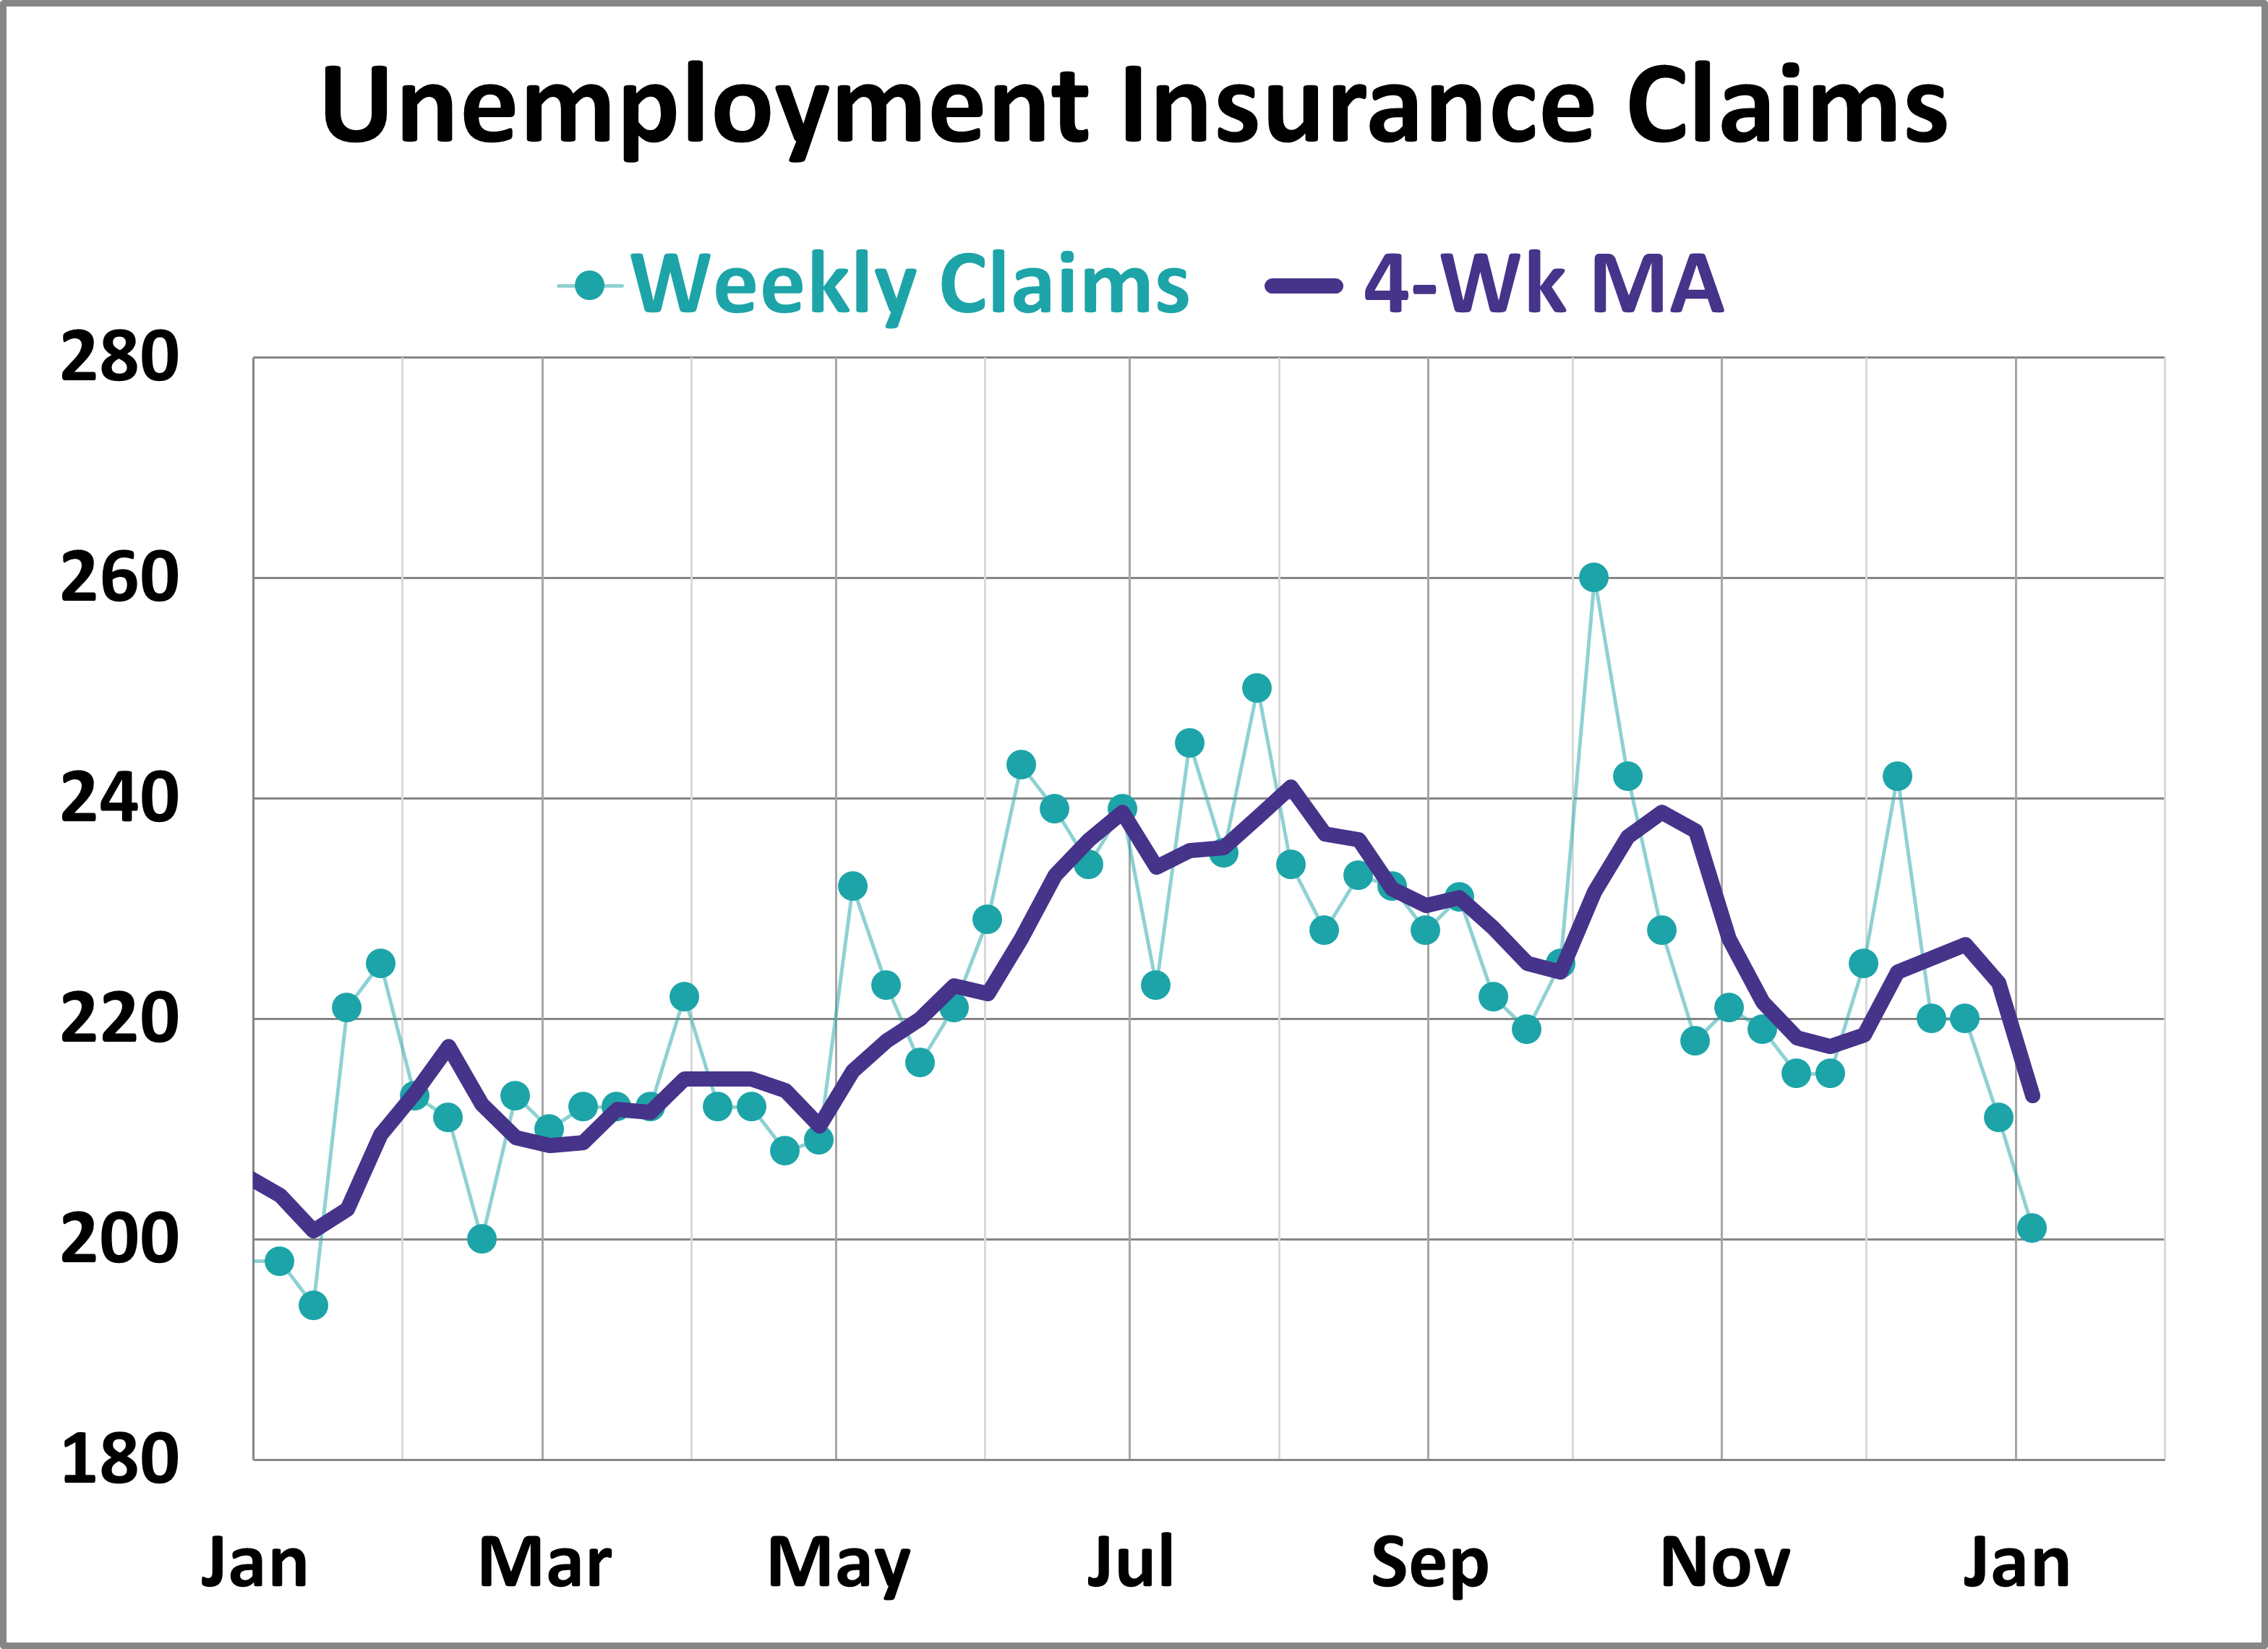
In the week ending January 4th, initial jobless claims fell to their lowest level since February 2024. Initial jobless claims were at a seasonally adjusted level of 201,000, a decrease of 10,000 from the previous week's figure. The latest reading was better than the 214,000 forecast.
Top 10 AP Charts of 2024

With 2024 behind us, let's revisit the top 10 most-read charts of the year.
CB Leading Economic Index: Small Rise in November
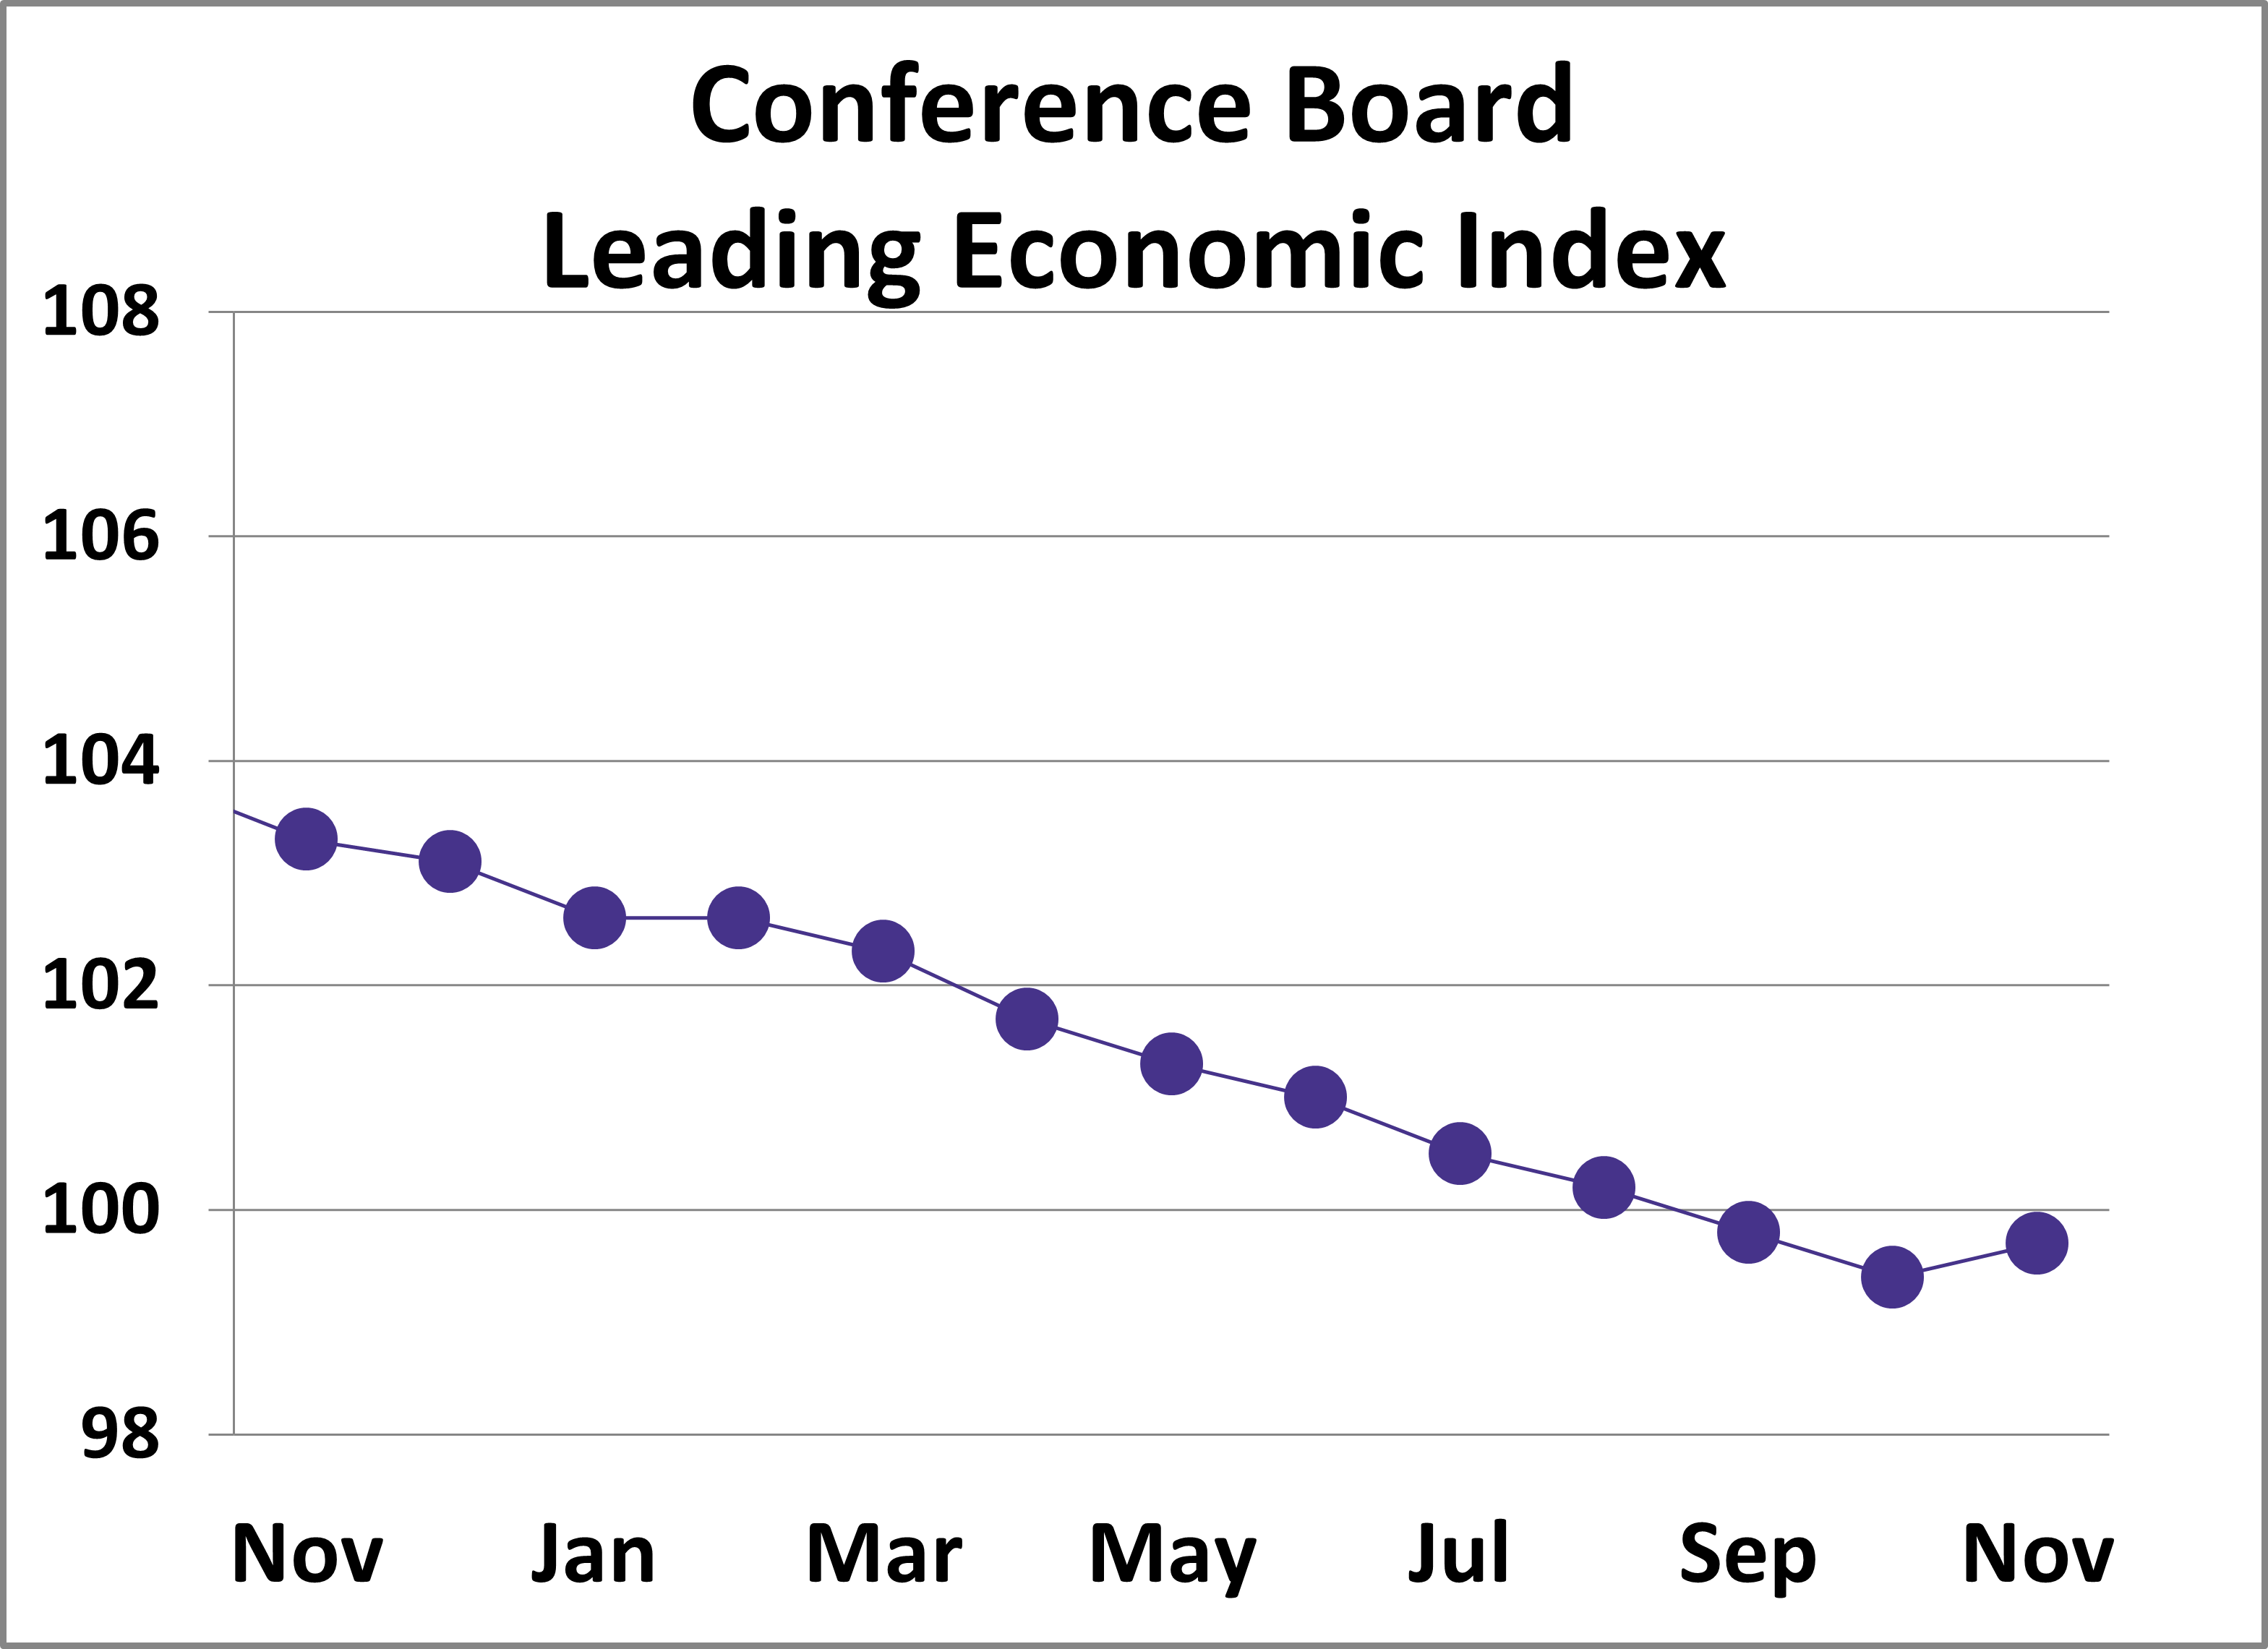
The Conference Board Leading Economic Index (LEI) increased slightly in November. The index rose 0.3% from the previous month to 99.7 after eight consecutive monthly declines.
Top 10 AP Charts of 2023

As 2023 comes to an end, let’s revisit the top 10 most-read AP charts of the year.
Underlying Inflation Gauge Falls for 15th Straight Month
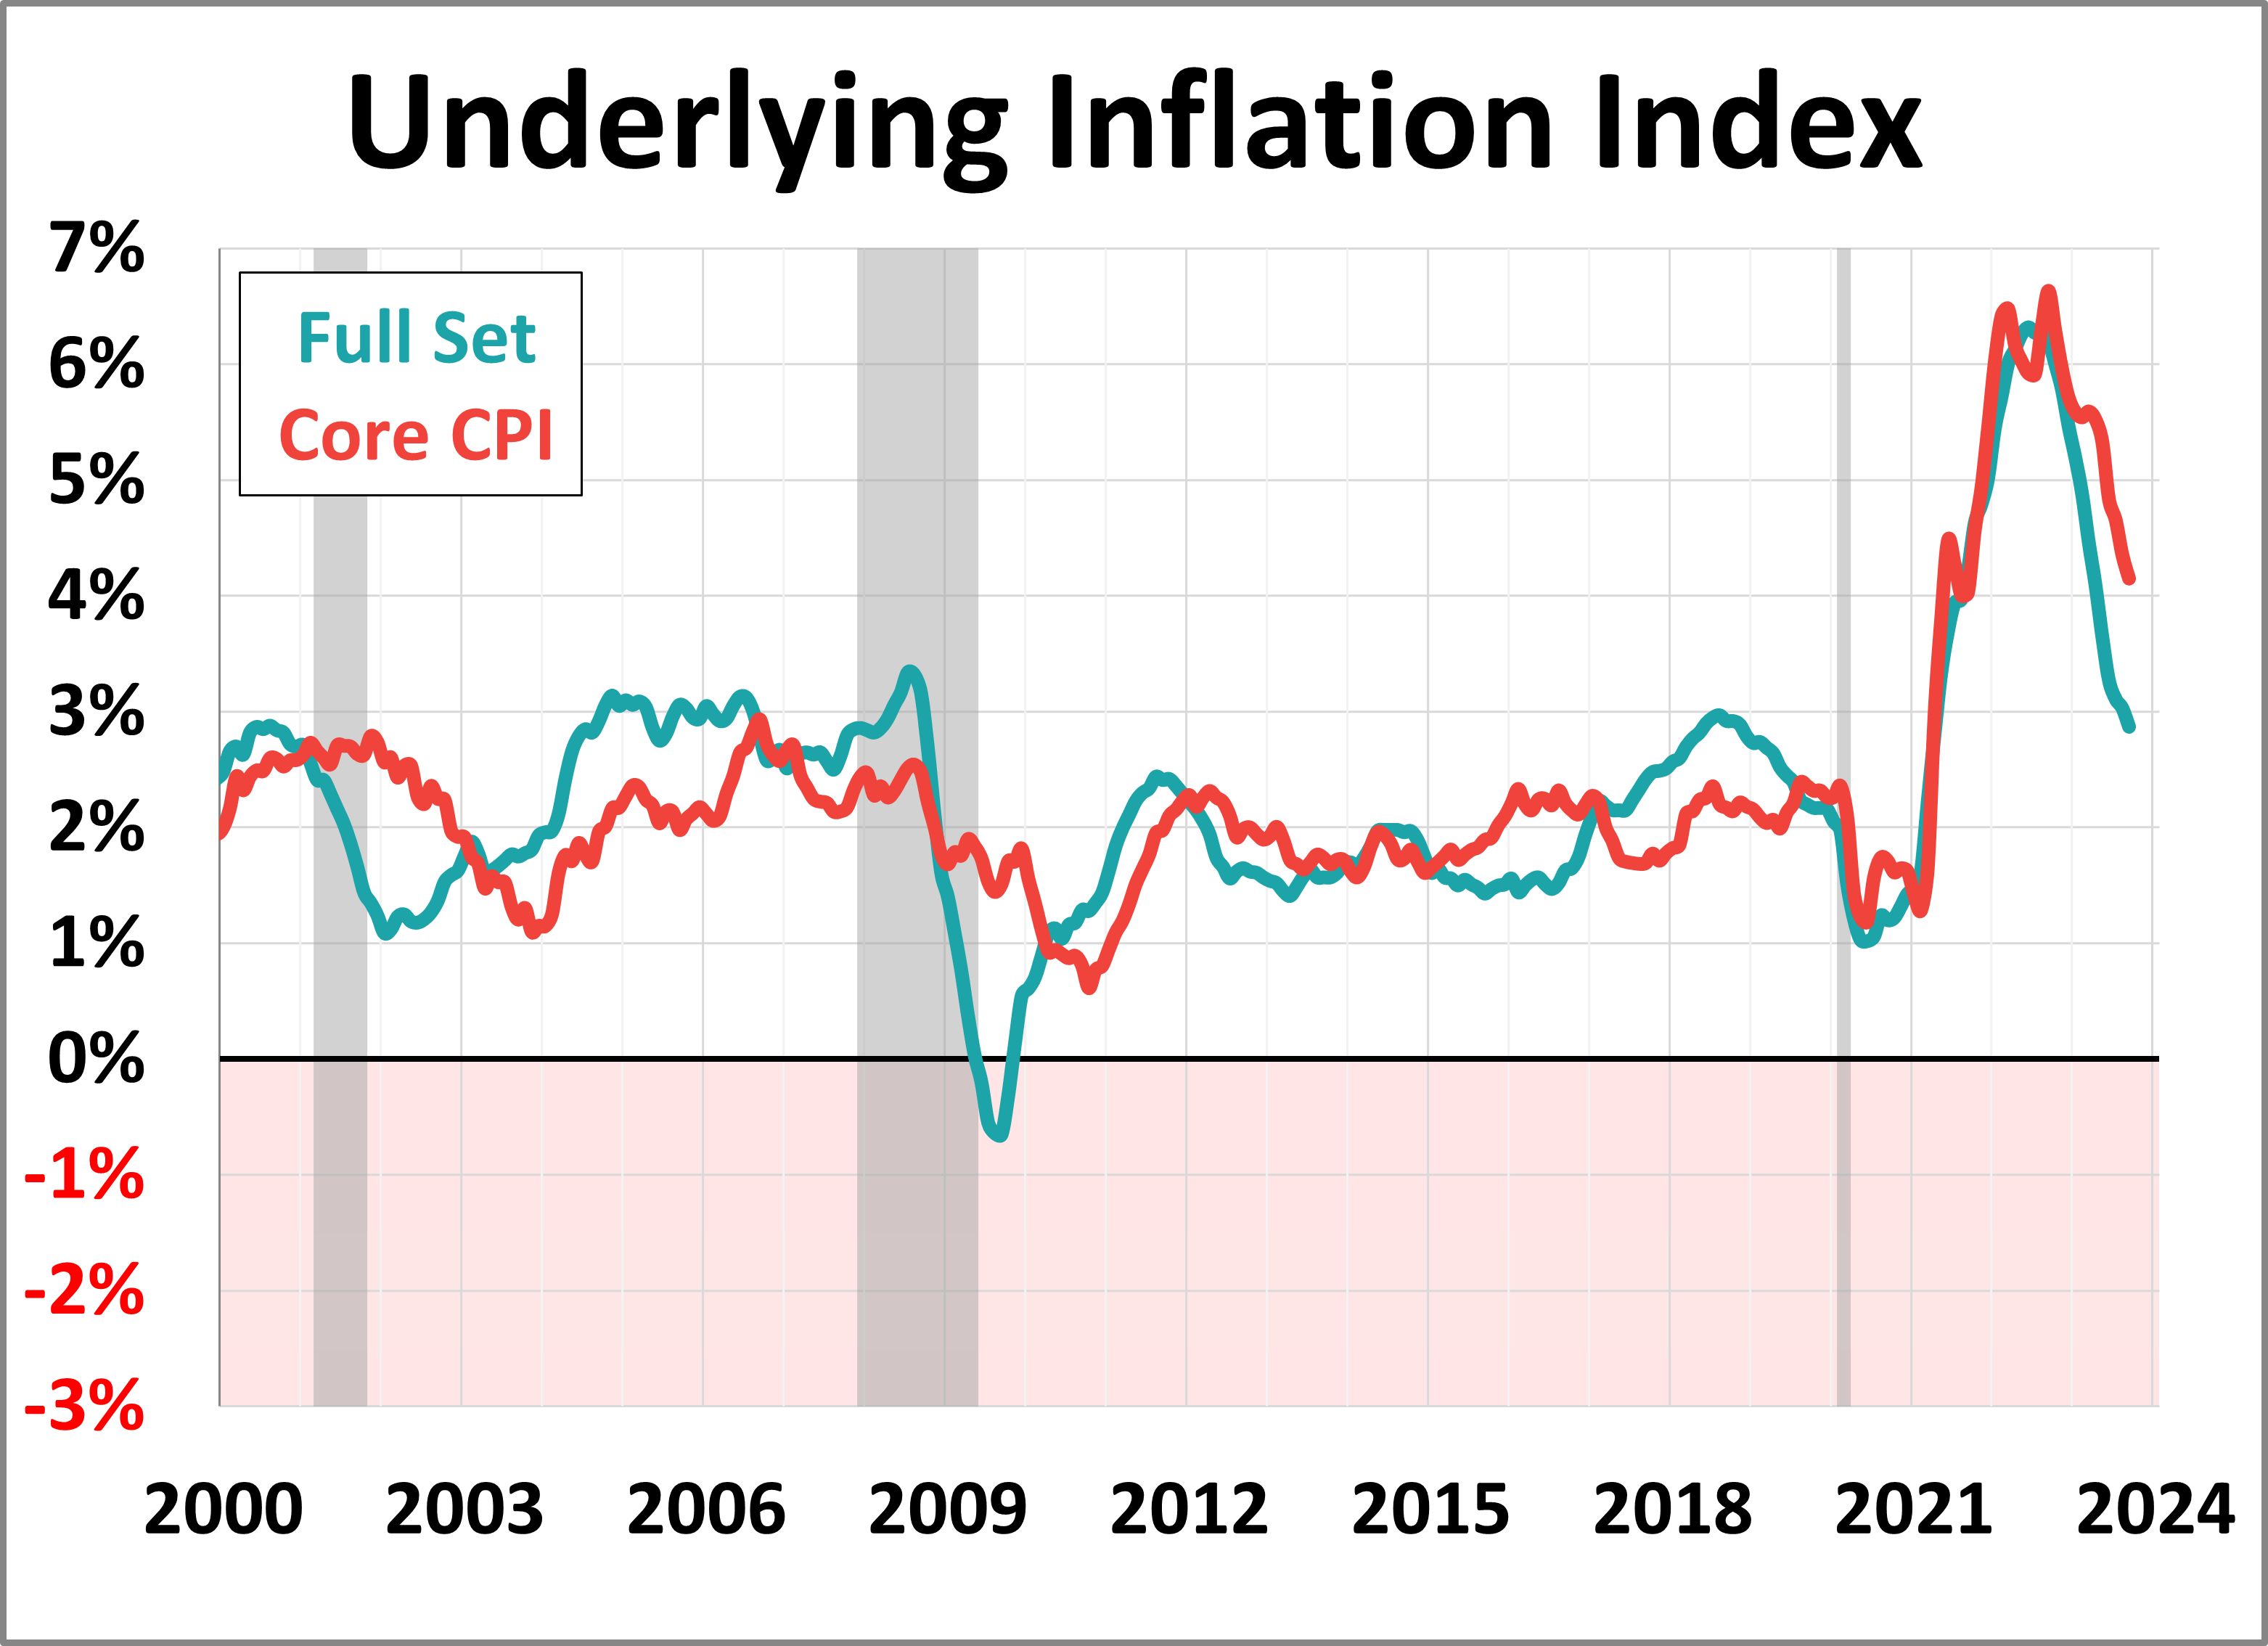
The latest Underlying Inflation Gauge full data set for September is 2.9%, down 0.1% from last month, while the prices-only measure is 2.2%, down 0.2% from last month. Current Headline CPI is now 3.7% and Core CPI is 4.2%.
Regional Fed Manufacturing Overview: September 2023
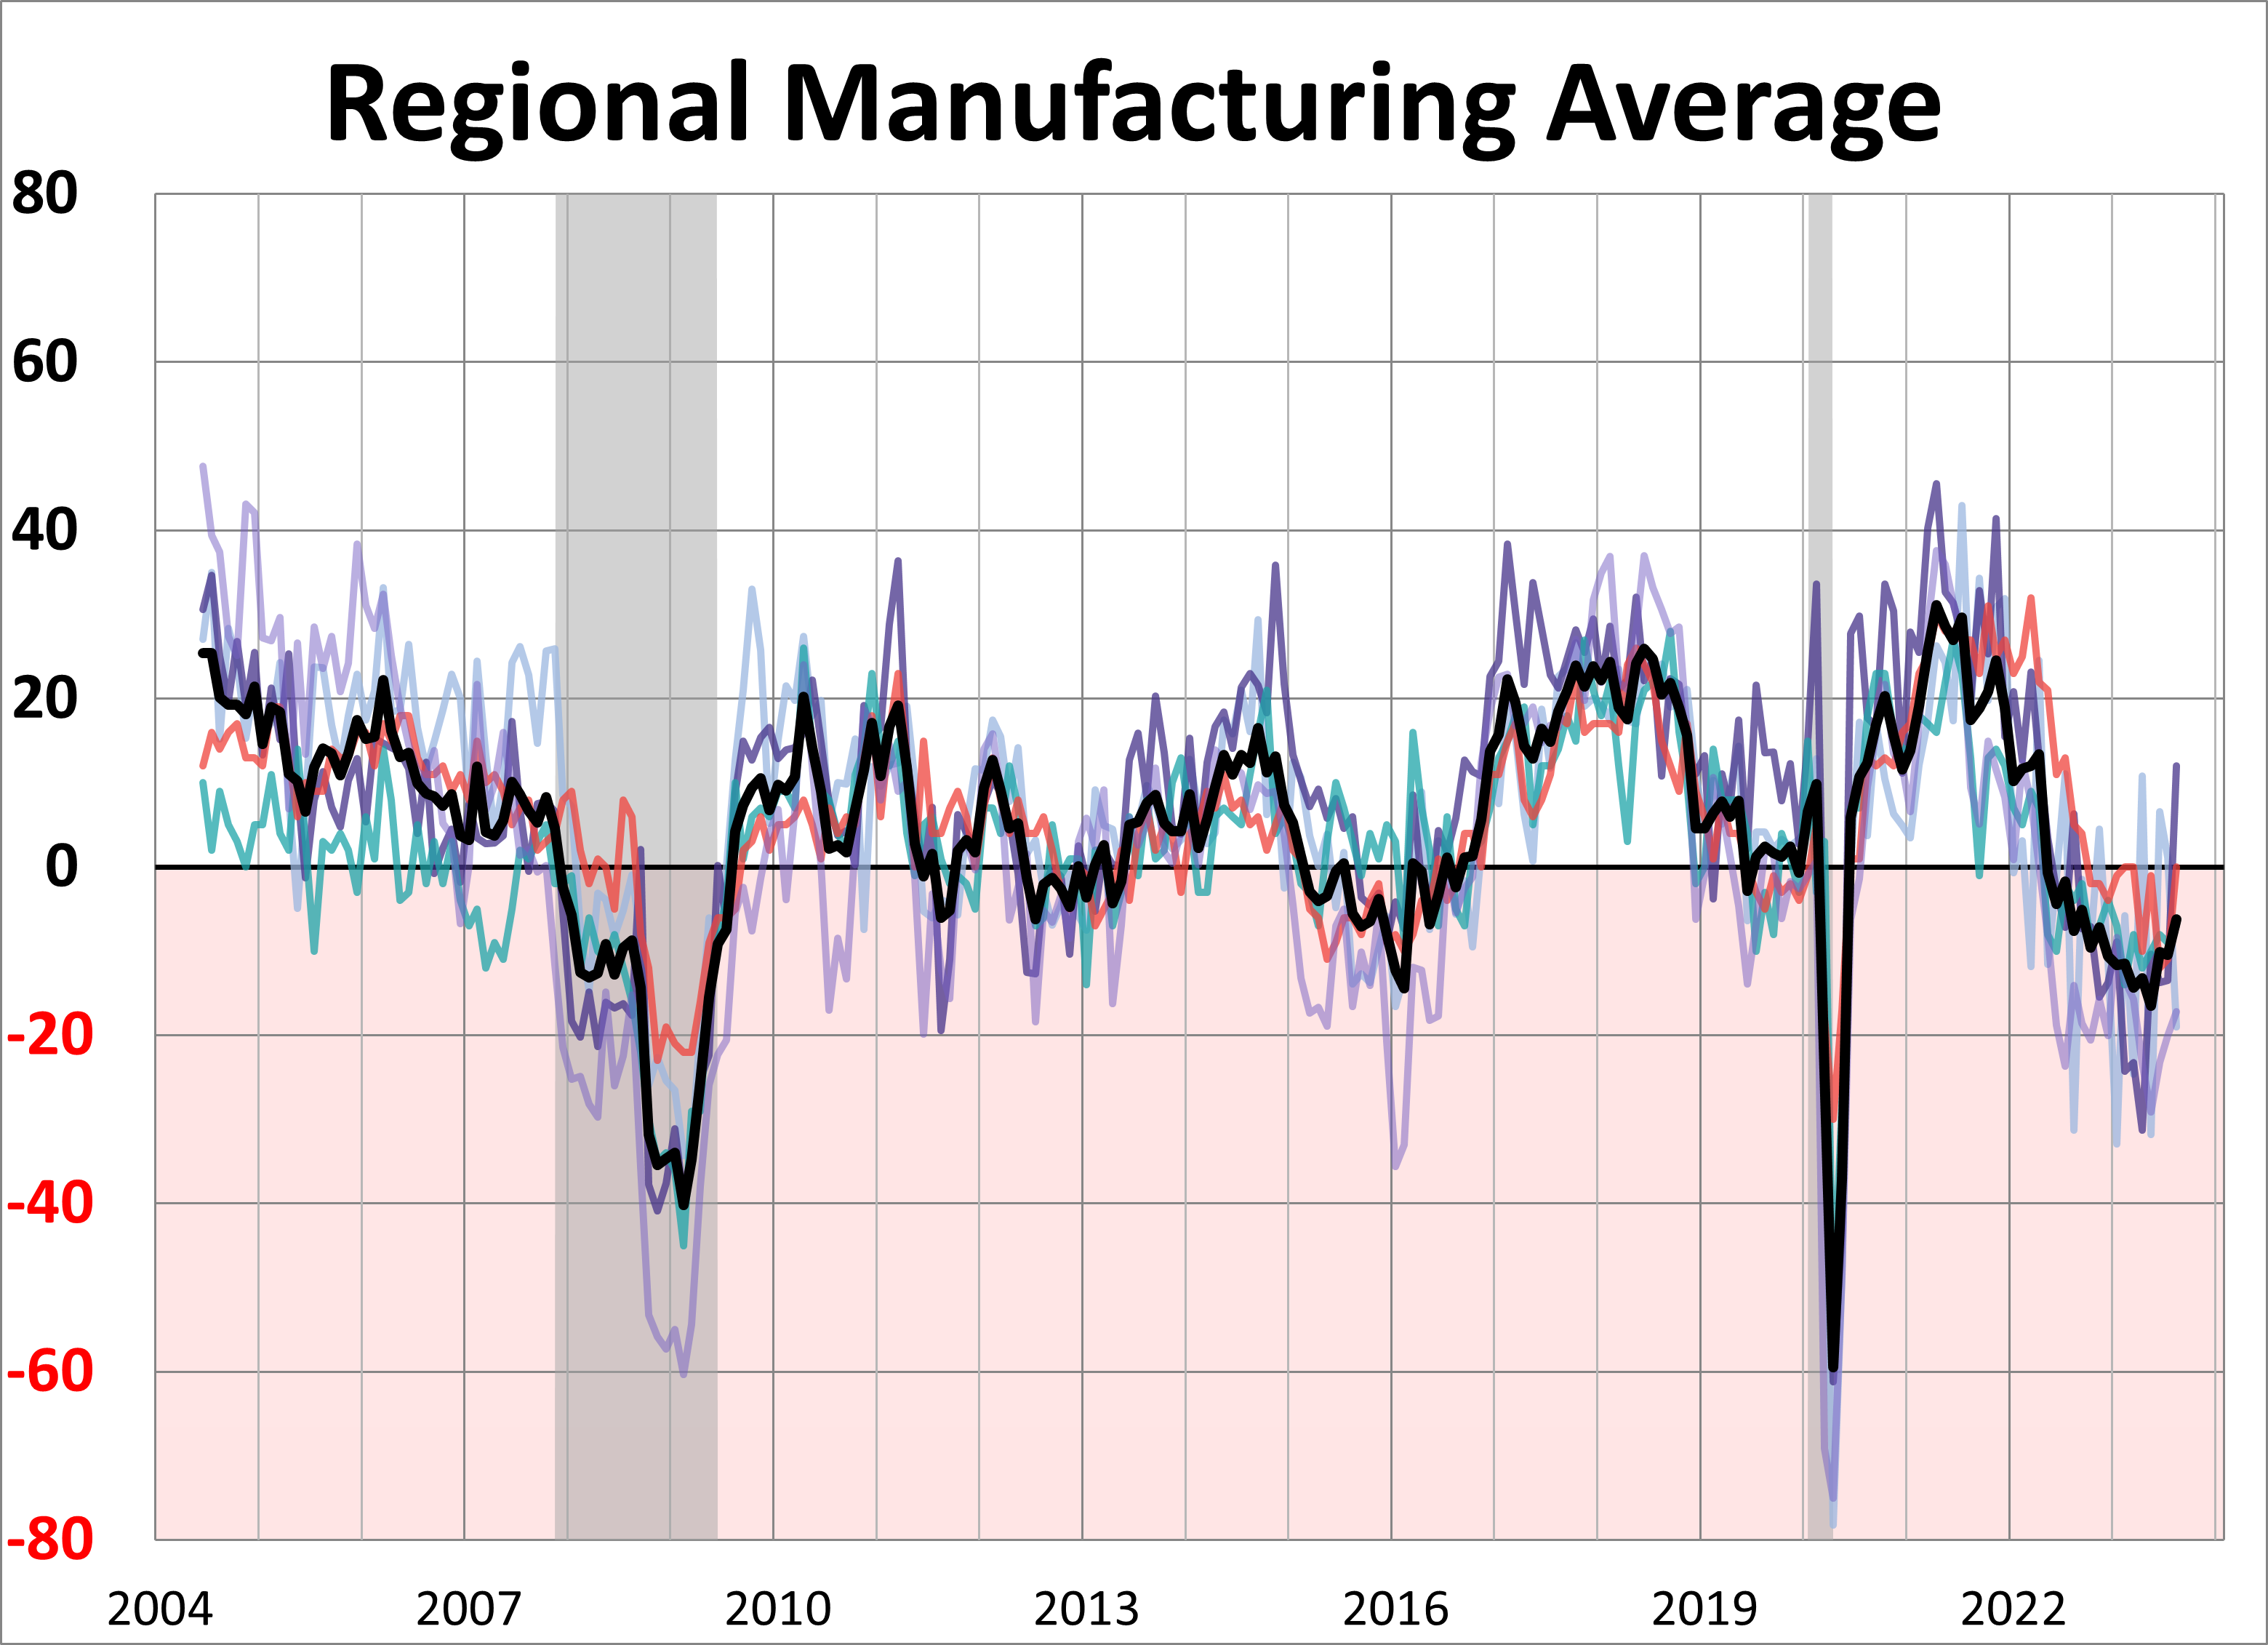
Five out of the 12 Federal Reserve Regional Districts currently publish monthly data on regional manufacturing: Dallas, Kansas City, New York, Richmond, and Philadelphia. The September average of the five districts is -6.5, down from the previous month.
The Philly Fed ADS Business Conditions Index
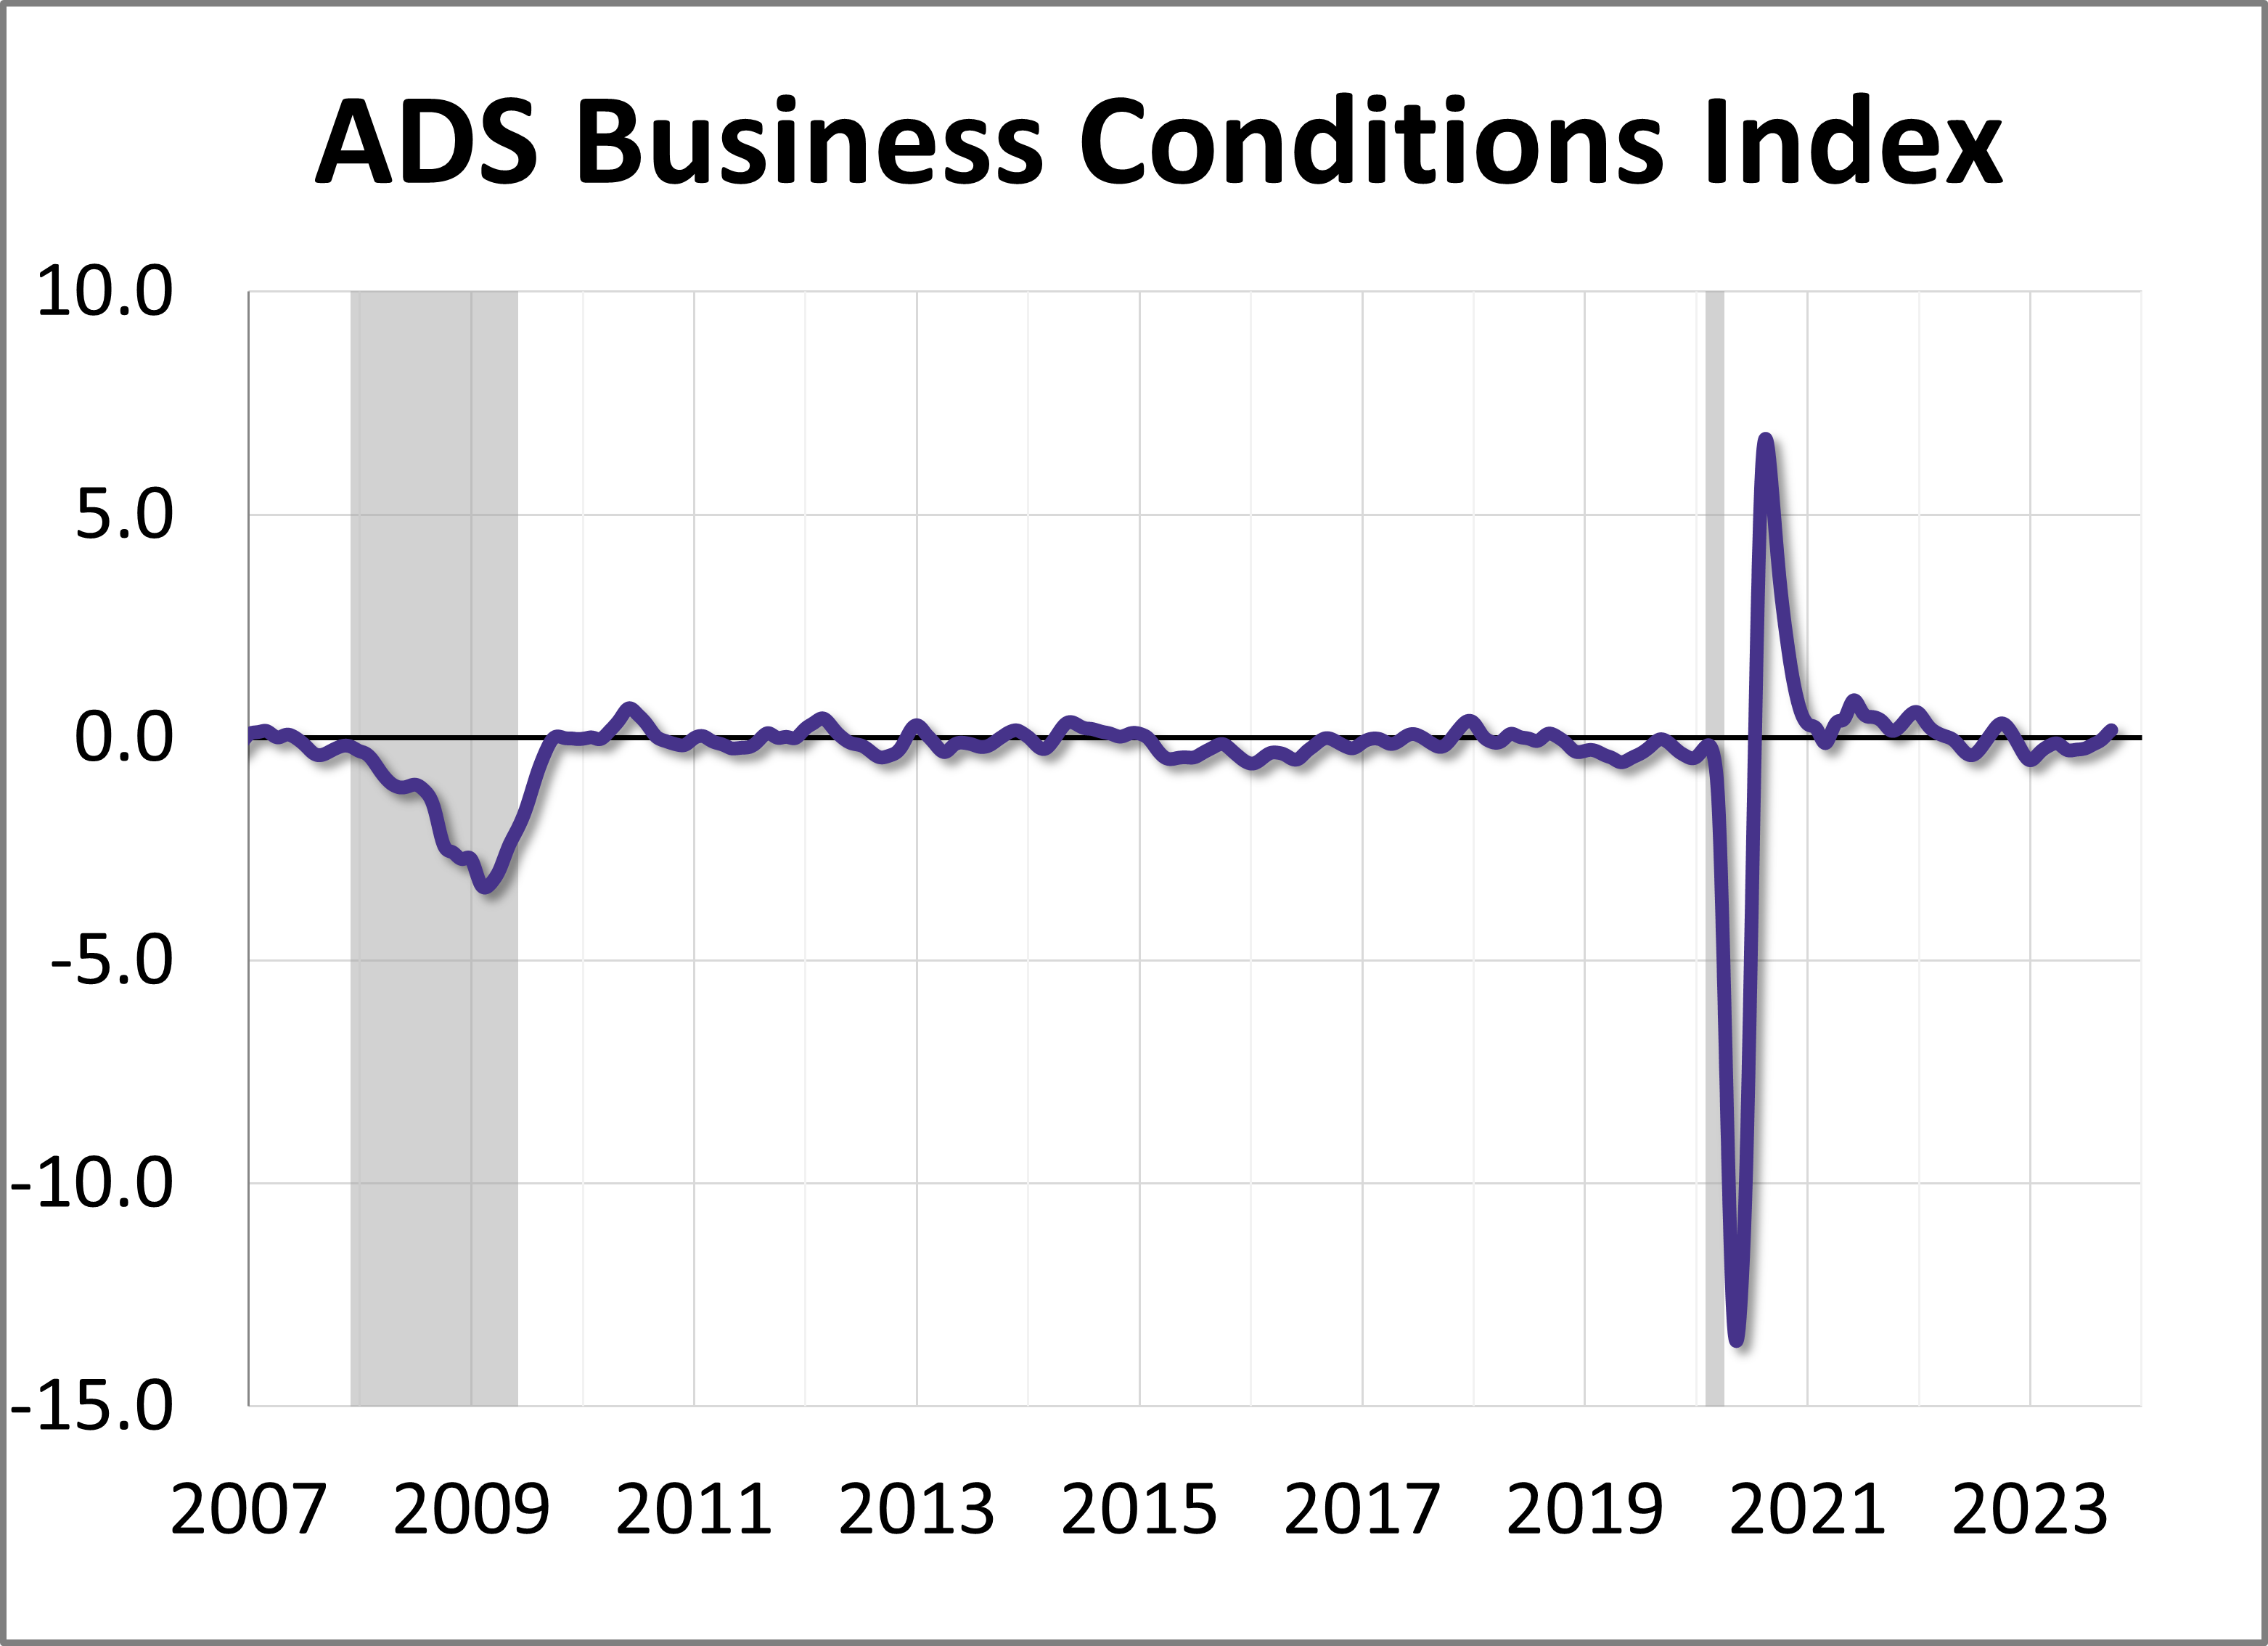
We've updated our periodic look at the Philly Fed ADS Index which includes real GDP (Q2 2023 third estimate) and initial jobless claims through 9/23.
The "Real" Goods on the August Durable Goods Data
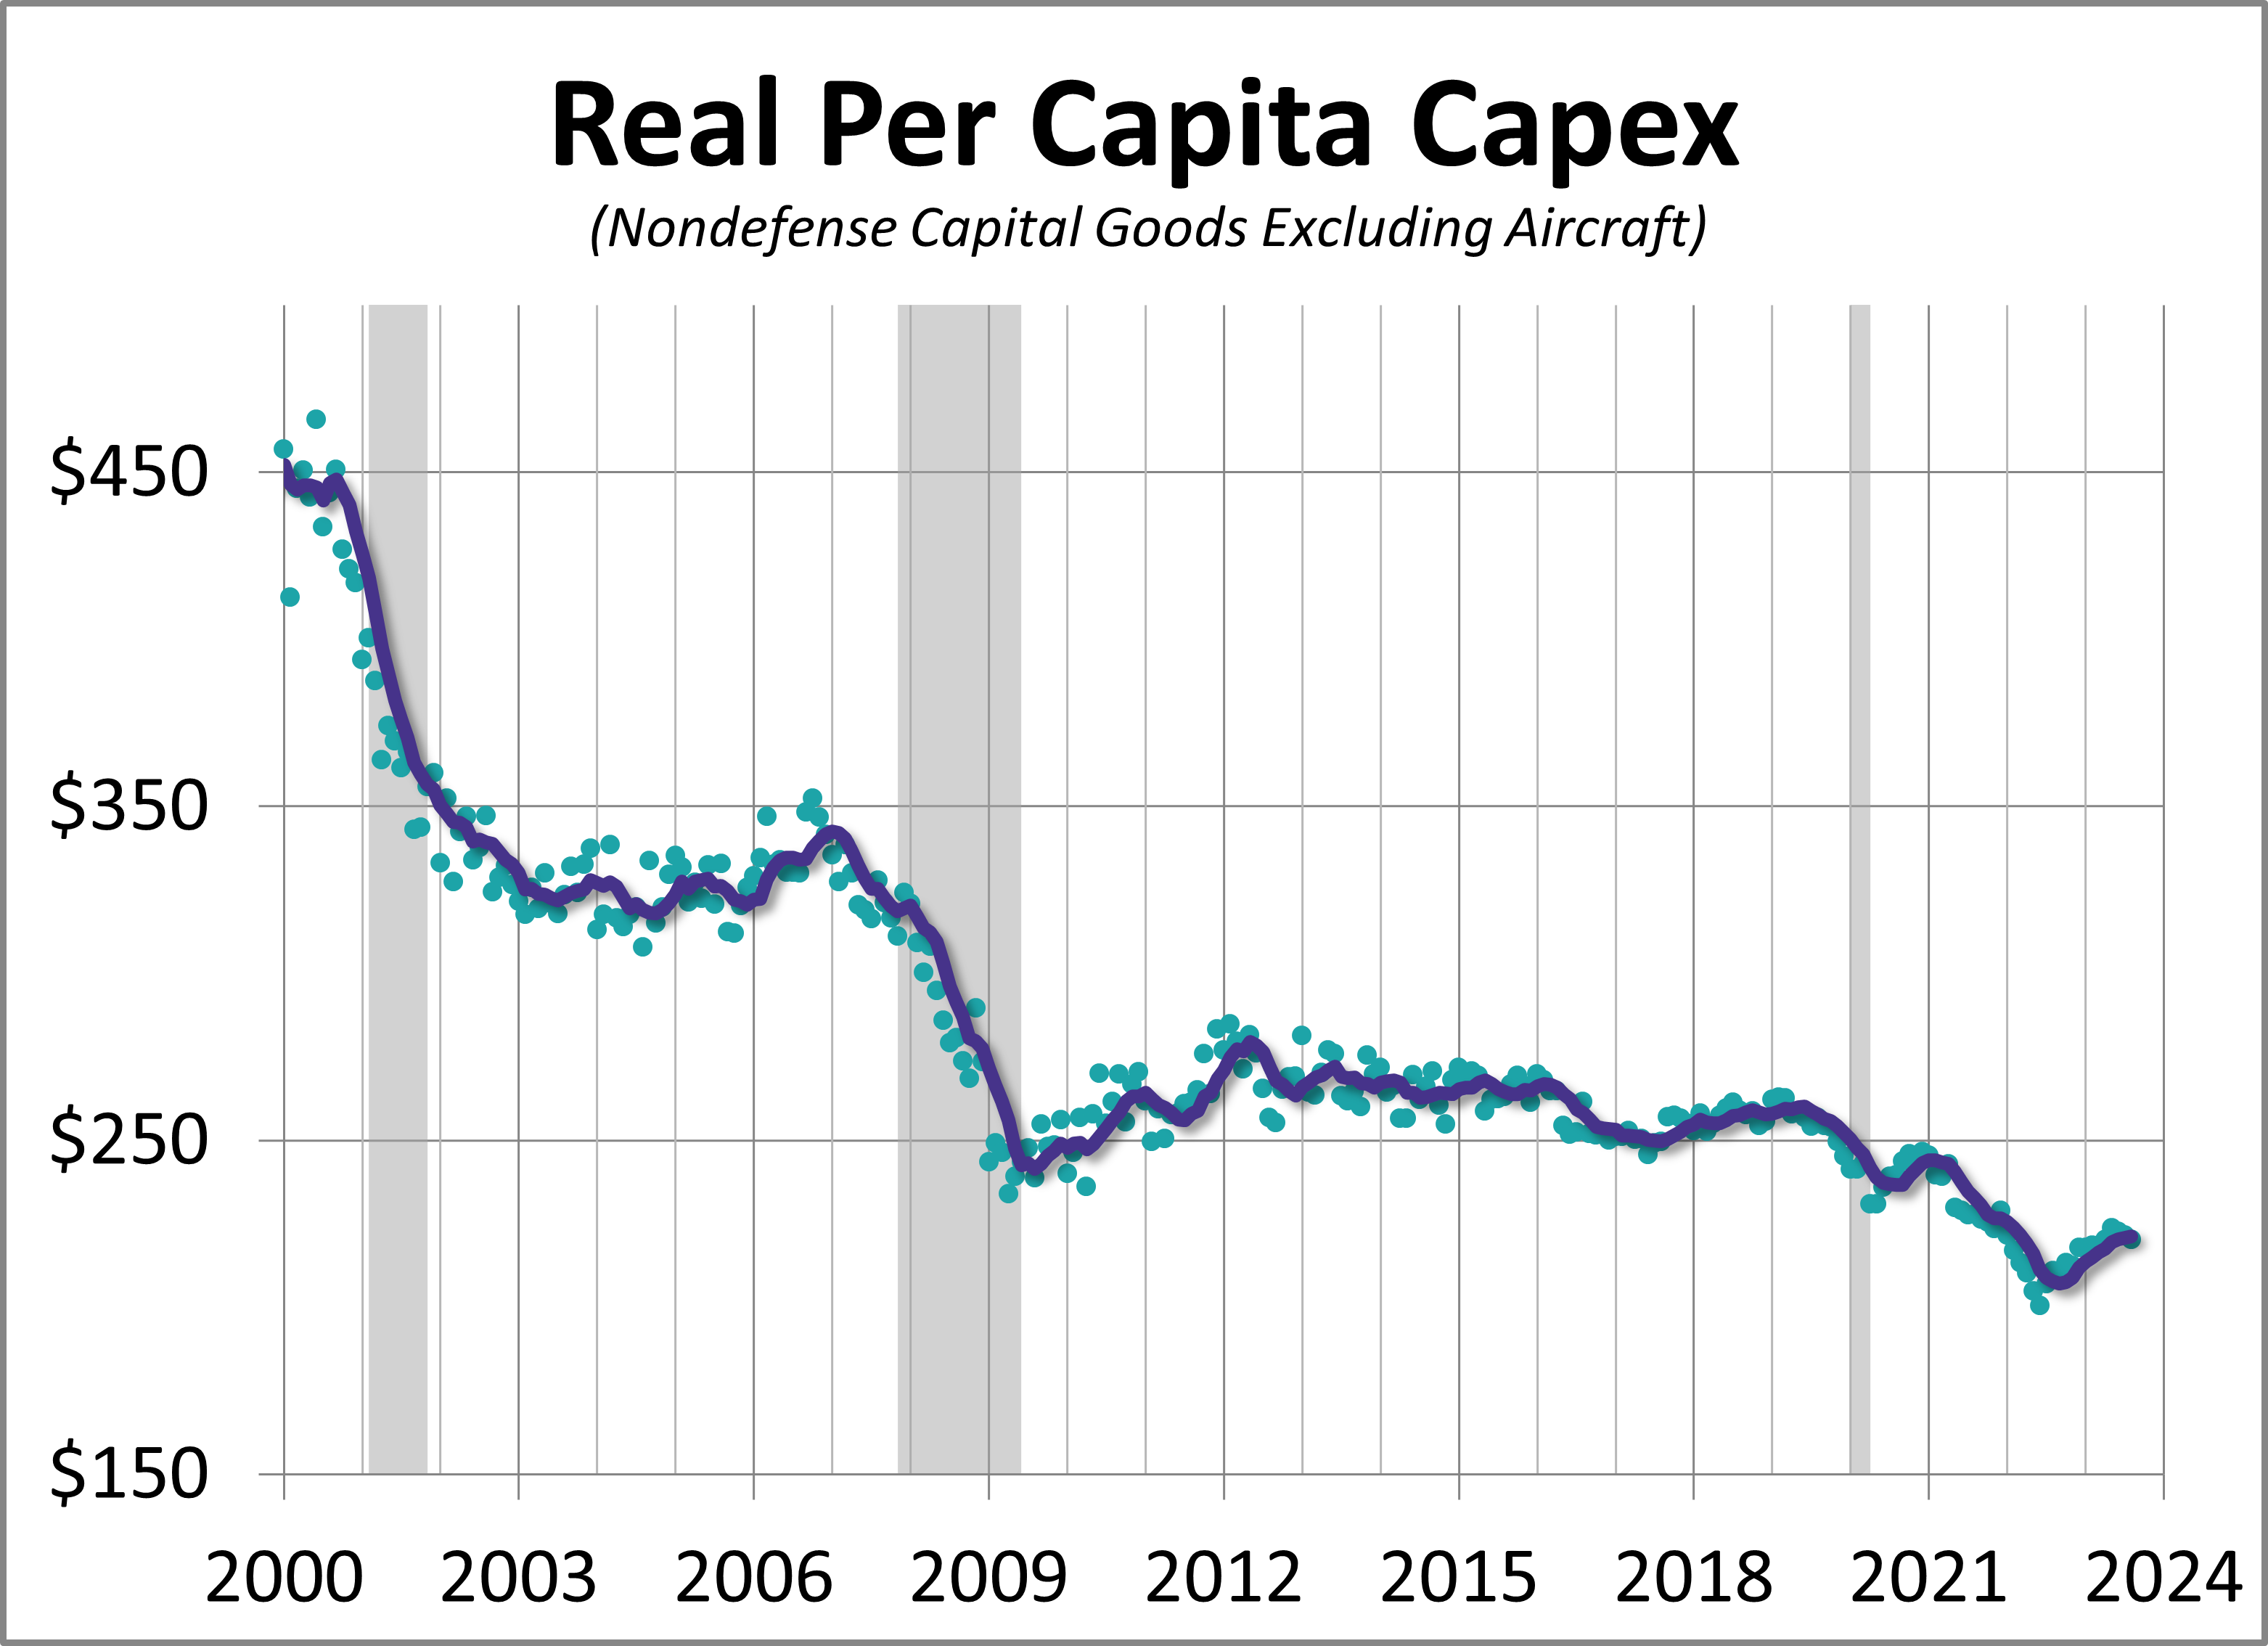
The Census Bureau has posted its advance report on new orders for durable goods for August. This series dates from 1992 and is not adjusted for either population growth or inflation. Let's review durable goods data with those two adjustments.
Breaking Down the Components of the Chicago Fed National Activity Index
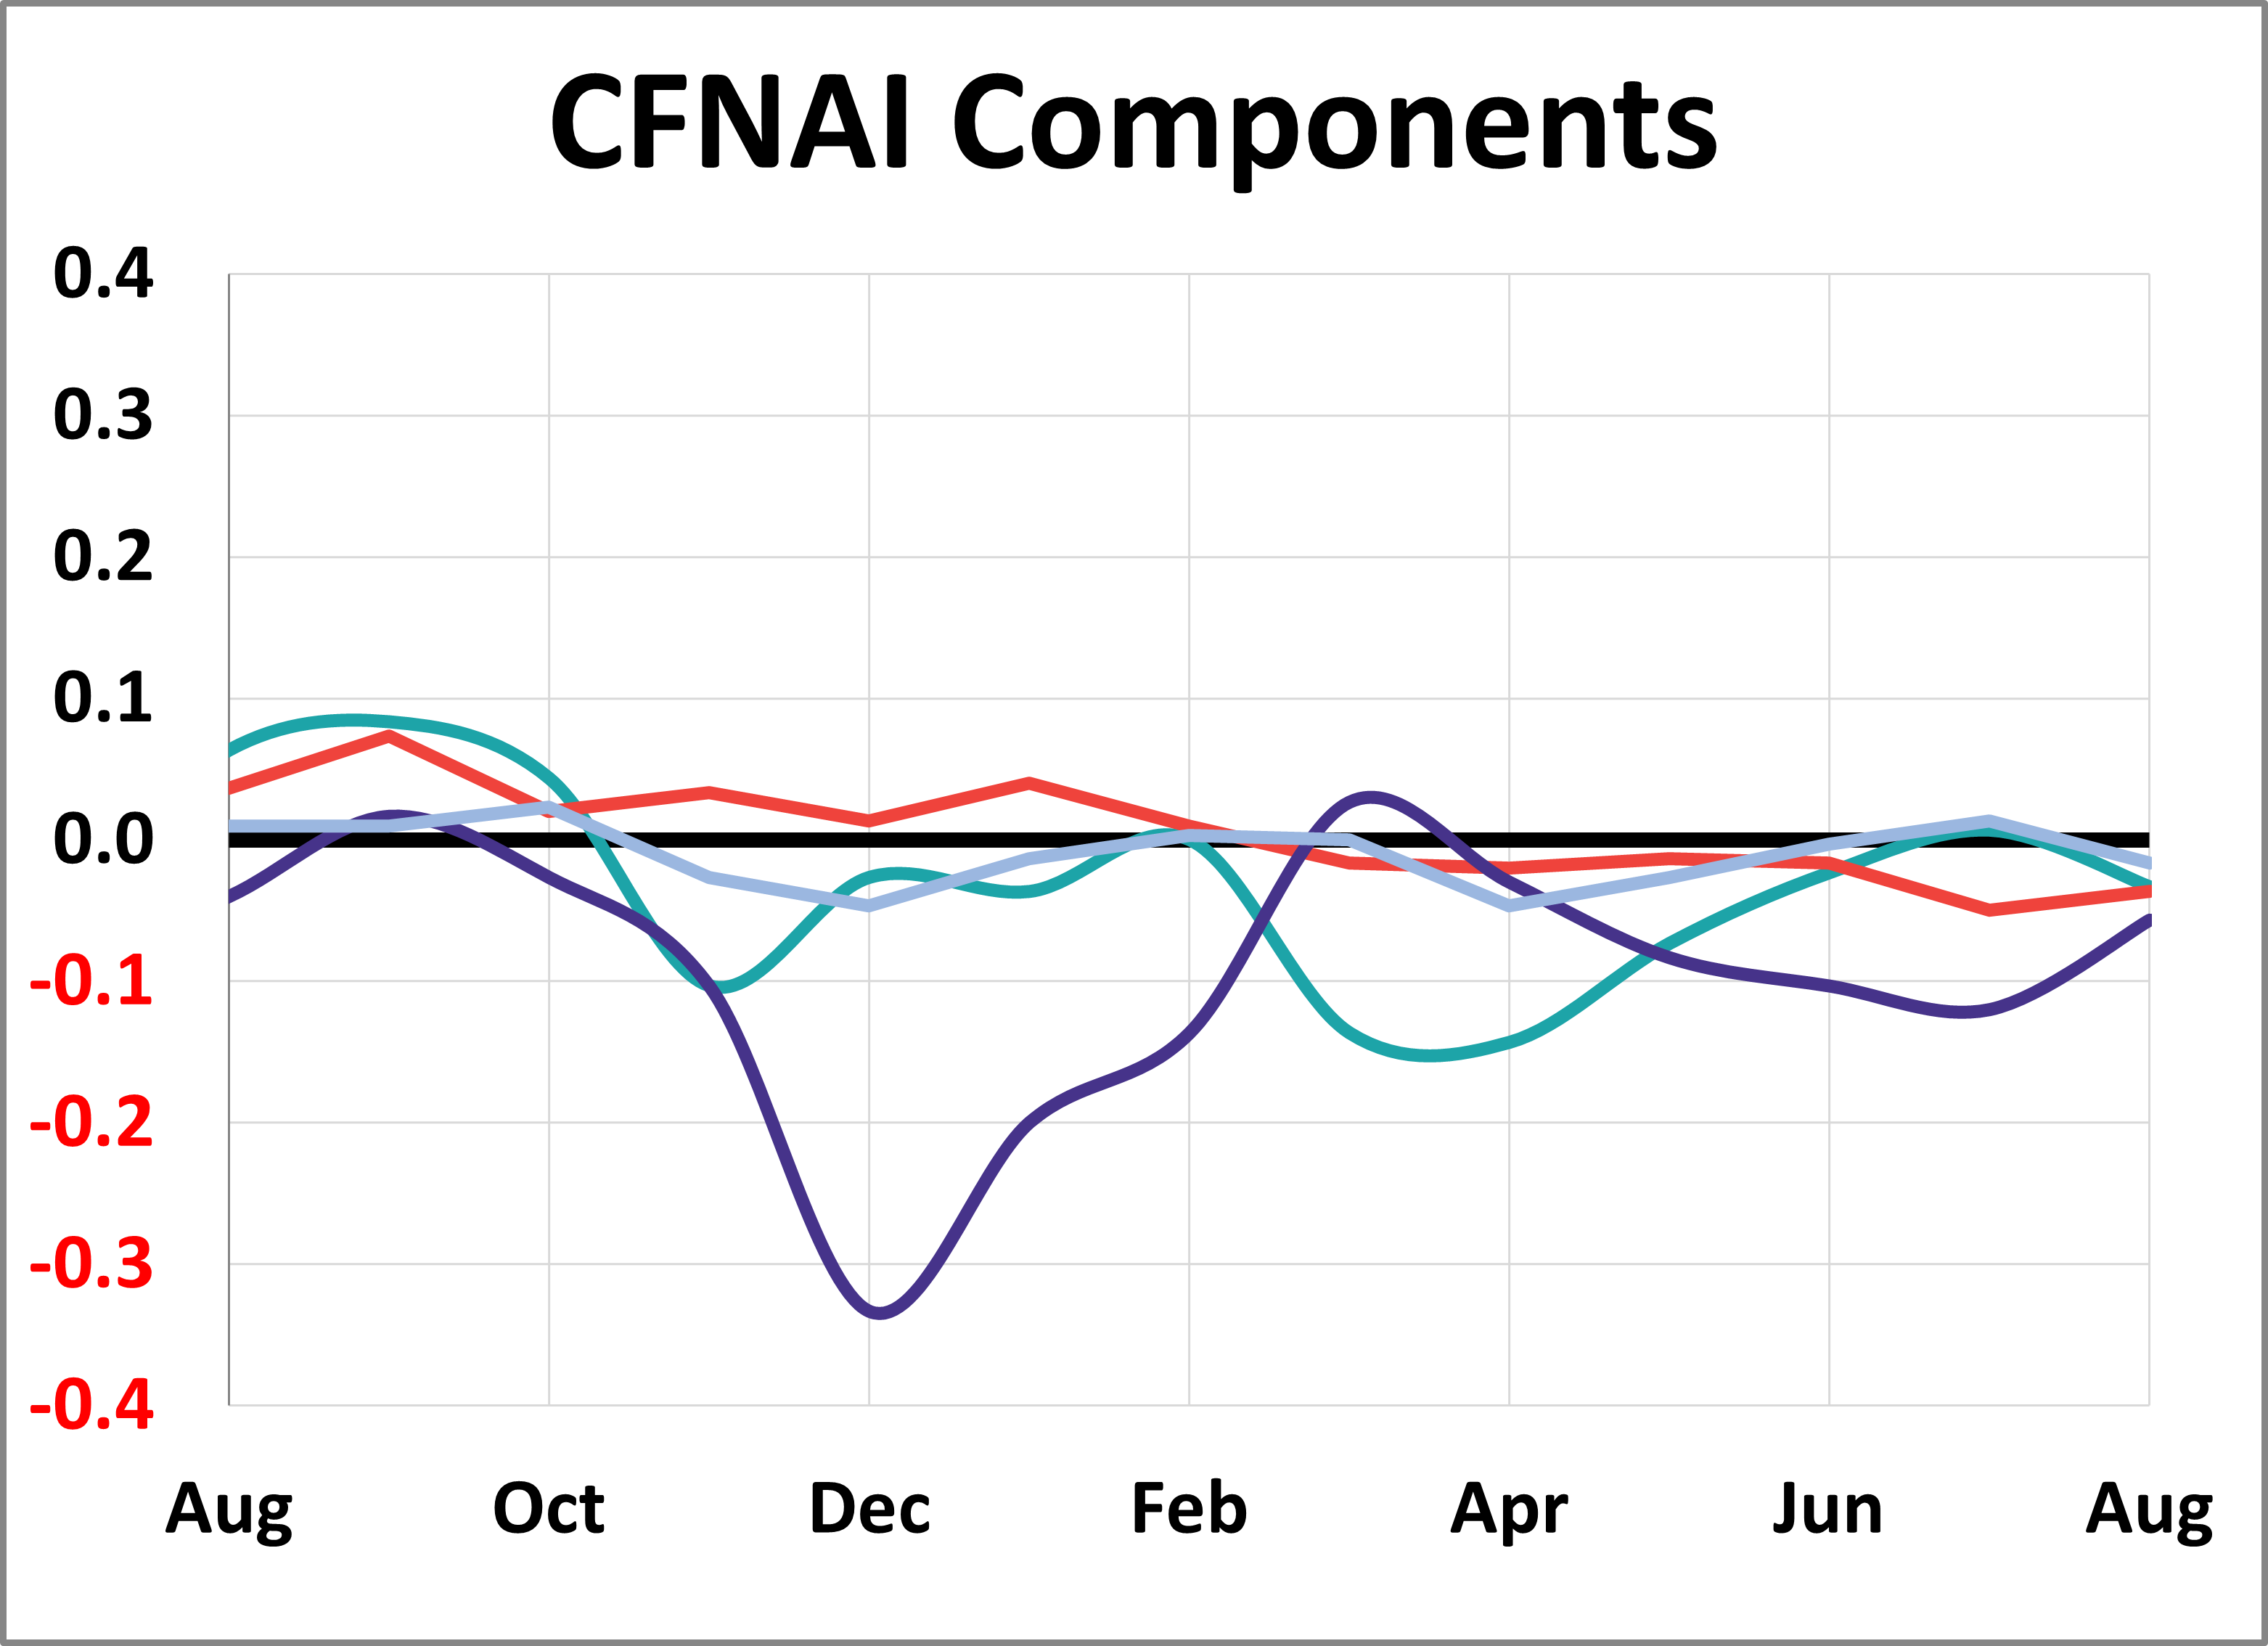
The Chicago Fed's National Activity Index is based on 85 economic indicators drawn from four broad categories of data. Two of the four broad categories of indicators used to construct the index decreased from July. All four categories made negative contributions in August.
A Long-Term Look: Residential Building Permits and Housing Starts
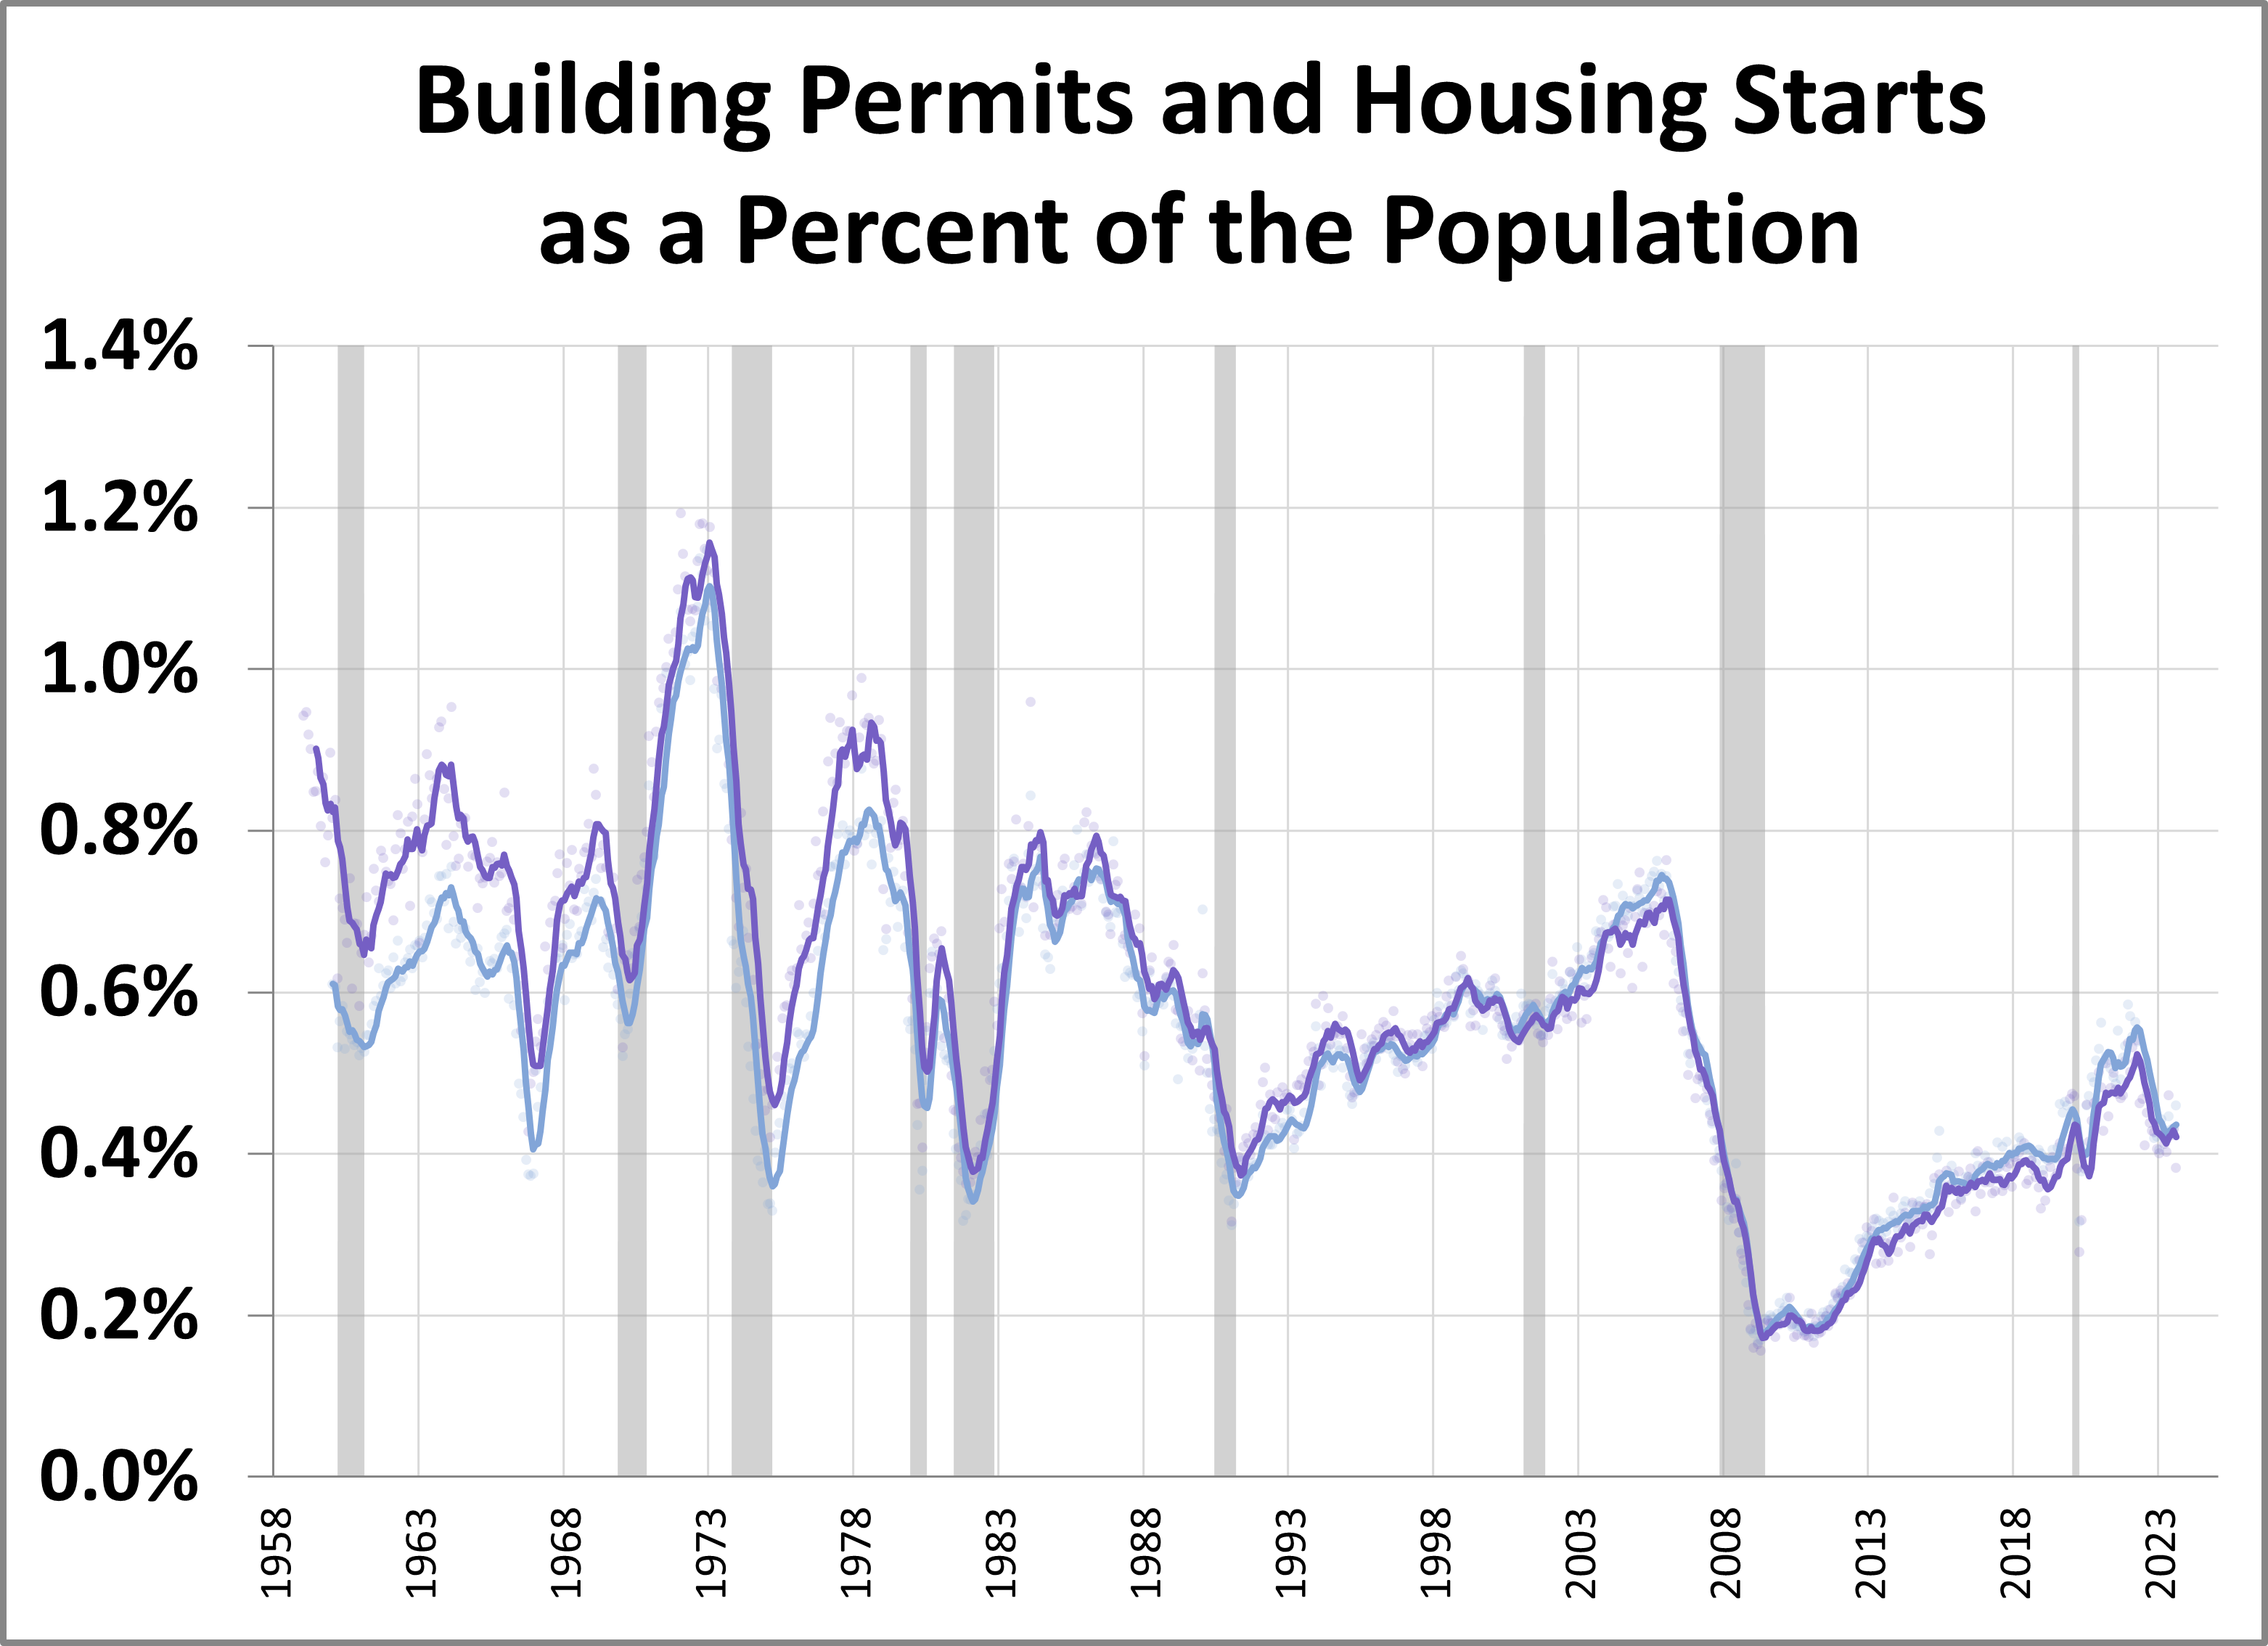
The U.S. Census Bureau and the Department of Housing and Urban Development published their August findings for new residential housing starts and building permits. Over the long haul, the two series offer a compelling study of trends in residential real estate. Here is an overlay of the two series since the 1959 inception of the starts and permits data, which was tracked beginning a year later.
Employment in Goods and Services Industries Since 1939
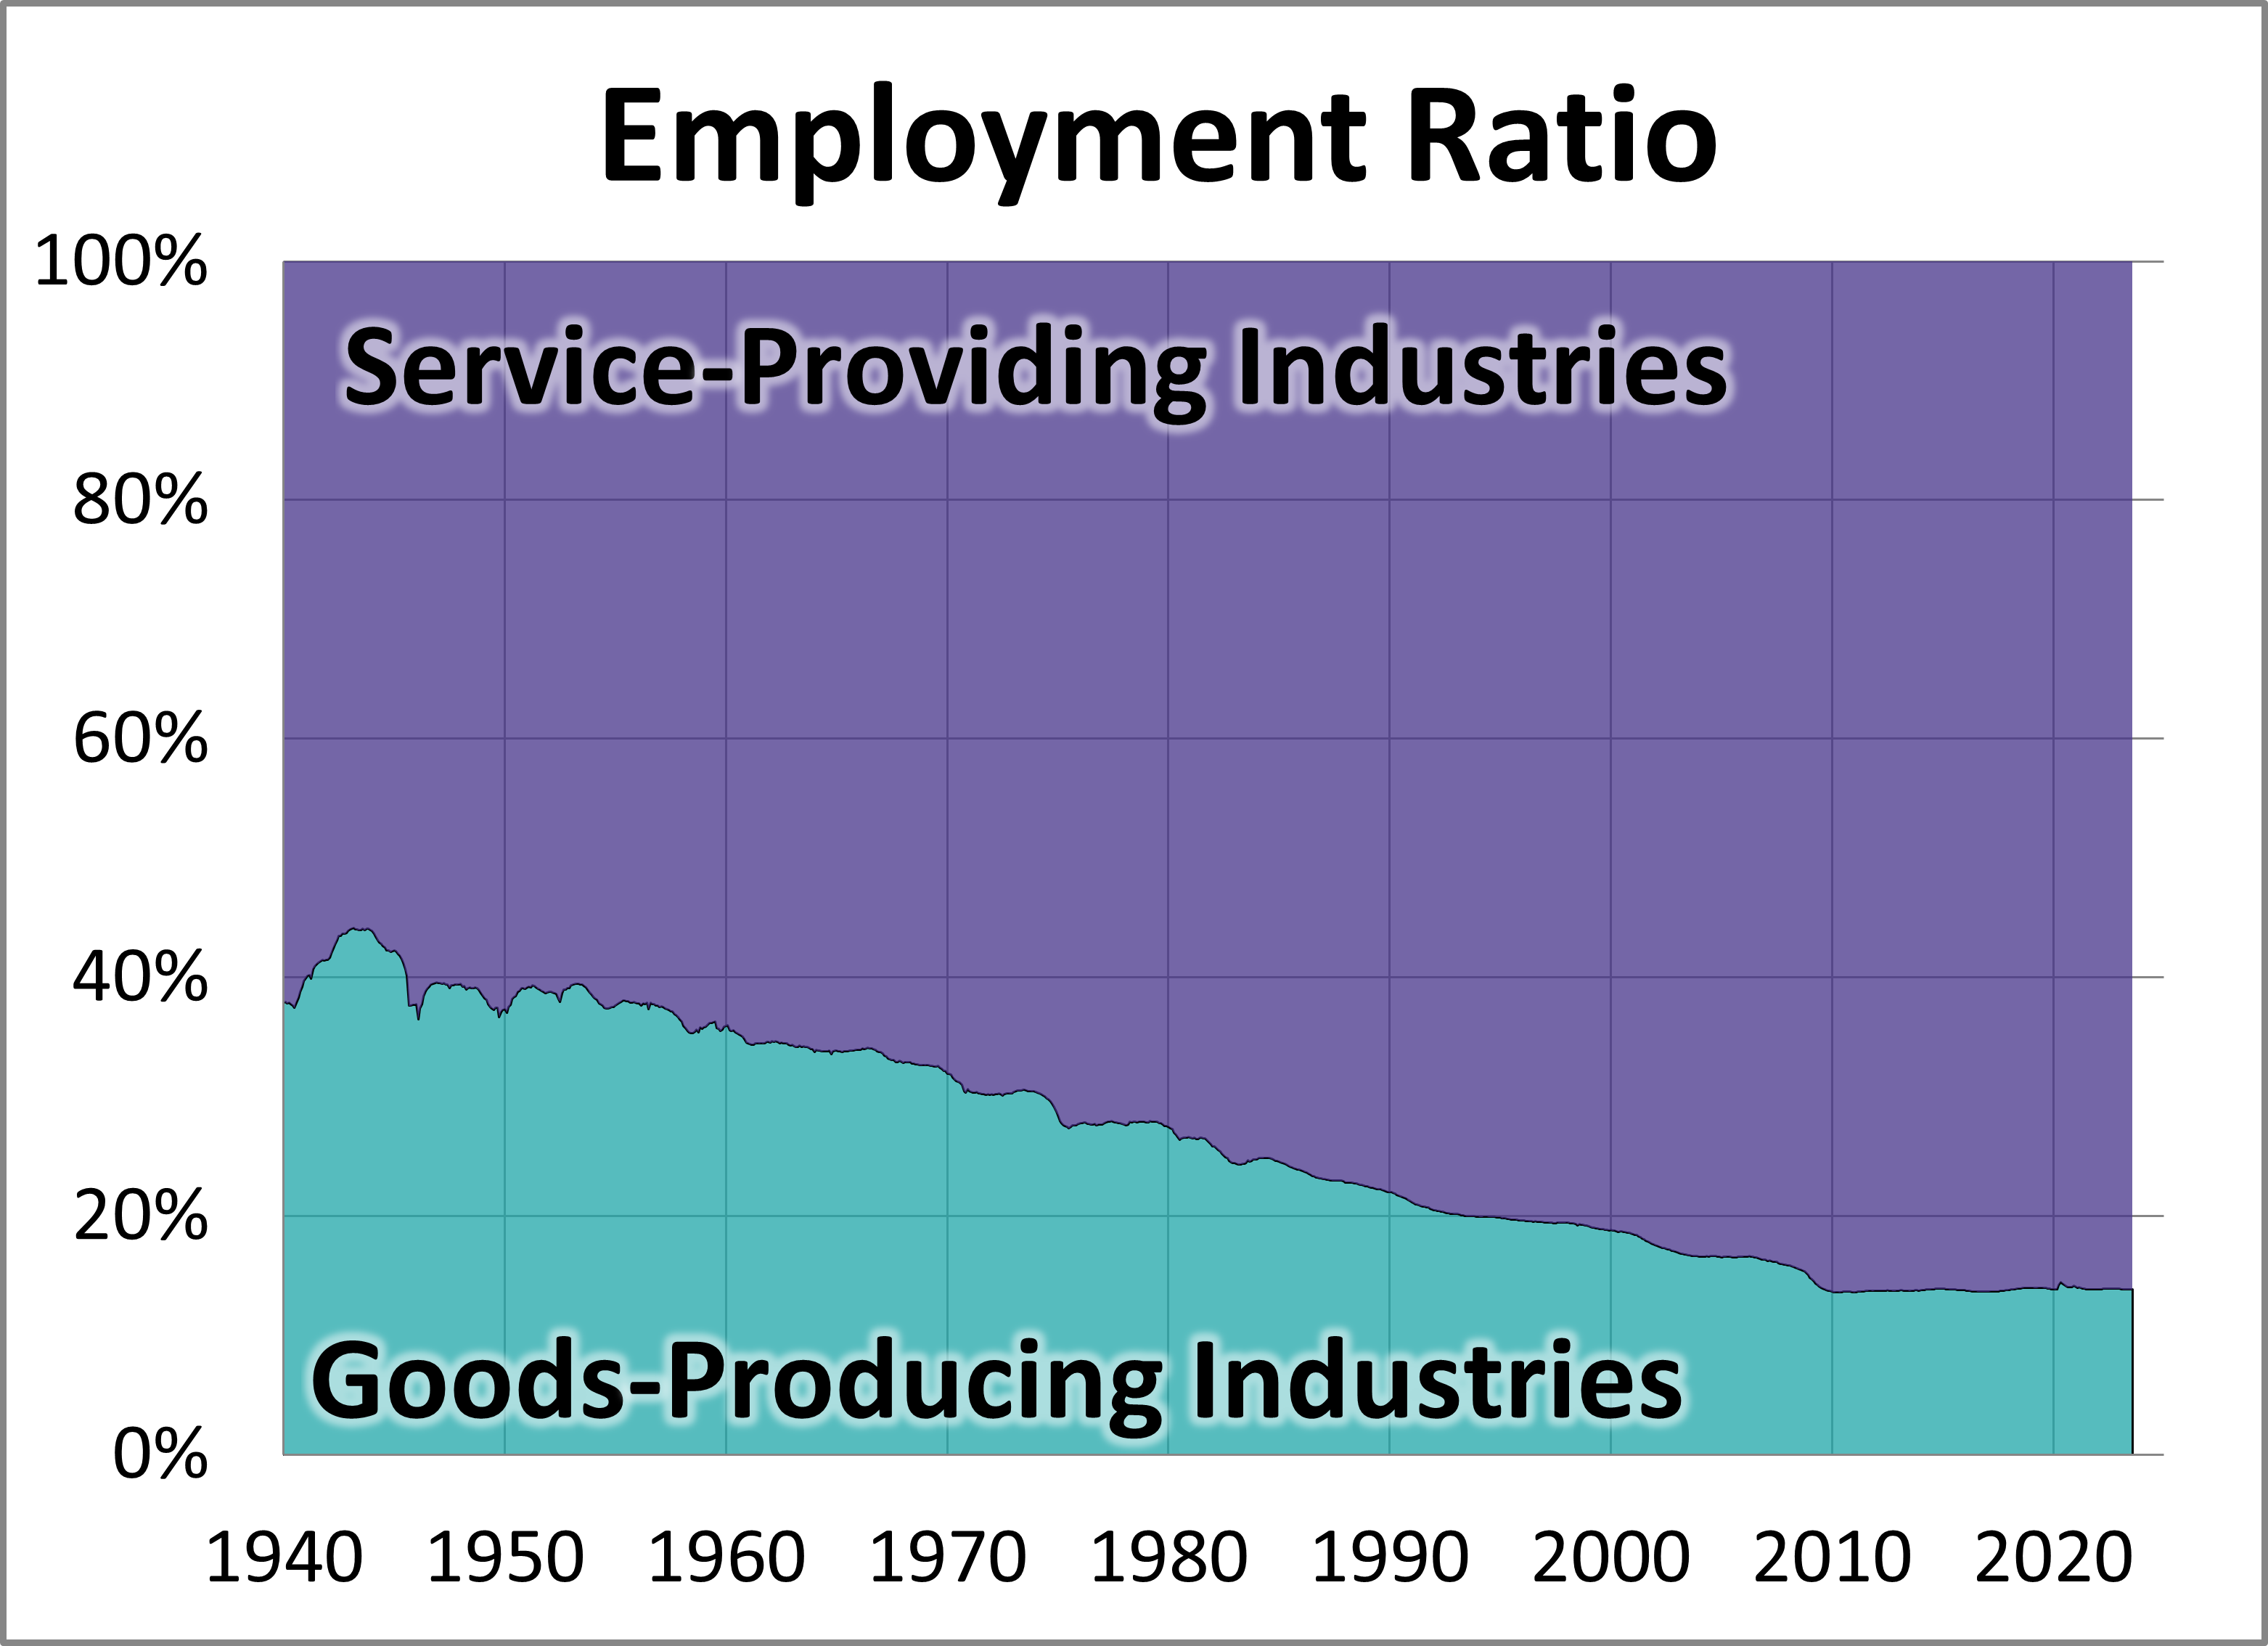
The latest monthly employment report showed 187,000 nonfarm jobs were added in August. An industry breakdown of that number shows a gain of 151,000 service-providing jobs and a gain of 36,000 goods-producing jobs.
Top 10 AP Charts of 2022

Here's the top 10 most popular AP Charts of 2022.
