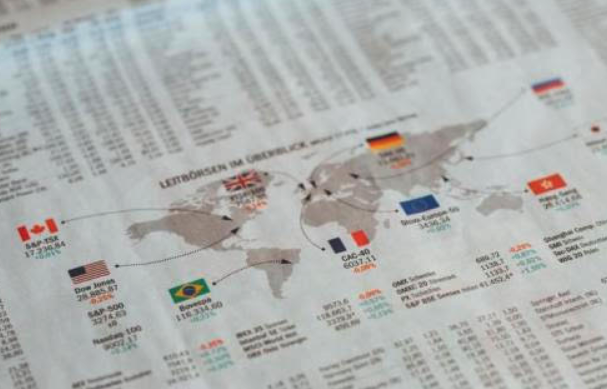
Recent data shows that even after strong international stock performance year-to-date U.S. stock markets continue to dominate global equity indexes, representing around two-thirds of the market capitalization of all global stocks, as represented by the MSCI All Country World Index (ACWI).
Sunday, October 12 marked the third anniversary of this bull market. Fast forward three years, and this bull market is still going strong. But will it continue? You may be surprised to know that bull markets lasting three years tend to keep going for a while.
For starters, much has been said about equity valuations, and stocks are definitely trading at elevated multiples. However, the forward price-to-earnings ratio (P/E) of the S&P 500 has yet to reach dotcom era levels, and in fact remains below December 2020 levels because earnings were depressed coming out of the COVID-19 pandemic. T
October 8 marks World Financial Planning Day, a global celebration highlighting the power and purpose of financial planning.
We believe corporate America will follow up an outstanding second quarter earnings season with another good one in the third quarter.
With the third quarter (Q3) behind us, we decided to conduct a deep dive into the key factors that shaped Q3 performance. Below, we’ve highlighted what we believe to be 10 of the key takeaways.
Despite a weaker end to the month, the equity market “melt-up” successfully navigated what has historically been a tricky month for equities, as represented by the S&P 500 in September (average returns -0.61%), closing out the month (as of September 29) with a handsome gain of over 3%.
LPL Research analyzes recent market performance as Fed expectations, strong economic data, government shutdown concerns and more continue to have an impact.
The Federal Reserve (Fed) delivered a highly anticipated 0.25% interest rate cut during its September 16-17 Federal Open Market Committee (FOMC) meeting.
As expected, the Federal Reserve (Fed) cut interest rates last week to take the fed funds rate down to 4.25% (upper bound). Moreover, through the release of the updated dot-plot, the Committee signaled that two more interest rate cuts could be appropriate this year, which would take the fed funds rate down to 3.75% (upper bound).
During last week’s press conference after the Federal Reserve’s (Fed) rate decision, Chairman Jerome Powell warned his audience there is no risk-free path for interest rates right now.
The summary of economic projections and “dot plot” that reveals where members of the Federal Open Market Committee (FOMC) expect the economy and rates to go in coming years will be interesting given the recent slowdown in job growth and relatively little upward pressure on inflation.
Global bond markets have sold off recently due to uncertainty surrounding key political changes most notably in France and Japan.
A key theme dominating global financial markets in recent weeks has been the general upward pressure on sovereign bond yields, particularly at the long end of government bond market curves.
With just a week remaining until the highly anticipated September Federal Open Market Committee (FOMC) meeting, Wednesday’s wholesale inflation print and Thursday’s consumer inflation results for August are the last major hurdles lying between the expected resumption of the FOMC easing cycle.
LPL Research sees bull market strength as stocks follow recovery trends, with AI growth, Fed cuts, and economic resilience driving upside.
Late last Friday, the Court of Appeals for the Federal Circuit (CAFC) largely affirmed the Court of International Trade’s (CIT) May ruling blocking President Trump’s tariffs imposed under the International Economic Emergency Powers Act (IEEPA).
401(k) Day, celebrated annually on the Friday after Labor Day, is more than just a reminder to check your retirement account.
The financial markets often shift gears in September, moving away from the quiet summer months marked by low trading volumes and limited volatility, and entering a period historically associated with seasonal weakness and increased market instability.
According to recent analysis from the Congressional Budget Office (CBO), tariff revenue could meaningfully impact both sides of the bond market pendulum, which on net, could be beneficial to the Treasury market.
As central bankers, economists, and policymakers gathered last weekend in Wyoming’s Grand Teton National Park for the 2025 Jackson Hole Economic Symposium, the Federal Reserve (Fed) found itself at a critical juncture marked by political pressures, personnel changes, and internal divisions over monetary policy direction.
Second quarter earnings season, which winds down this week and next, has met some of the highest expectations. Strong beat rates, big upside earnings surprises, and increases in estimates during the past four weeks were consistent themes that gave investors very little to complain about.
July’s Consumer Price Index (CPI) report showed headline year-over-year inflation remained steady at 2.7%, below the anticipated level of 2.8%.
With 90% of S&P 500 companies having reported second quarter results, corporate America has handily topped expectations, displaying resilience in the face of a challenging policy environment.
We have been pleasantly surprised by how well stocks have handled the sharp increase in tariffs. Since the market low from the early April tariff scare, the S&P 500 Index has gained more than 28%.
The U.S. Dollar Index (DXY) has rebounded over the last month following its worst first half since its inception in 1973.
Volatility across major asset classes is currently sitting at unusually low levels. While volatility is often viewed as a broad measure of risk in financial markets, its role has evolved significantly in recent years.
With a week as jam-packed with economic data, earnings, and events as last week, it’s no surprise it ended with a bout of volatility.
On July 4, President Trump signed into law the “One Big Beautiful Bill Act (OBBBA)”, a far-reaching piece of legislation that will impact the U.S. investment landscape for years to come.
Today’s LPL Financial Chart of the Day spotlights the seasonal setup for stocks in August.
LPL Financial LLC announced today that financial advisor Steve Jones of Tenacity Investment Group has joined LPL Financial’s broker-dealer, Registered Investment Advisor (RIA) and custodial platforms.
Outlook 2024: A Turning Point, released in December 2023, featured our perspective on how stocks might respond to turning points in inflation and monetary policy.
Oil has entered a new uptrend after finally breaking out from nearly a year-long bottom formation. Support from OPEC+, notably Saudi Arabia’s one million barrel per day production cut for the remainder of the year, has been a major driver of the rally.
It’s a bull market for pessimism right now.
It’s a bull market for pessimism right now. We know the list of concerns is long and includes an aggressive Federal Reserve with a spotty (and that’s putting it kindly) track record of navigating a soft landing, stagflation, ongoing China lockdowns, disrupted supply chains, overly optimistic earnings estimates, the ongoing Russia-Ukraine war, and the latest—failing crypto firms.
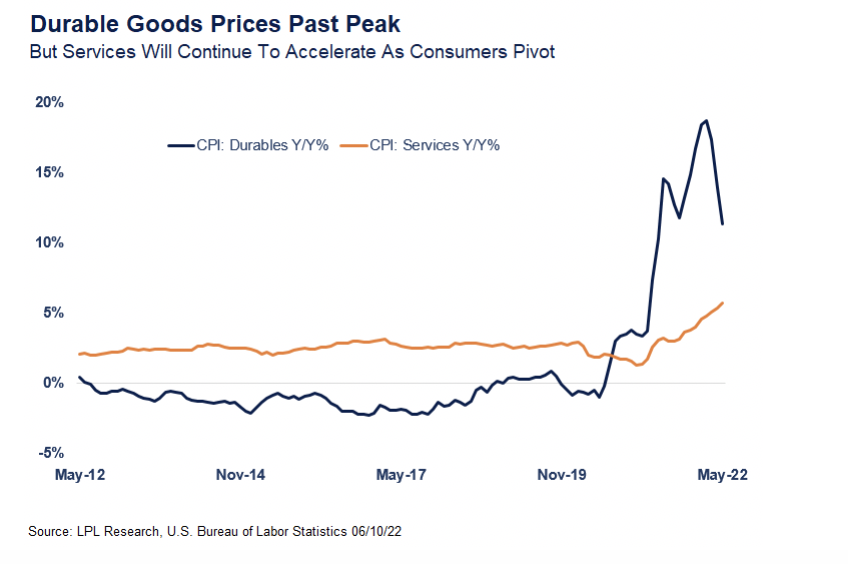
Before we think about the hypothetical new world order that global inflation may enter, let’s start with the good news within the United States.
Headline inflation in May rose 8.6% from a year ago, accelerating from April’s 8.3% growth rate.
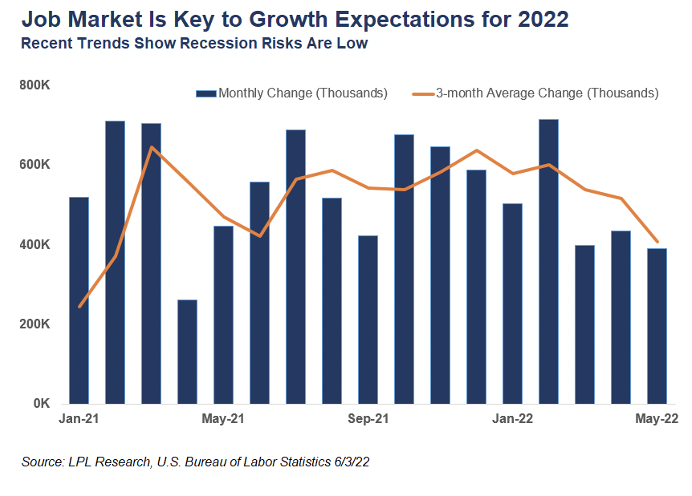
LPL Research looks at the May jobs report and its impact on markets and Federal Reserve (Fed) policy.
The near-10% correction in the S&P 500 Index and even larger drawdown in the Nasdaq have gotten a lot of attention this year.
Several policy-related risks loom in September and October that may lead to an increase in market volatility. The debt ceiling needs to be raised (likely by mid-October), the government needs to be funded to avoid a shutdown by the end of September...
More than most years, it’s hard to look ahead to the next year, to 2021, without looking back at 2020. A global pandemic, a massive economic collapse, a bear market, a surprisingly sharp reversal, a hotly contested election where passions ran high, the impact of lockdowns—it was an unusual year of extraordinary challenges.
At LPL Research, we know the stock market is forward-looking: It focuses on what’s happening today and what it sees on the path ahead. Much of the real-time economic data we follow—such as transportation activity, home sales, and jobless claims—is showing tangible evidence that economic activity—while still depressed—has begun to make a comeback.
This earnings season will be unlike any other, as travel restrictions and lockdowns related to COVID-19 have impacted results dramatically. The biggest economic hits came in mid-March, however, and won’t be fully captured in first quarter results.
A late month selloff in January saw the S&P 500 Index close marginally lower for the month. But stocks have taken off in February, with the S&P 500 up nearly 4% this month, as US economic data remains strong and fears over the worst-case scenarios for the coronavirus appear overblown.
The good news is August is finally coming to a close, but the bad news is that September is next. Since 1950, September has been the worst month for the S&P 500 Index, which has dropped an average of 0.5% during the month.
A closely watched point on the Treasury yield curve has fallen negative for the first time in this economic cycle.
We expect stocks to move higher over the second half of the year. Stocks already have had quite a run in 2019, buoyed by a return to fundamentals, with the S&P 500 Index up 17.4% year to date through June 28 for an 18.5% total return.
In today’s Weekly Market Commentary, we share our “Final Four Factors” for the stock market in 2019: policy, the economy, rates, and profits. While we expect a hard-fought battle between these factors and, with it, some market volatility, we still see the potential for further gains for stocks this year.
The S&P 500 Index is off to its best start in years, but this is on the heels of the worst year for stocks since 2008. The trifecta of crashing oil prices, confusion from the Federal Reserve (Fed), and trade issues with China all pushed equities lower by 14% during the usually bullish fourth quarter last year...
Investors’ obsession with the flattening U.S. Treasury yield curve dominated headlines for much of 2018. A flattening yield curve occurs when short-term rates are rising faster than long-term rates, which may eventually lead to an inverted yield curve, where short-term rates are higher than long-term rates. Historically, this has been a negative signal for the U.S. economy, often providing an early warning of an eventual recession, which is why the yield curve has been garnering so much attention recently.