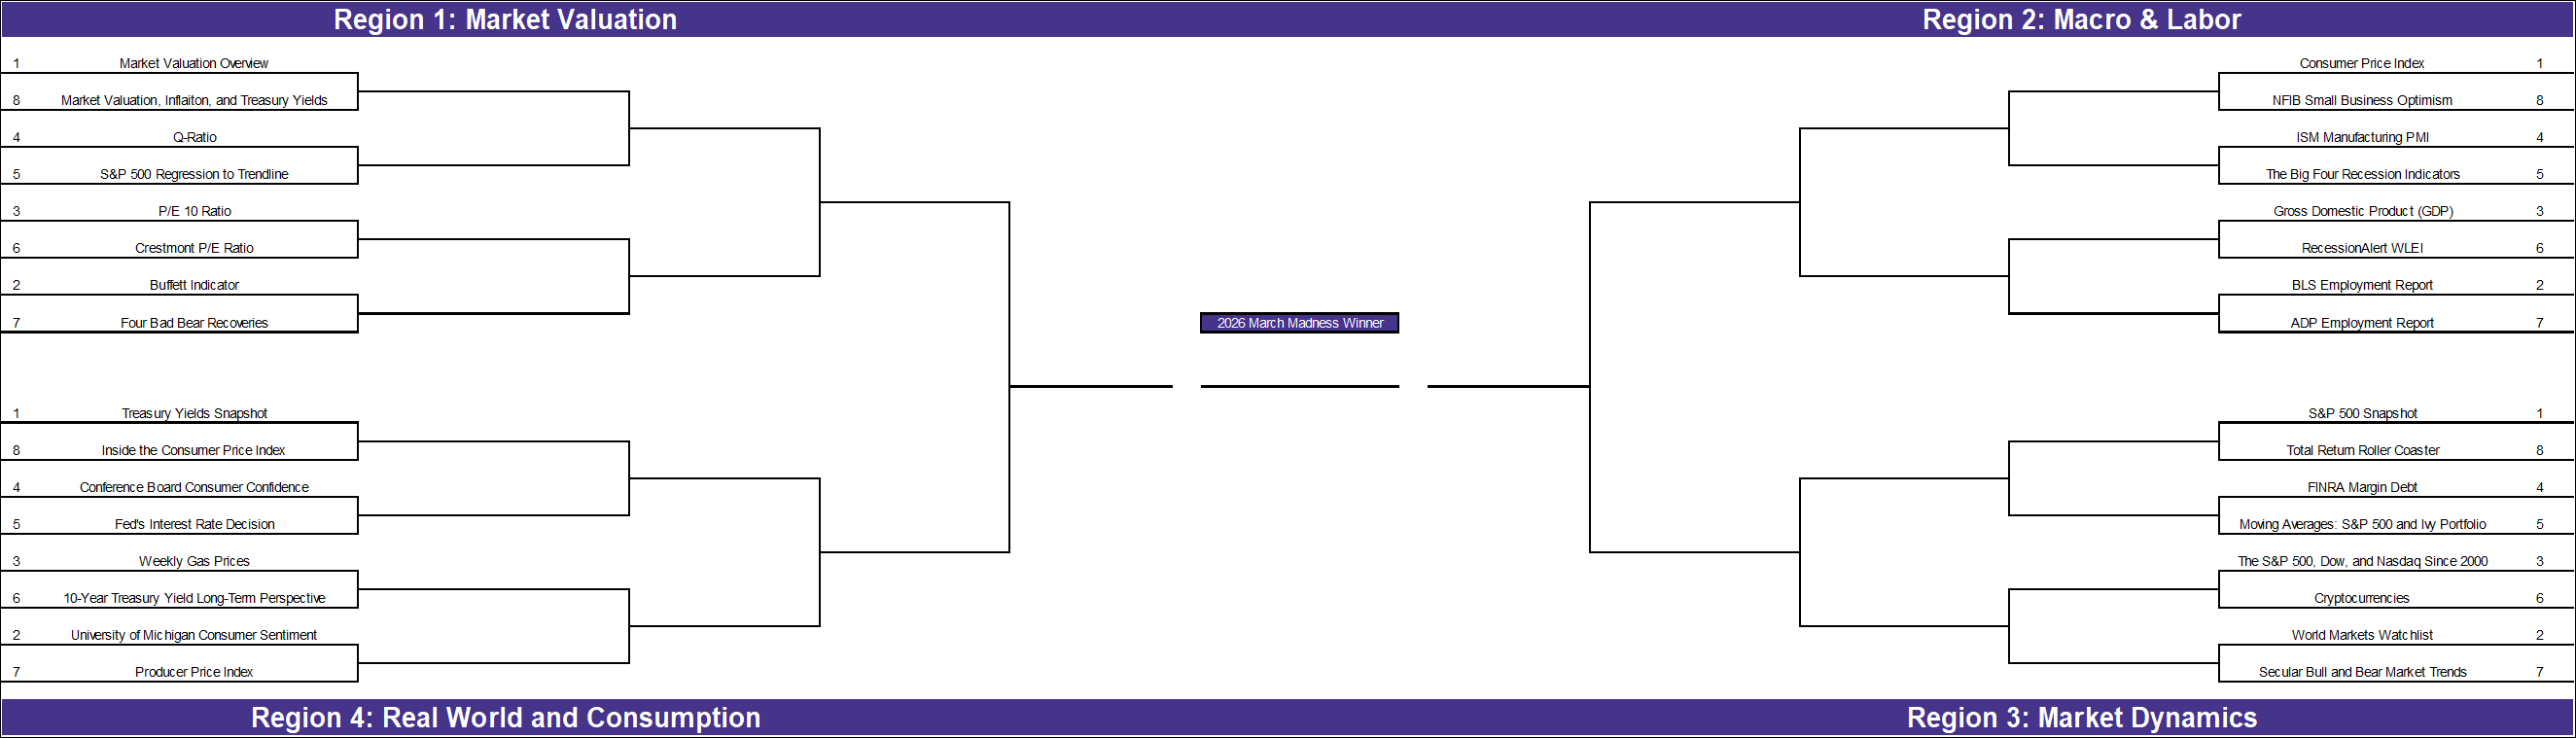
With the NCAA tournament beginning in just a few days, we’ve applied the bracket format to our own research. While economic theory often dictates what should be most important to investors, our reader engagement reveals which topics truly commanded investor attention over the past year.
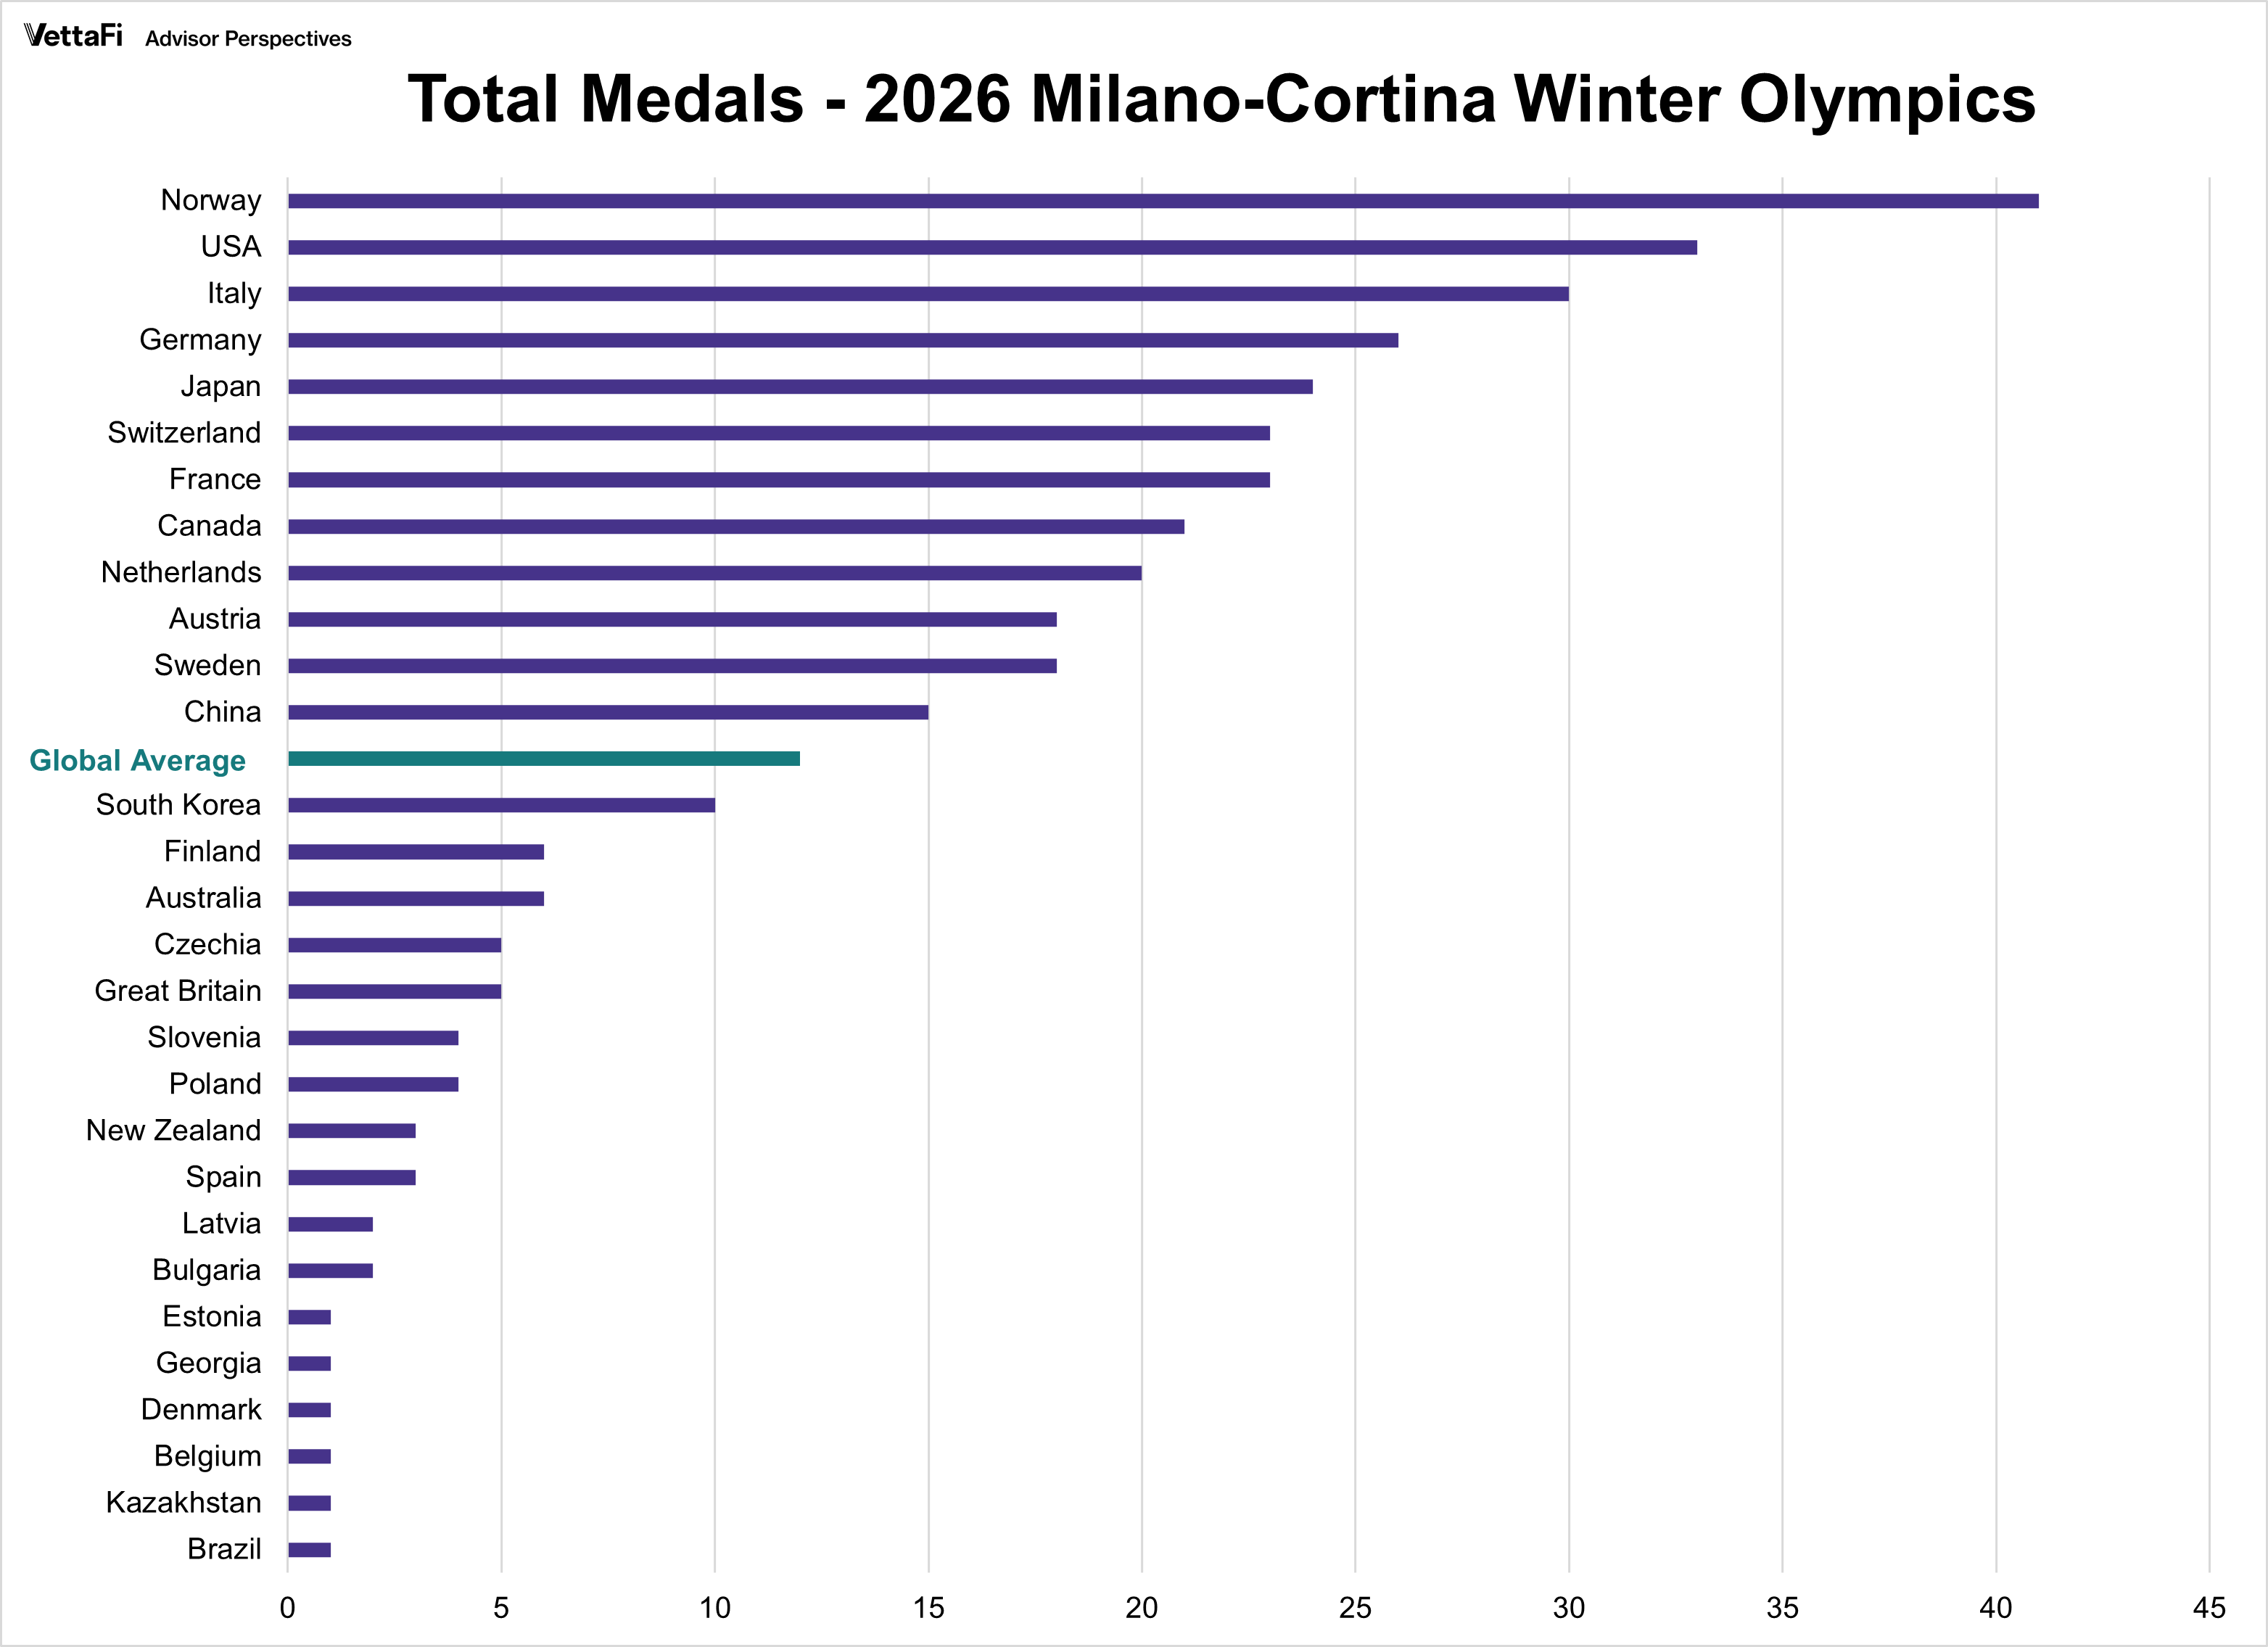
The Milano-Cortina 2026 Winter Games concluded with a familiar hierarchy at the top of the medal table. But in the world of economic indicators, we rarely look at totals without normalizing for scale. The 2026 Winter Games are no different.
The U.S. economy sent conflicting signals last week as a sharp deceleration in growth collided with unexpectedly stubborn inflation.
The U.S. economy began 2026 with a display of unexpected resilience in the labor market and cooling inflation.
The U.S. labor market showed further signs of cooling last week as private sector hiring slowed and job openings reached their lowest levels in over five years.
The final week of January saw a stark divergence between official policy and the American consumer's outlook. While the Federal Reserve maintained a "solid" view of economic growth, the public’s mood plummeted to a decade-low as sticky amid sticky wholesale inflation.
The U.S. economy continues to display a complex mix of resilience and persistence. As markets brace for next week’s FOMC meeting, this snapshot breaks down the latest shifts in GDP, inflation, and consumer behavior.
As the second half of January begins, the U.S. economy presents a picture of cooling inflation and resilient consumer activity.
This video looks at the long term trends of household net worth using the Q3 2025 Z.1 release from the Federal Reserve.
Now that 2025 has come to an end, let’s take a look at the top 10 most-read charts of the year.
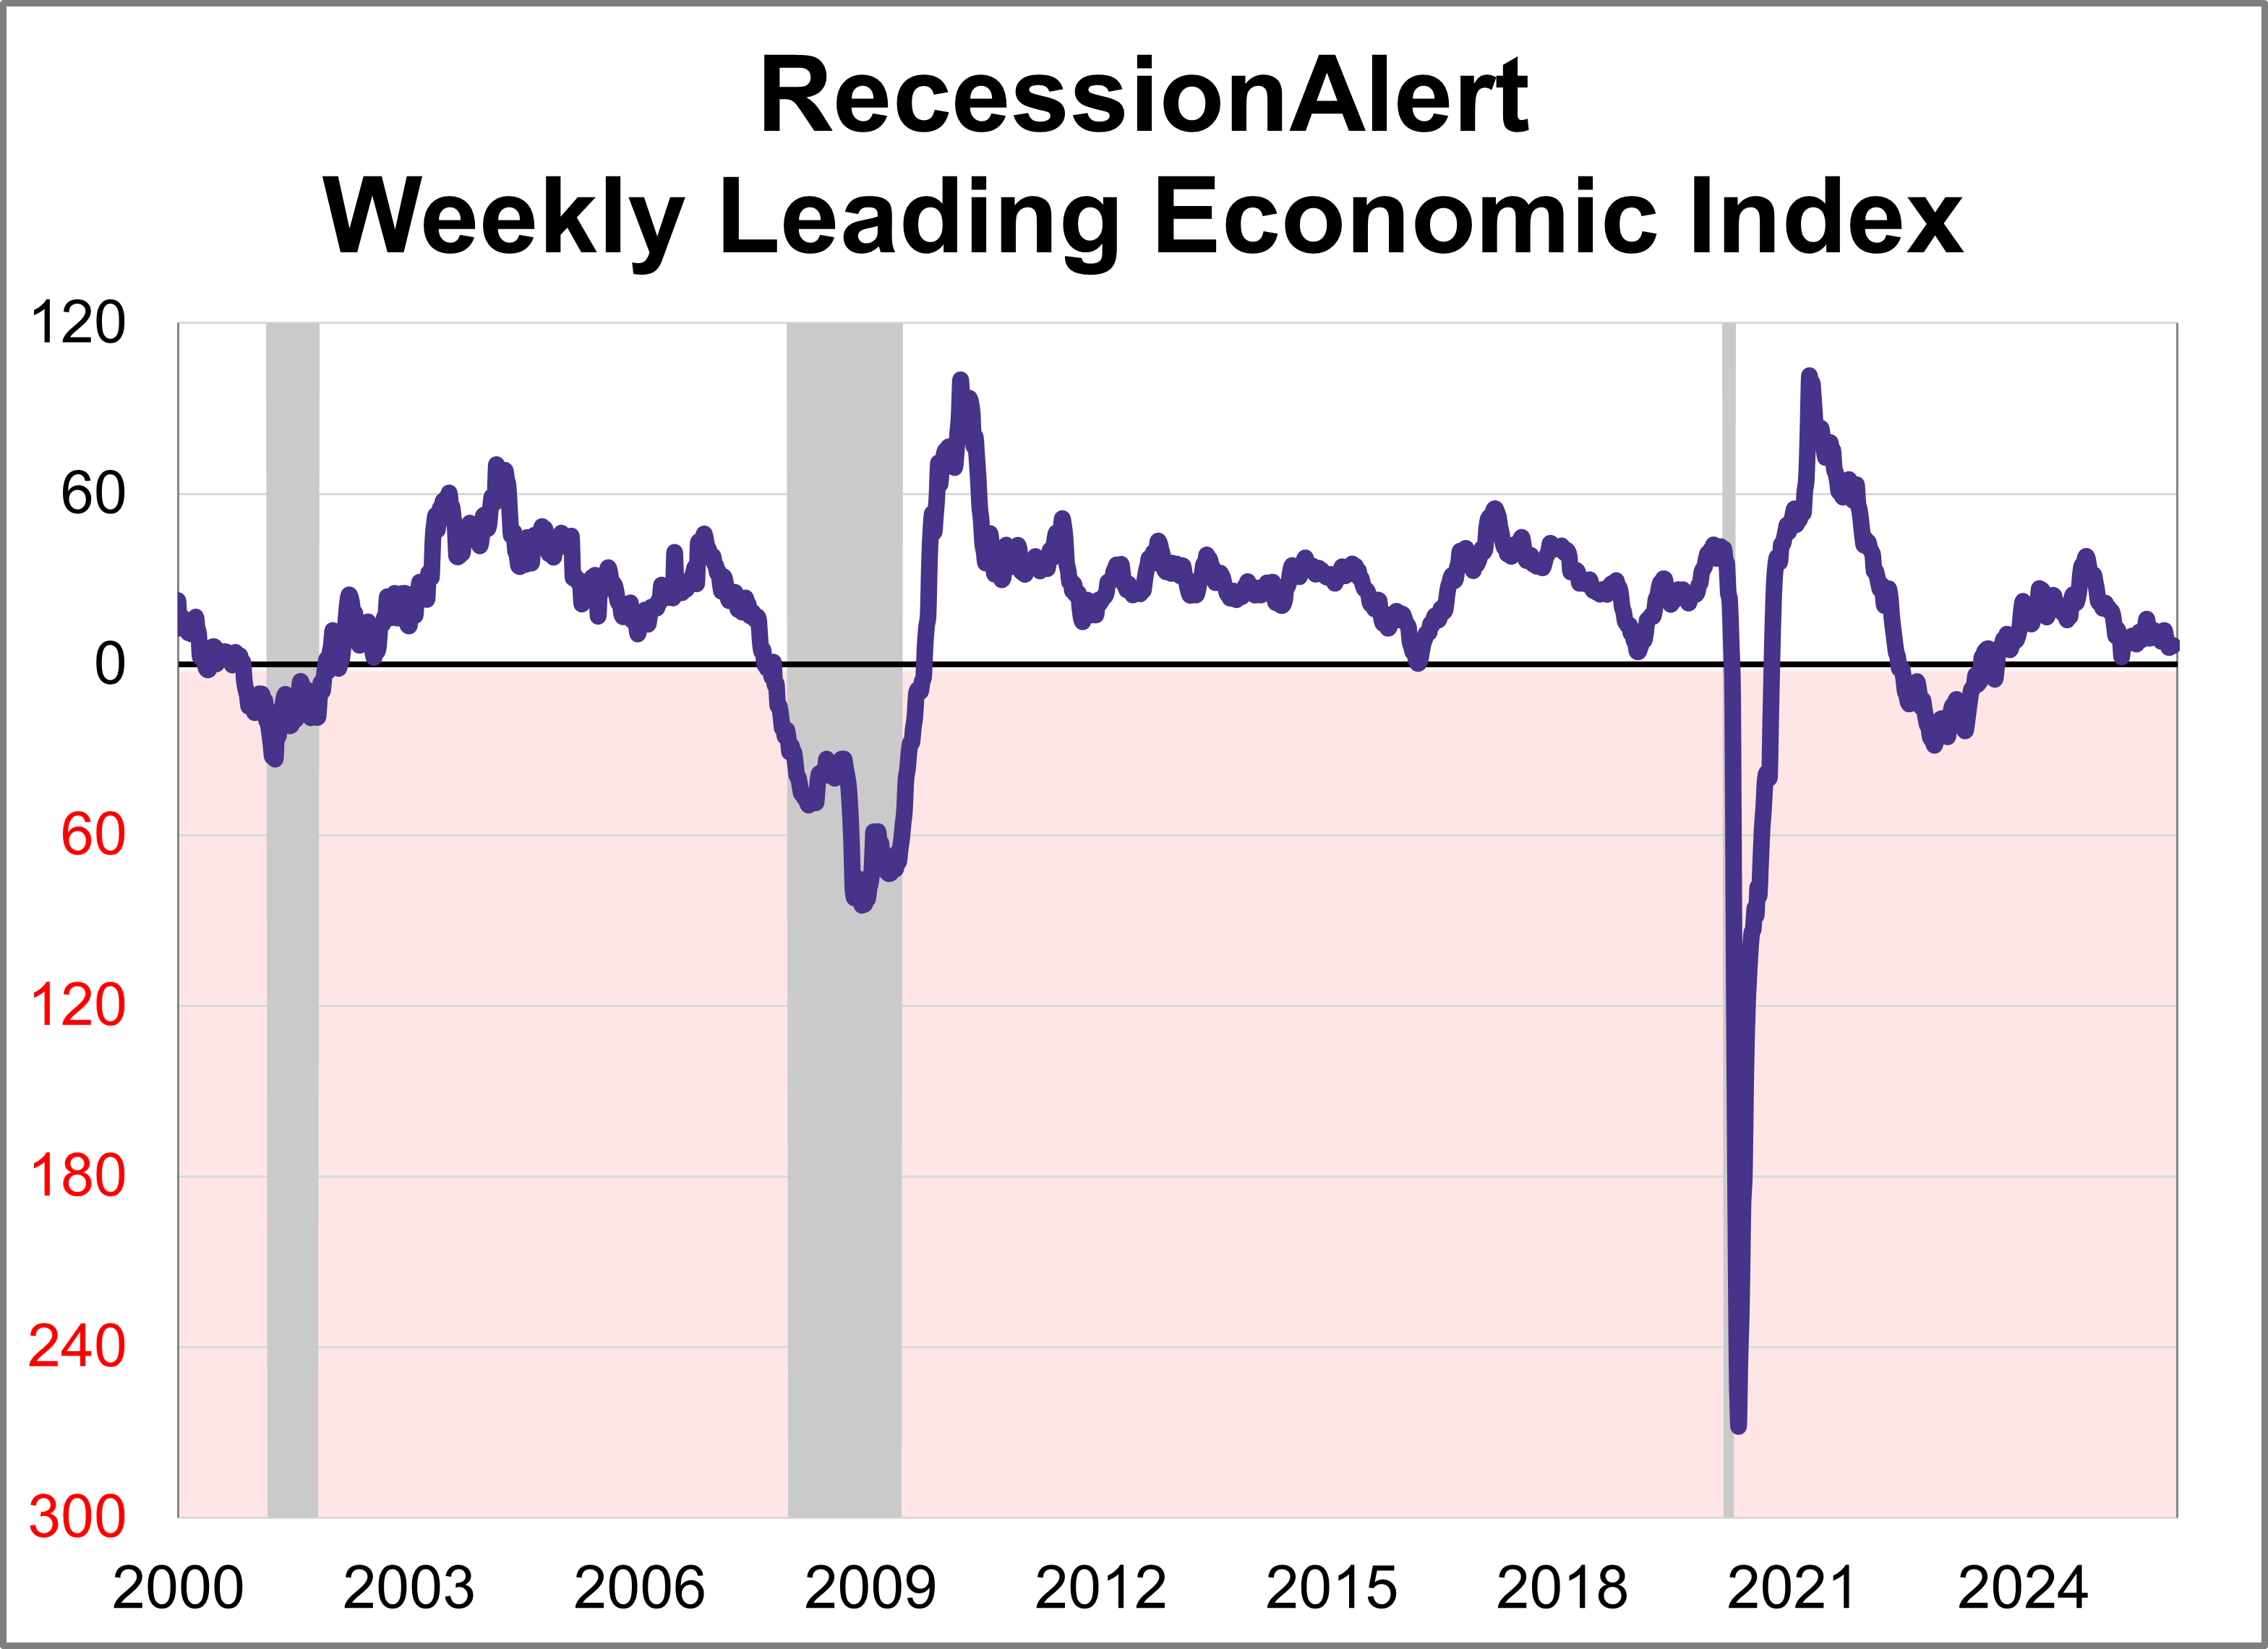
The weekly leading economic index (WLEI) is a composite for the U.S economy that draws from over 20 time-series and groups them into the following six broad categories which are then used to construct an equally weighted average. As of December 12th, the index was at 6.71 with 3 of the 6 components in expansion territory.
Our monthly workforce recovery analysis has been updated to include the latest employment report for November. The unemployment rate inched up to 4.6%, its highest level since 2021. Additionally, the number of new non-farm jobs (a relatively volatile number subject to extensive revisions) came in at 64,000.
This video examines key data from the BLS Employment Situation Report with data through November 2025.
The economic narrative last week was shaped by a highly anticipated Federal Reserve rate cut, which came against a backdrop of conflicting signals in the labor market.
The Federal Funds Rate (FFR) is the interest rate banks charge each other to borrow money overnight. It's set by the FOMC and is one of the Federal Reserve's primary tools to implement monetary policy and is a key driver of economic activity. This video examines the Federal Funds Rate and reviews the Fed's interest rate meeting on December 9-10th, 2025.
The economic narrative last week was dominated by a mix of cooling inflation and a softening labor market.
Market valuation: Is the market still overvalued?
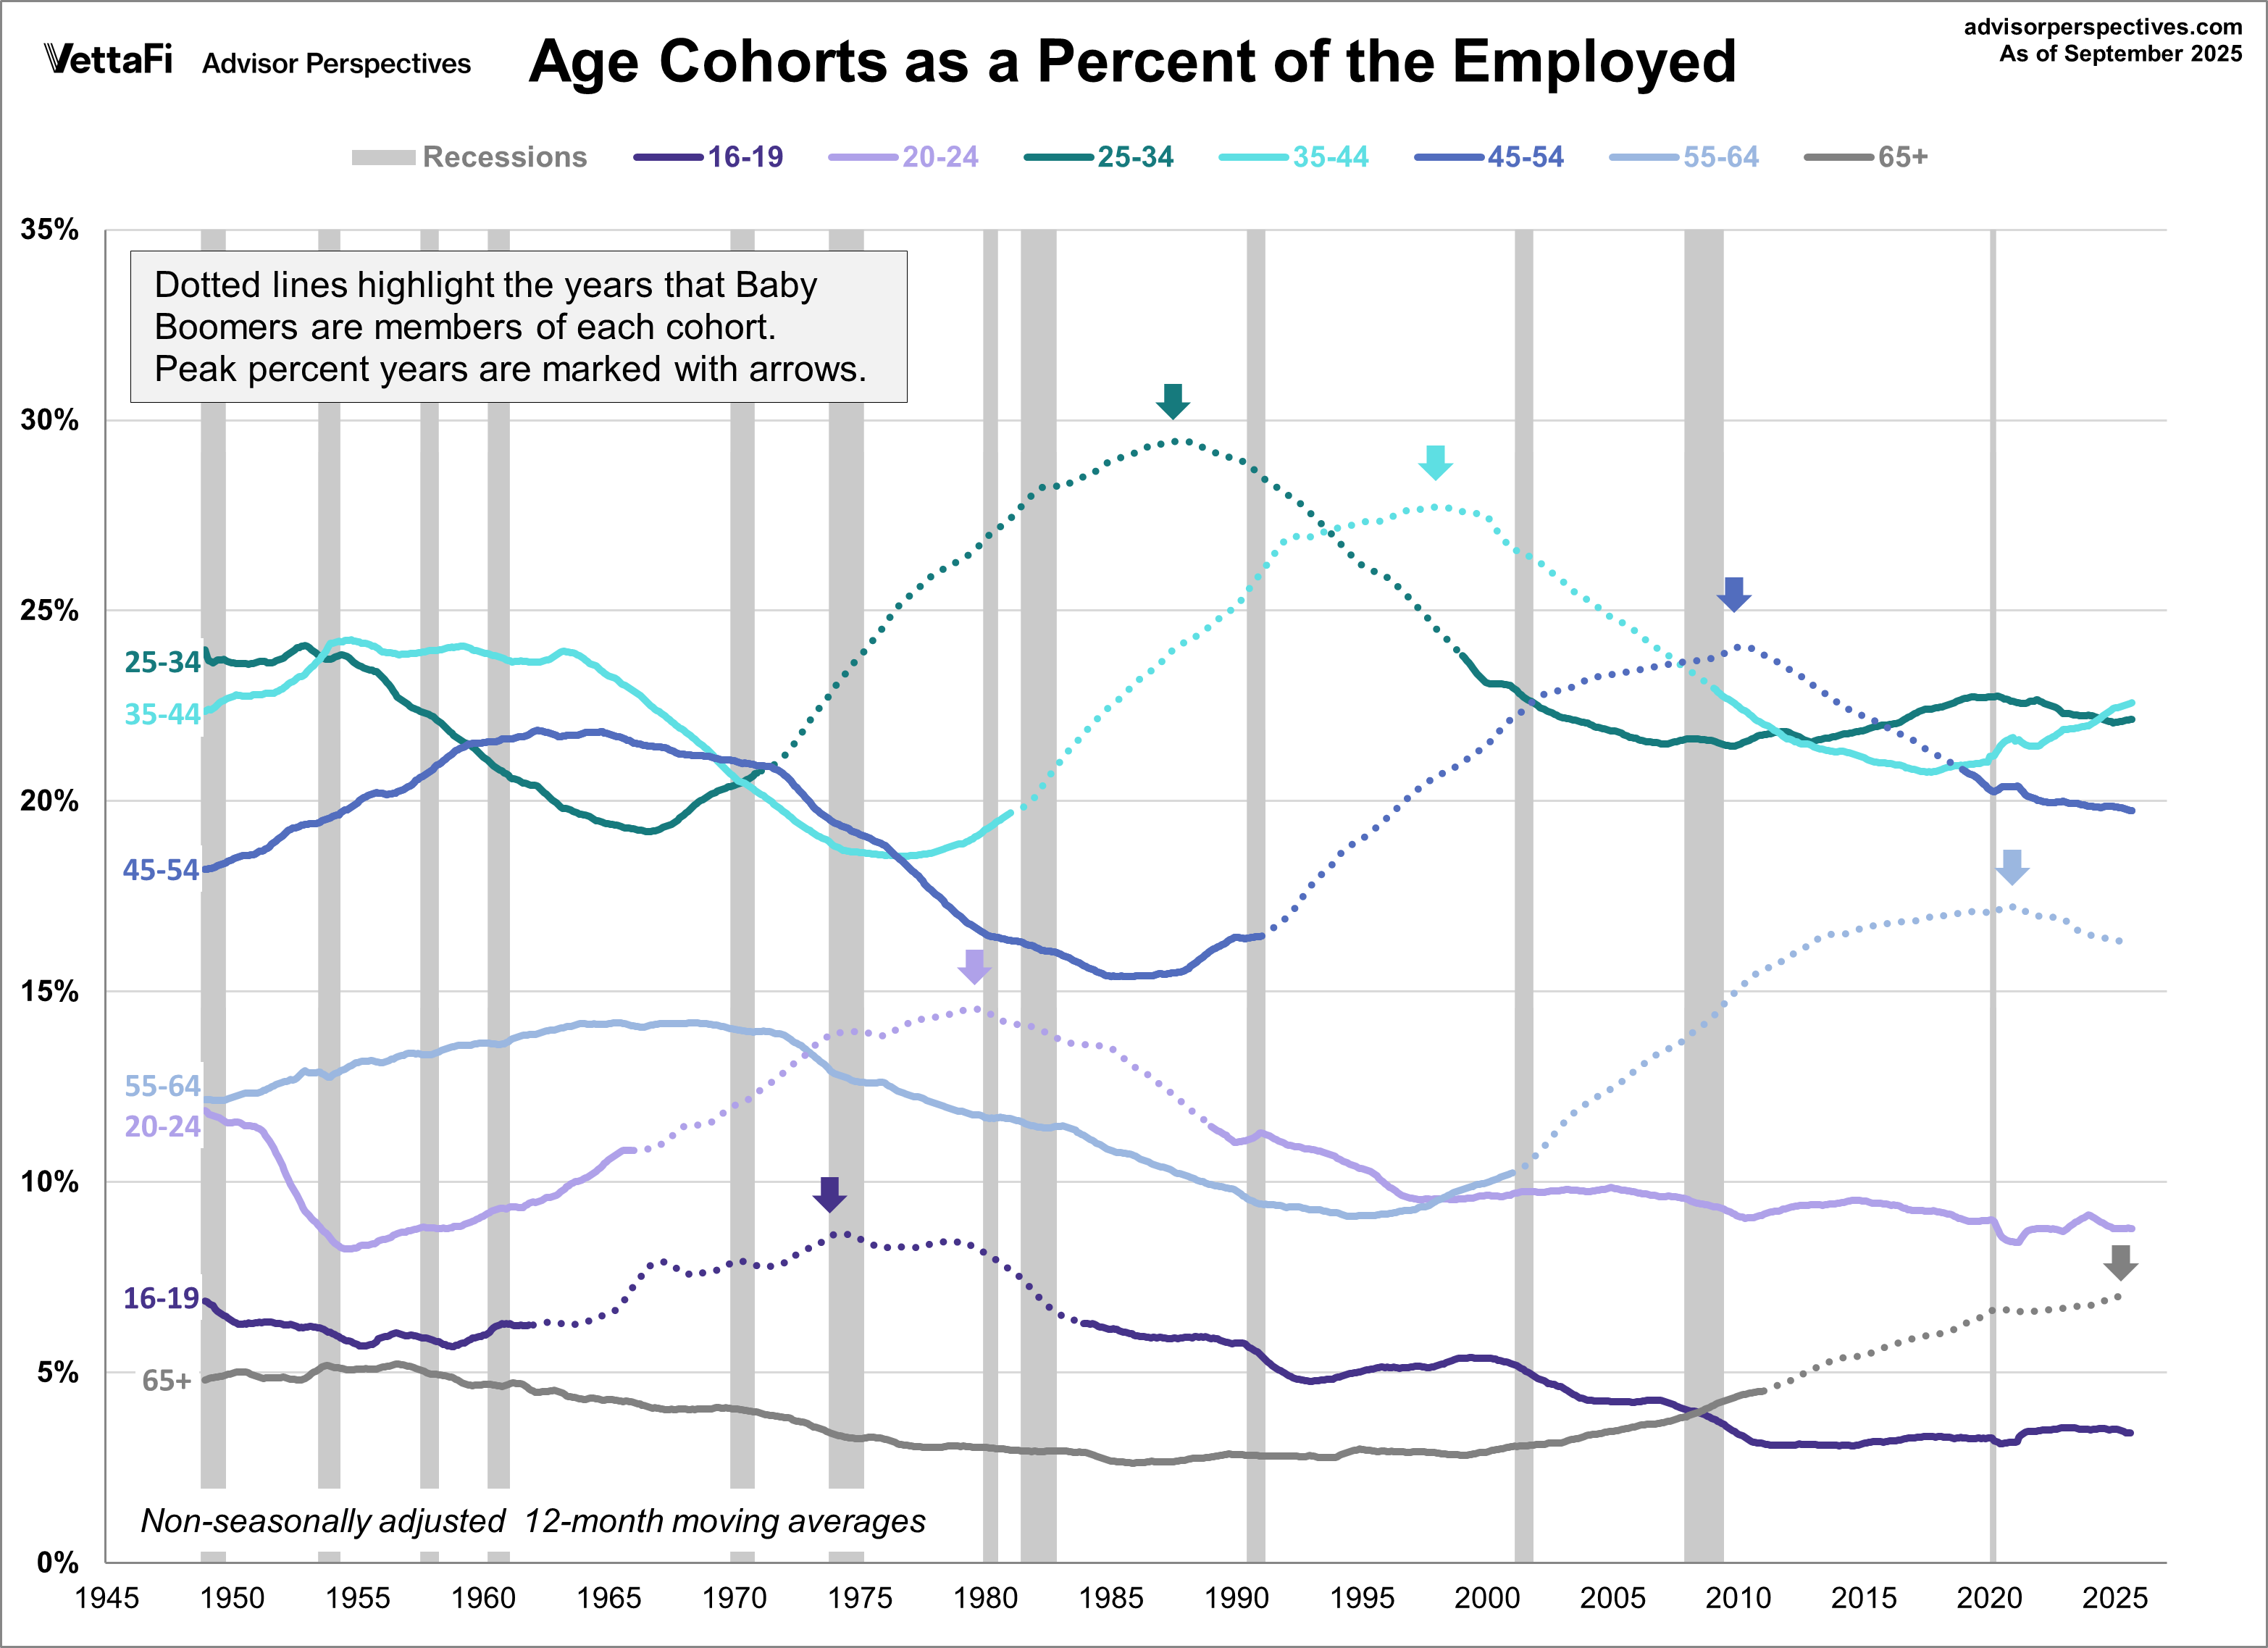
The 20th century Baby Boom was one of the most powerful demographic events in the history of the United States. We've created a series of charts to show seven age cohorts of the employed population from 1948 to the present.
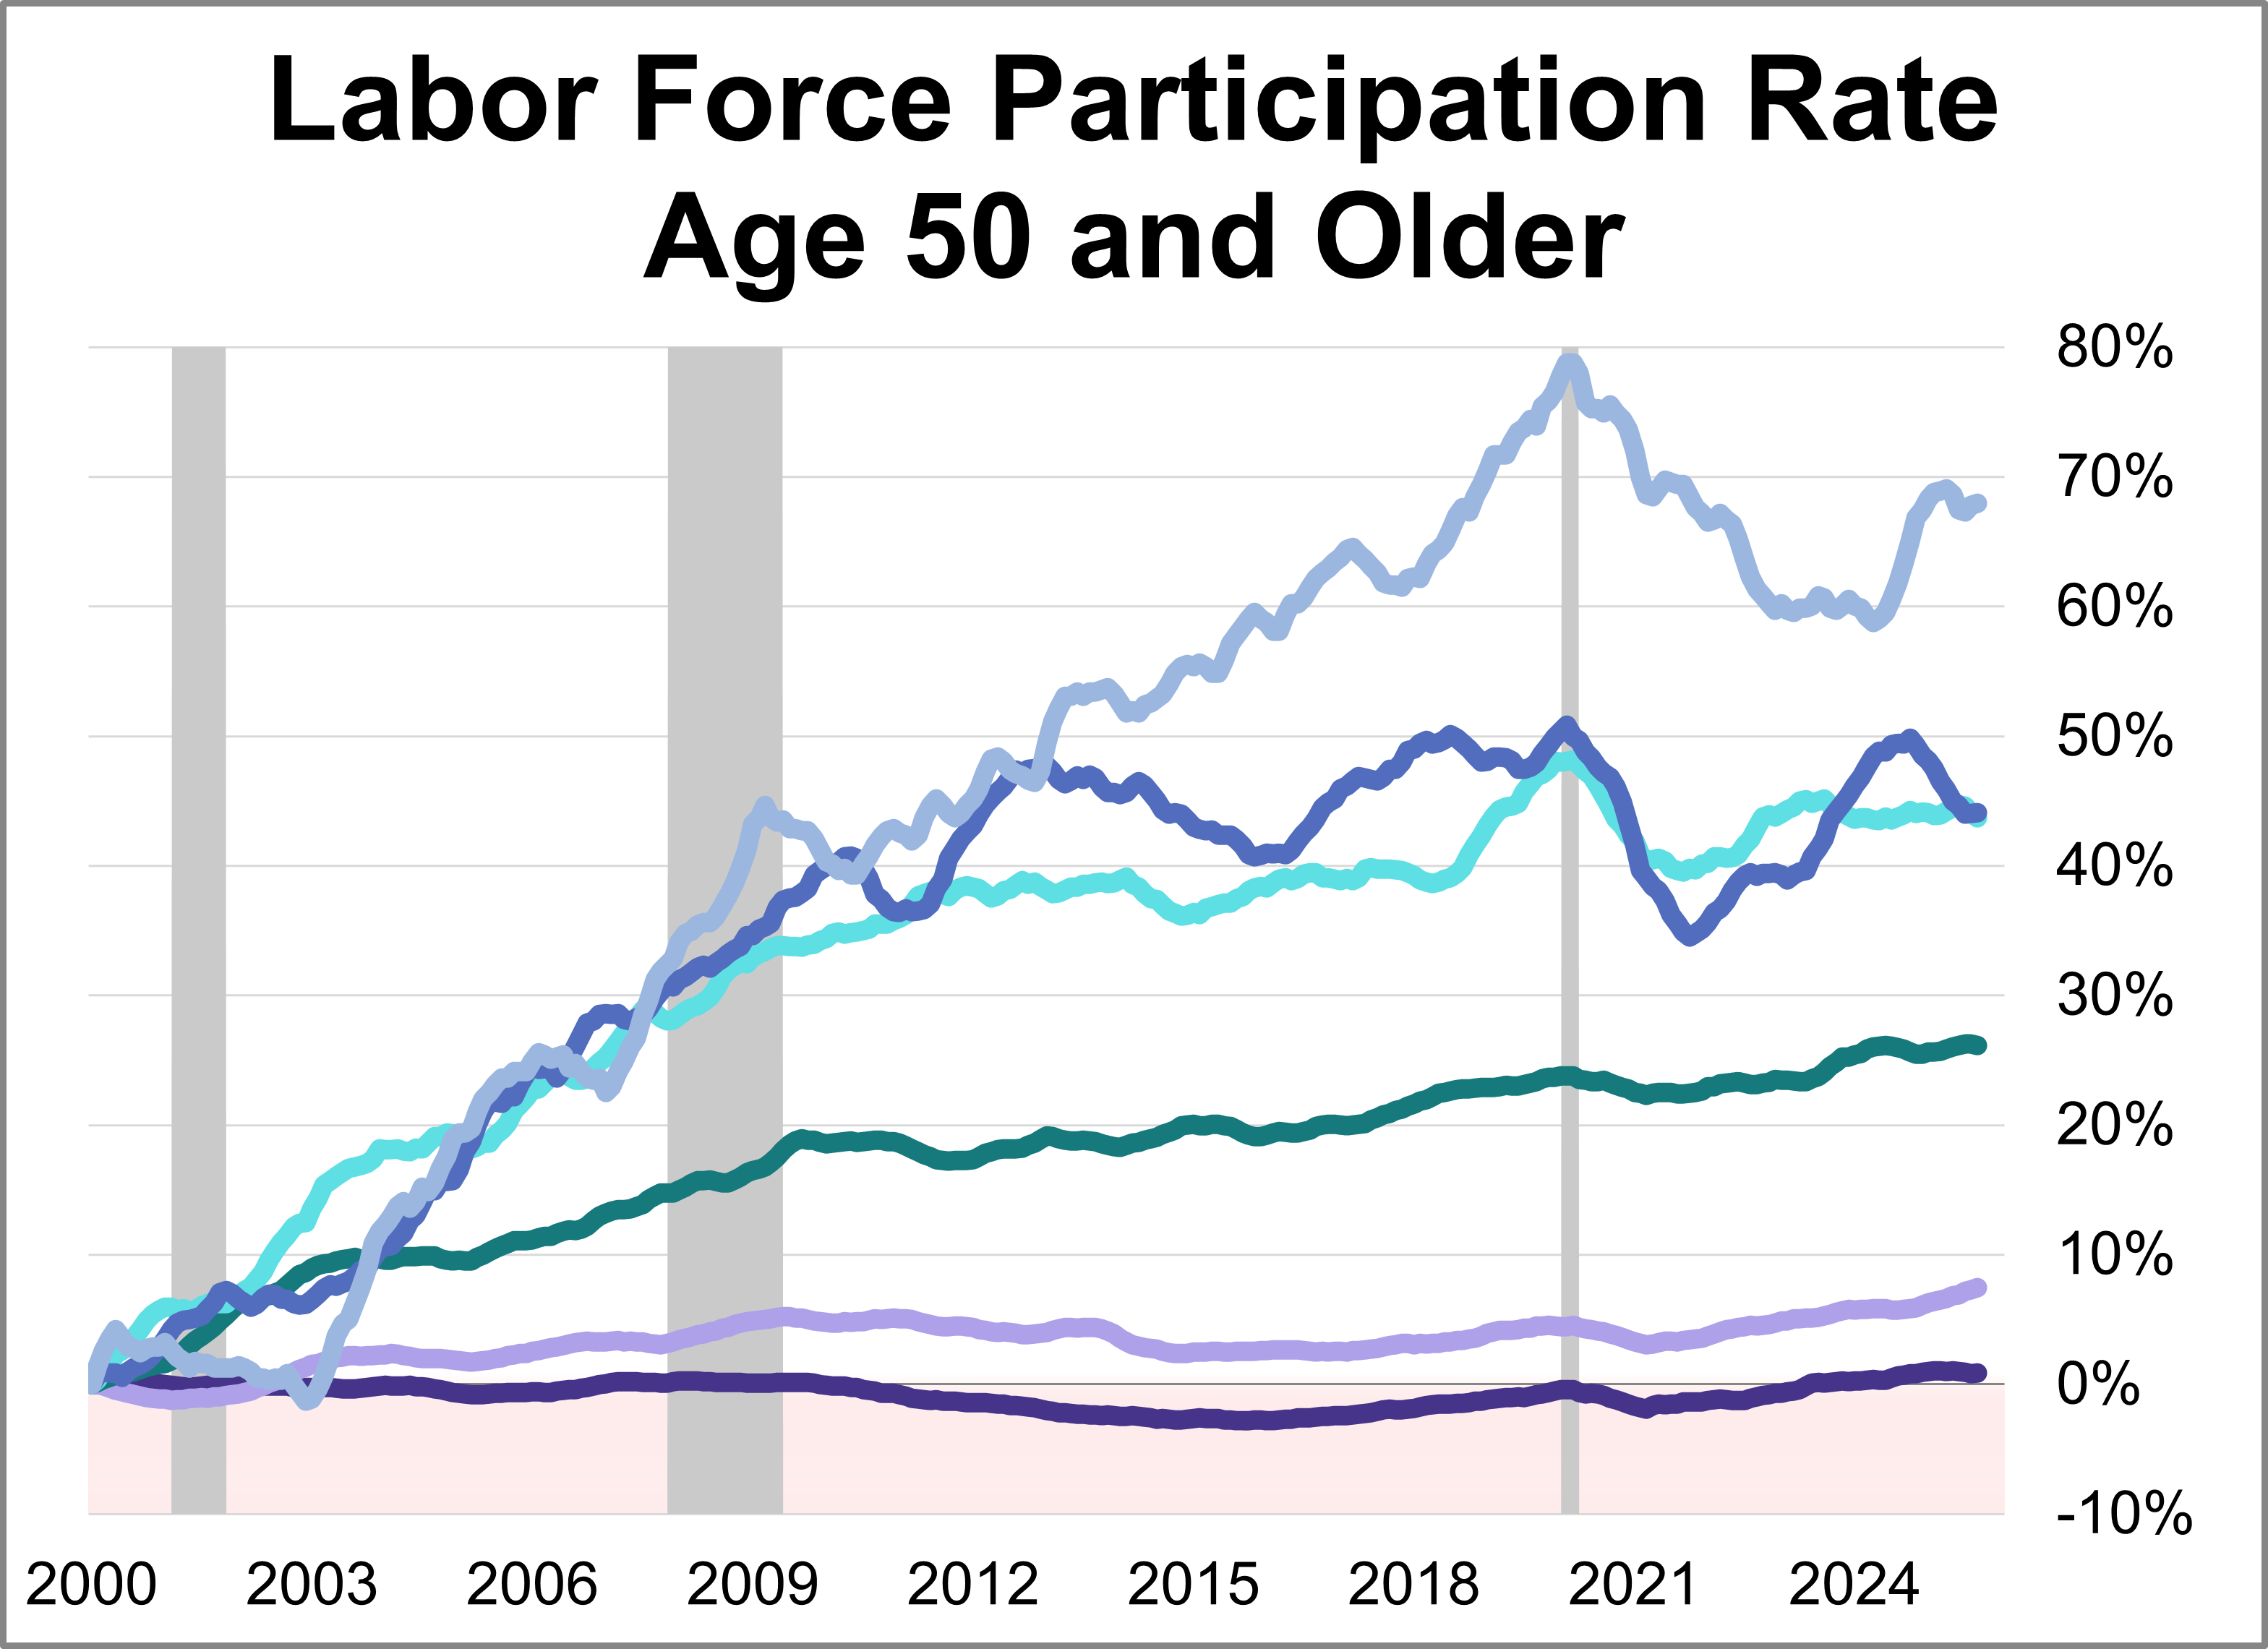
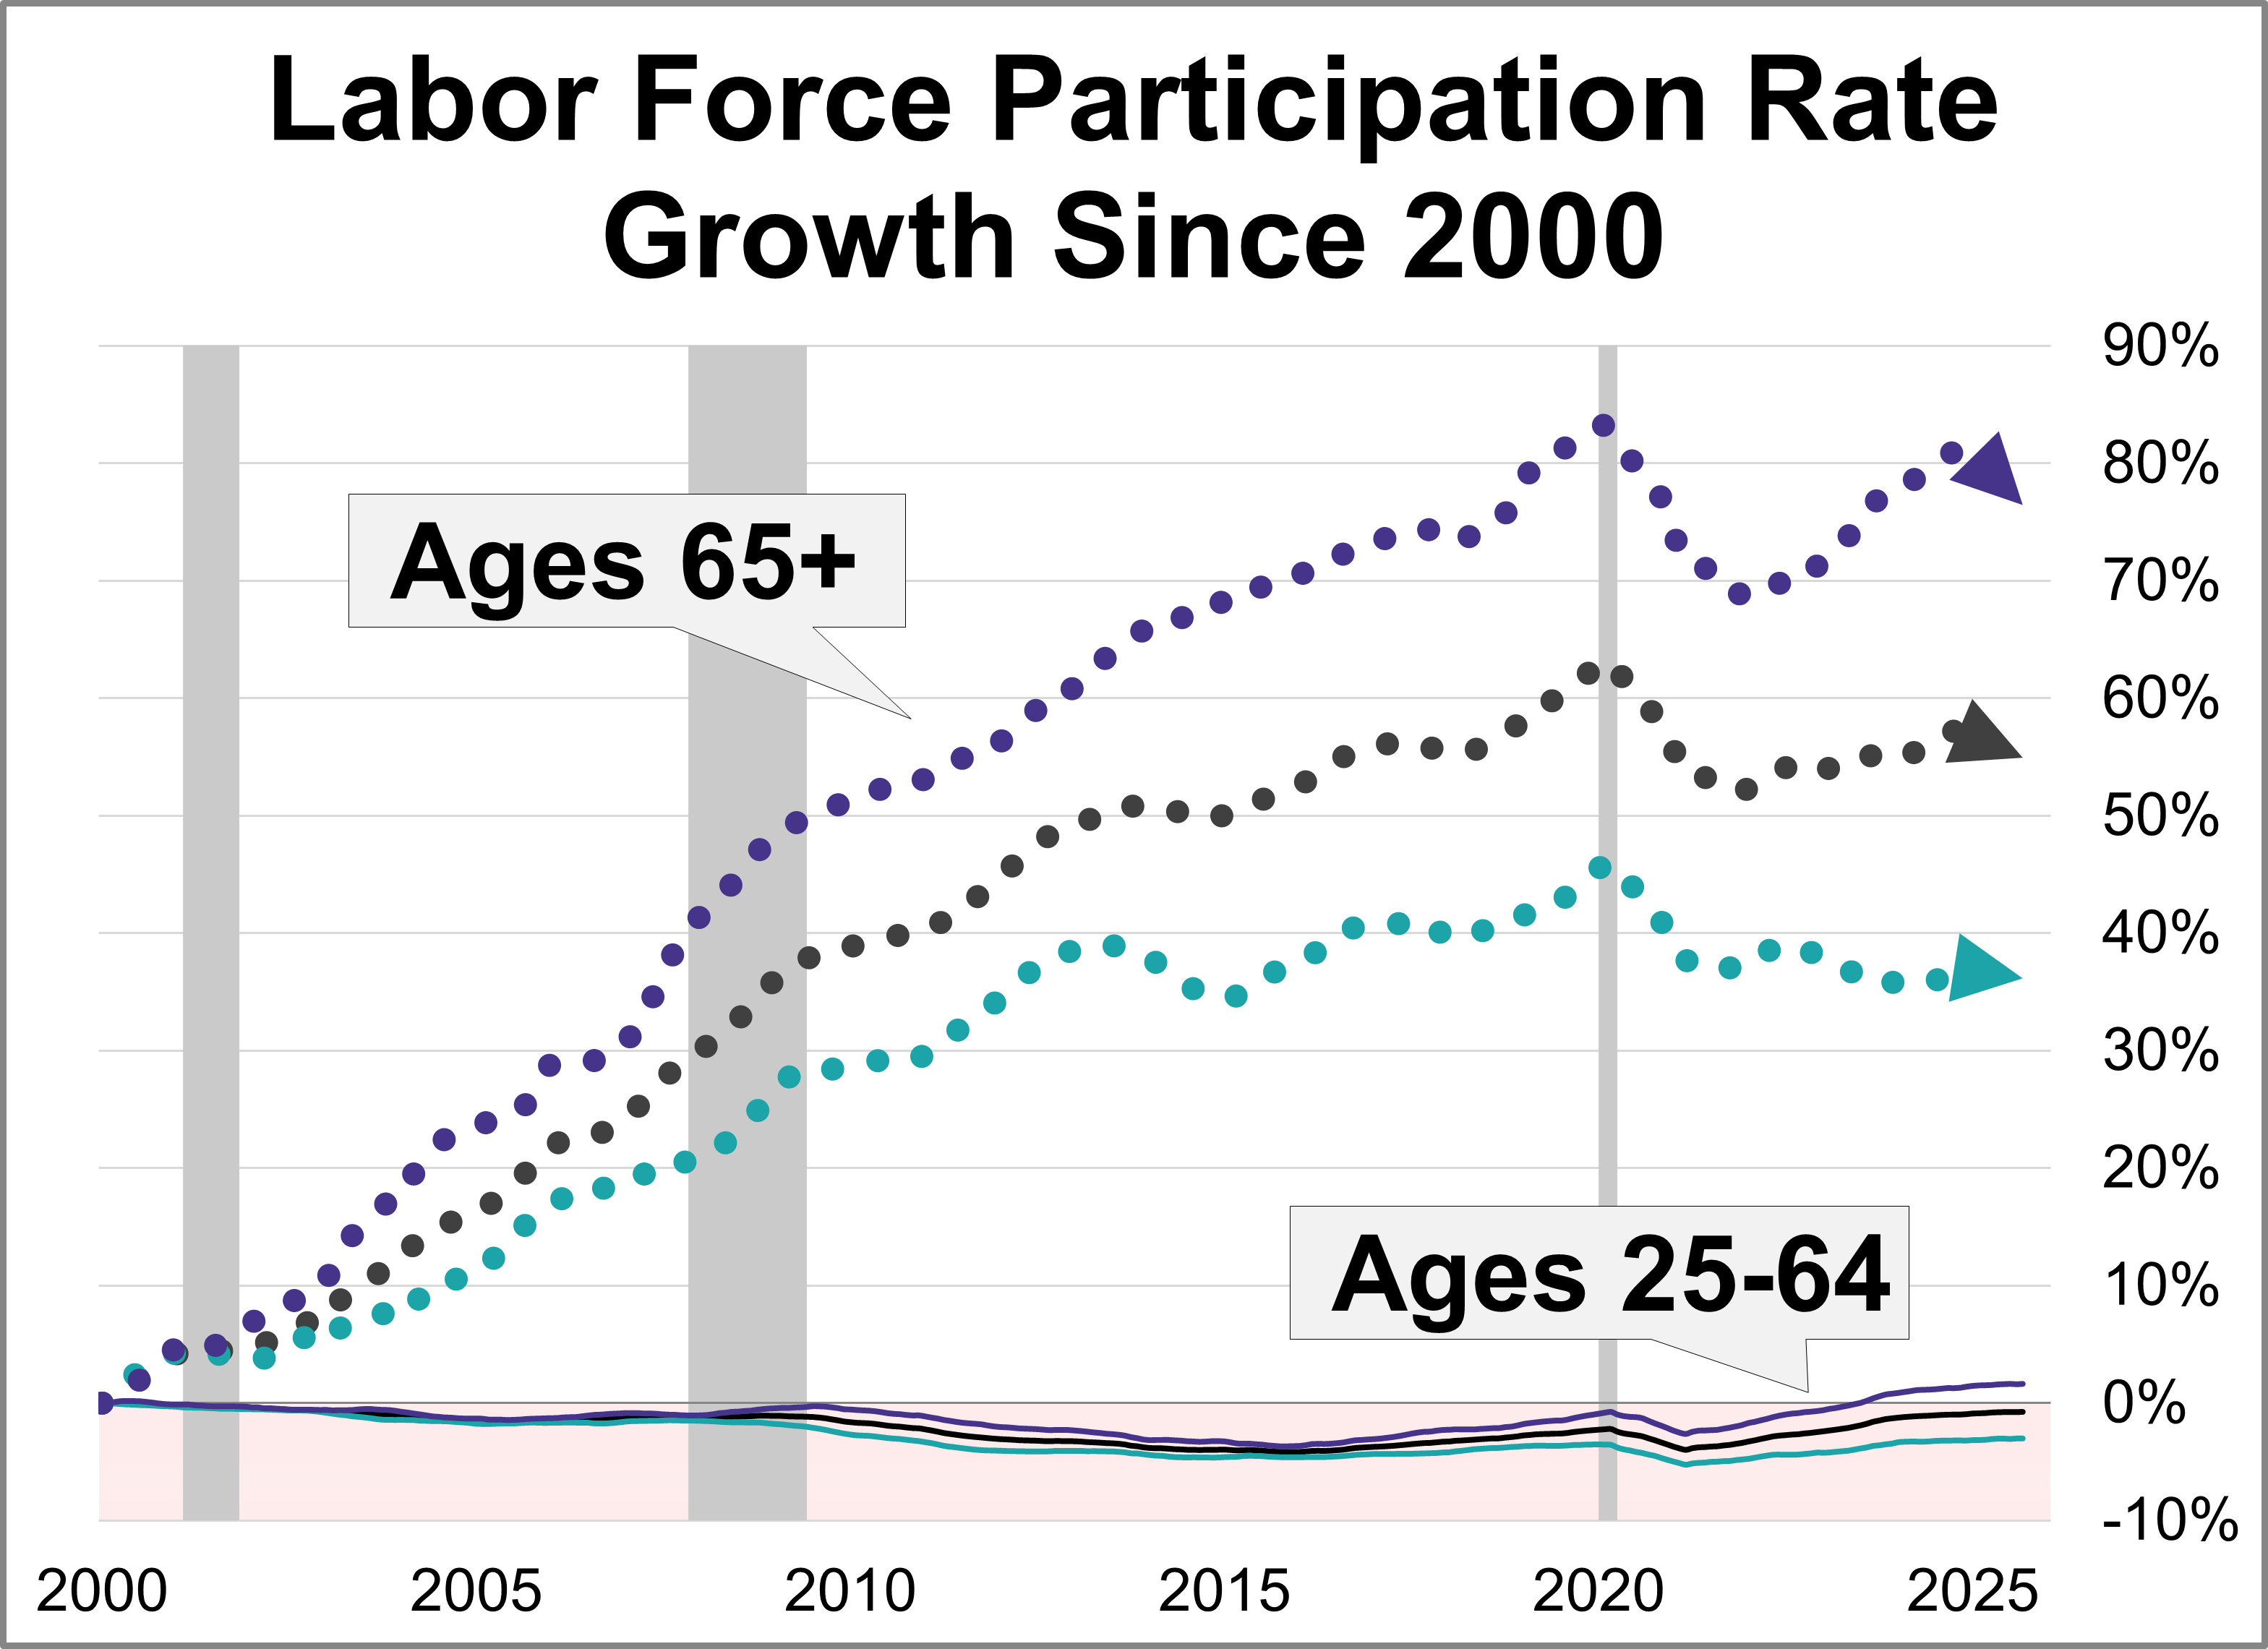
Today, one in three of the 65-69 cohort, one in five of the 70-74 cohort, and one in ten of the 75+ cohort are in the labor force.
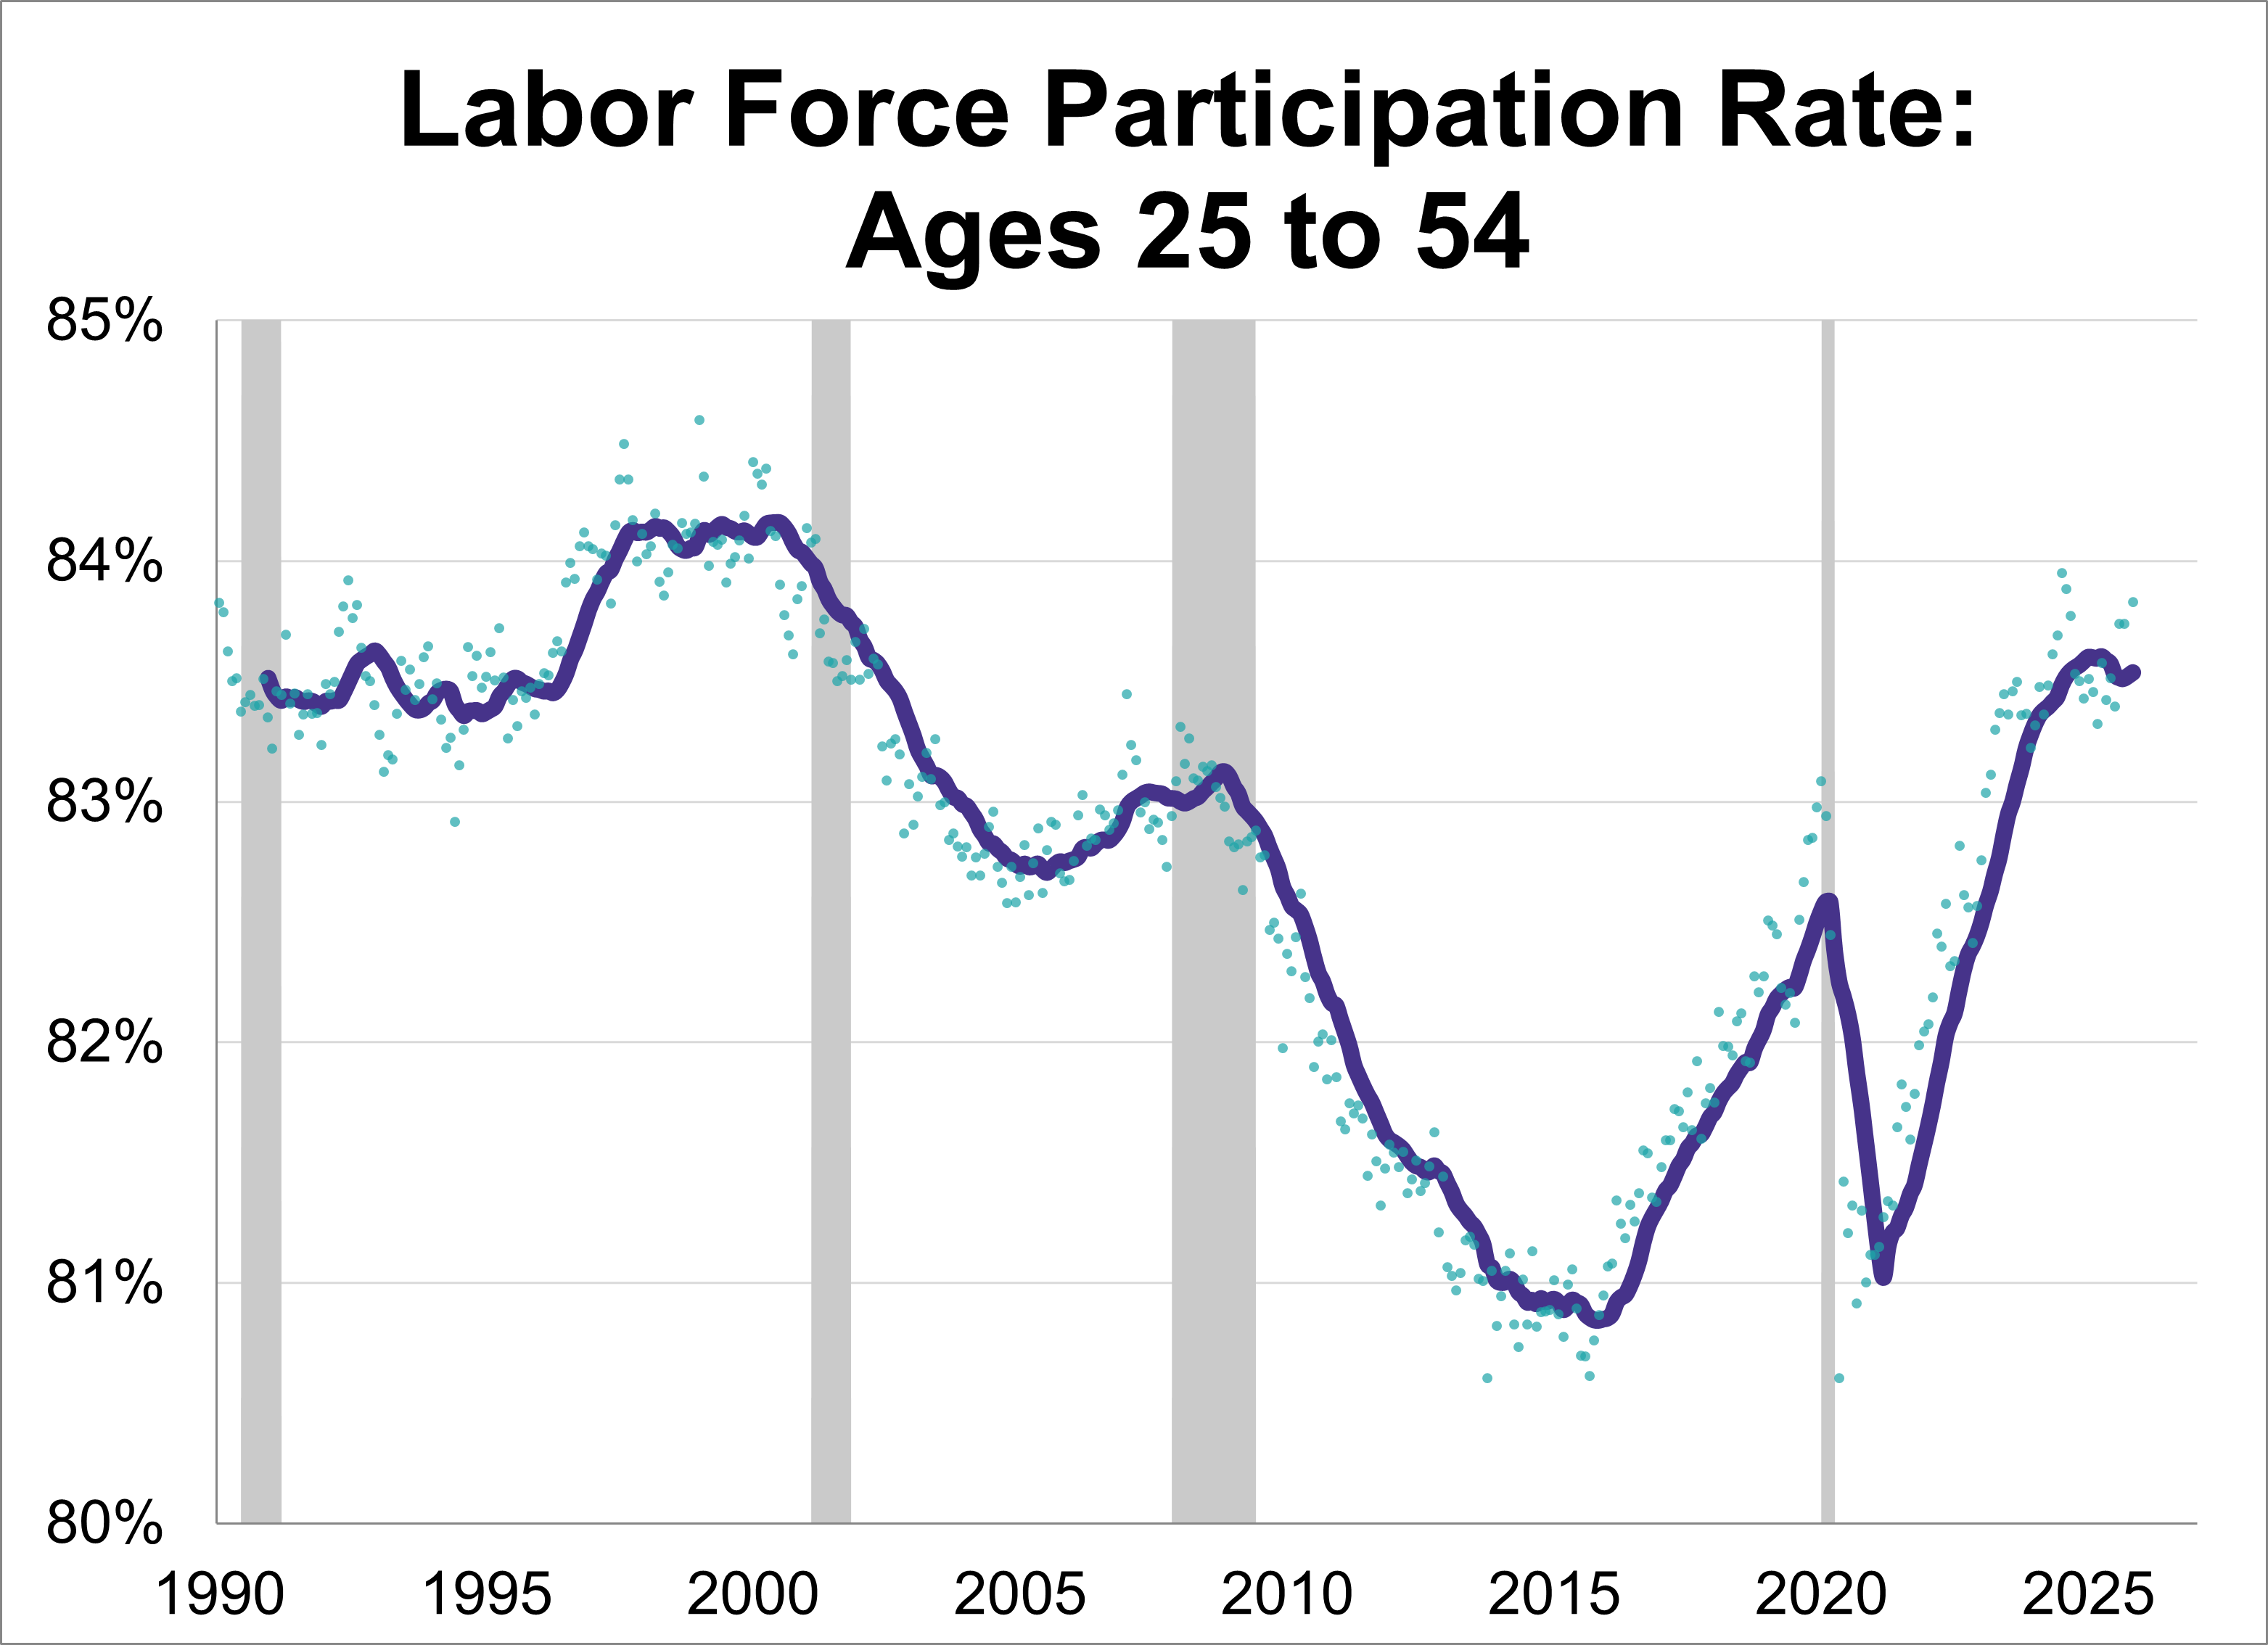
The labor force participation rate (LFPR) is a simple computation: You take the civilian labor force (people aged 16 and over employed or seeking employment) and divide it by the civilian non-institutional population (those 16 and over not in the military and or committed to an institution). As of September, the labor force participation rate is at 62.4%, up from 62.3% the previous month.
Last week's economic landscape was defined by conflicting signals from key indicators, suggesting a growing divergence between investor behavior and underlying consumer health.
Now that government workers are back in the office, the data flood is coming. Here are the four reports we’re most excited for, why they matter, and what we last heard from them.
The prolonged government shutdown has caused significant delays in official statistics, which has amplified the importance of private reports. This video highlights a handful of secondary reports from the week of November 3rd-7th.
Last week’s economic data sent mixed signals. Consumer sentiment plummeted to a near-record low on economic anxiety, and the manufacturing sector continued its long contraction.
This video examines the stock market's long-term behavior by looking at the inflation-adjusted S&P Composite Index's history using regression analysis with data through October 2025
Last week’s economic narrative centered around the Federal Reserve's latest rate cut, a decision complicated by the government shutdown and lack of economic data.
The Federal Funds Rate (FFR) is the interest rate banks charge each other to borrow money overnight. It's set by the FOMC and is one of the Federal Reserve's primary tools to implement monetary policy and is a key driver of economic activity. This video examines the Federal Funds Rate and reviews the Fed's interest rate meeting on October 29, 2025.
While the ongoing government shutdown continues to delay the release of many reports, a key piece of economic data managed to break through last week.
Secondary economic indicators have taken on heightened importance amid the ongoing government shutdown. Read through a handful of these secondary reports from the week of October 13th-18th.
In a week marked by renewed S&P 500 volatility stemming from reignited tariff talks and the ongoing challenge of a government shutdown that continues to delay crucial government reports, investors and analysts have increasingly turned to secondary economic indicators for a timely view of the U.S. economy.
Secondary economic indicators have taken on heightened importance amid the ongoing government shutdown. This video highlights a handful of secondary reports from the week of October 13th-18th.
The Buffett Indicator, made popular by Warren Buffett, assesses the overall value of the stock market relative to the economy. This video provides the September 2025 update on Buffett Valuation Indicator.
In the absence of primary government indicators, policymakers and investors alike must turn to private sector releases to find clarity. These secondary reports paint a picture of a cooling labor market and an increasingly cautious consumer.
Last week’s economic data presented a sharp contradiction between a resilient U.S. economy and increasingly concerned American households.
The Federal Funds Rate (FFR) is the interest rate banks charge each other to borrow money overnight. It's set by the FOMC and is one of the Federal Reserve's primary tools to implement monetary policy and is a key driver of economic activity. This video examines the Federal Funds Rate and reviews the Fed's interest rate meeting on September 17, 2025.
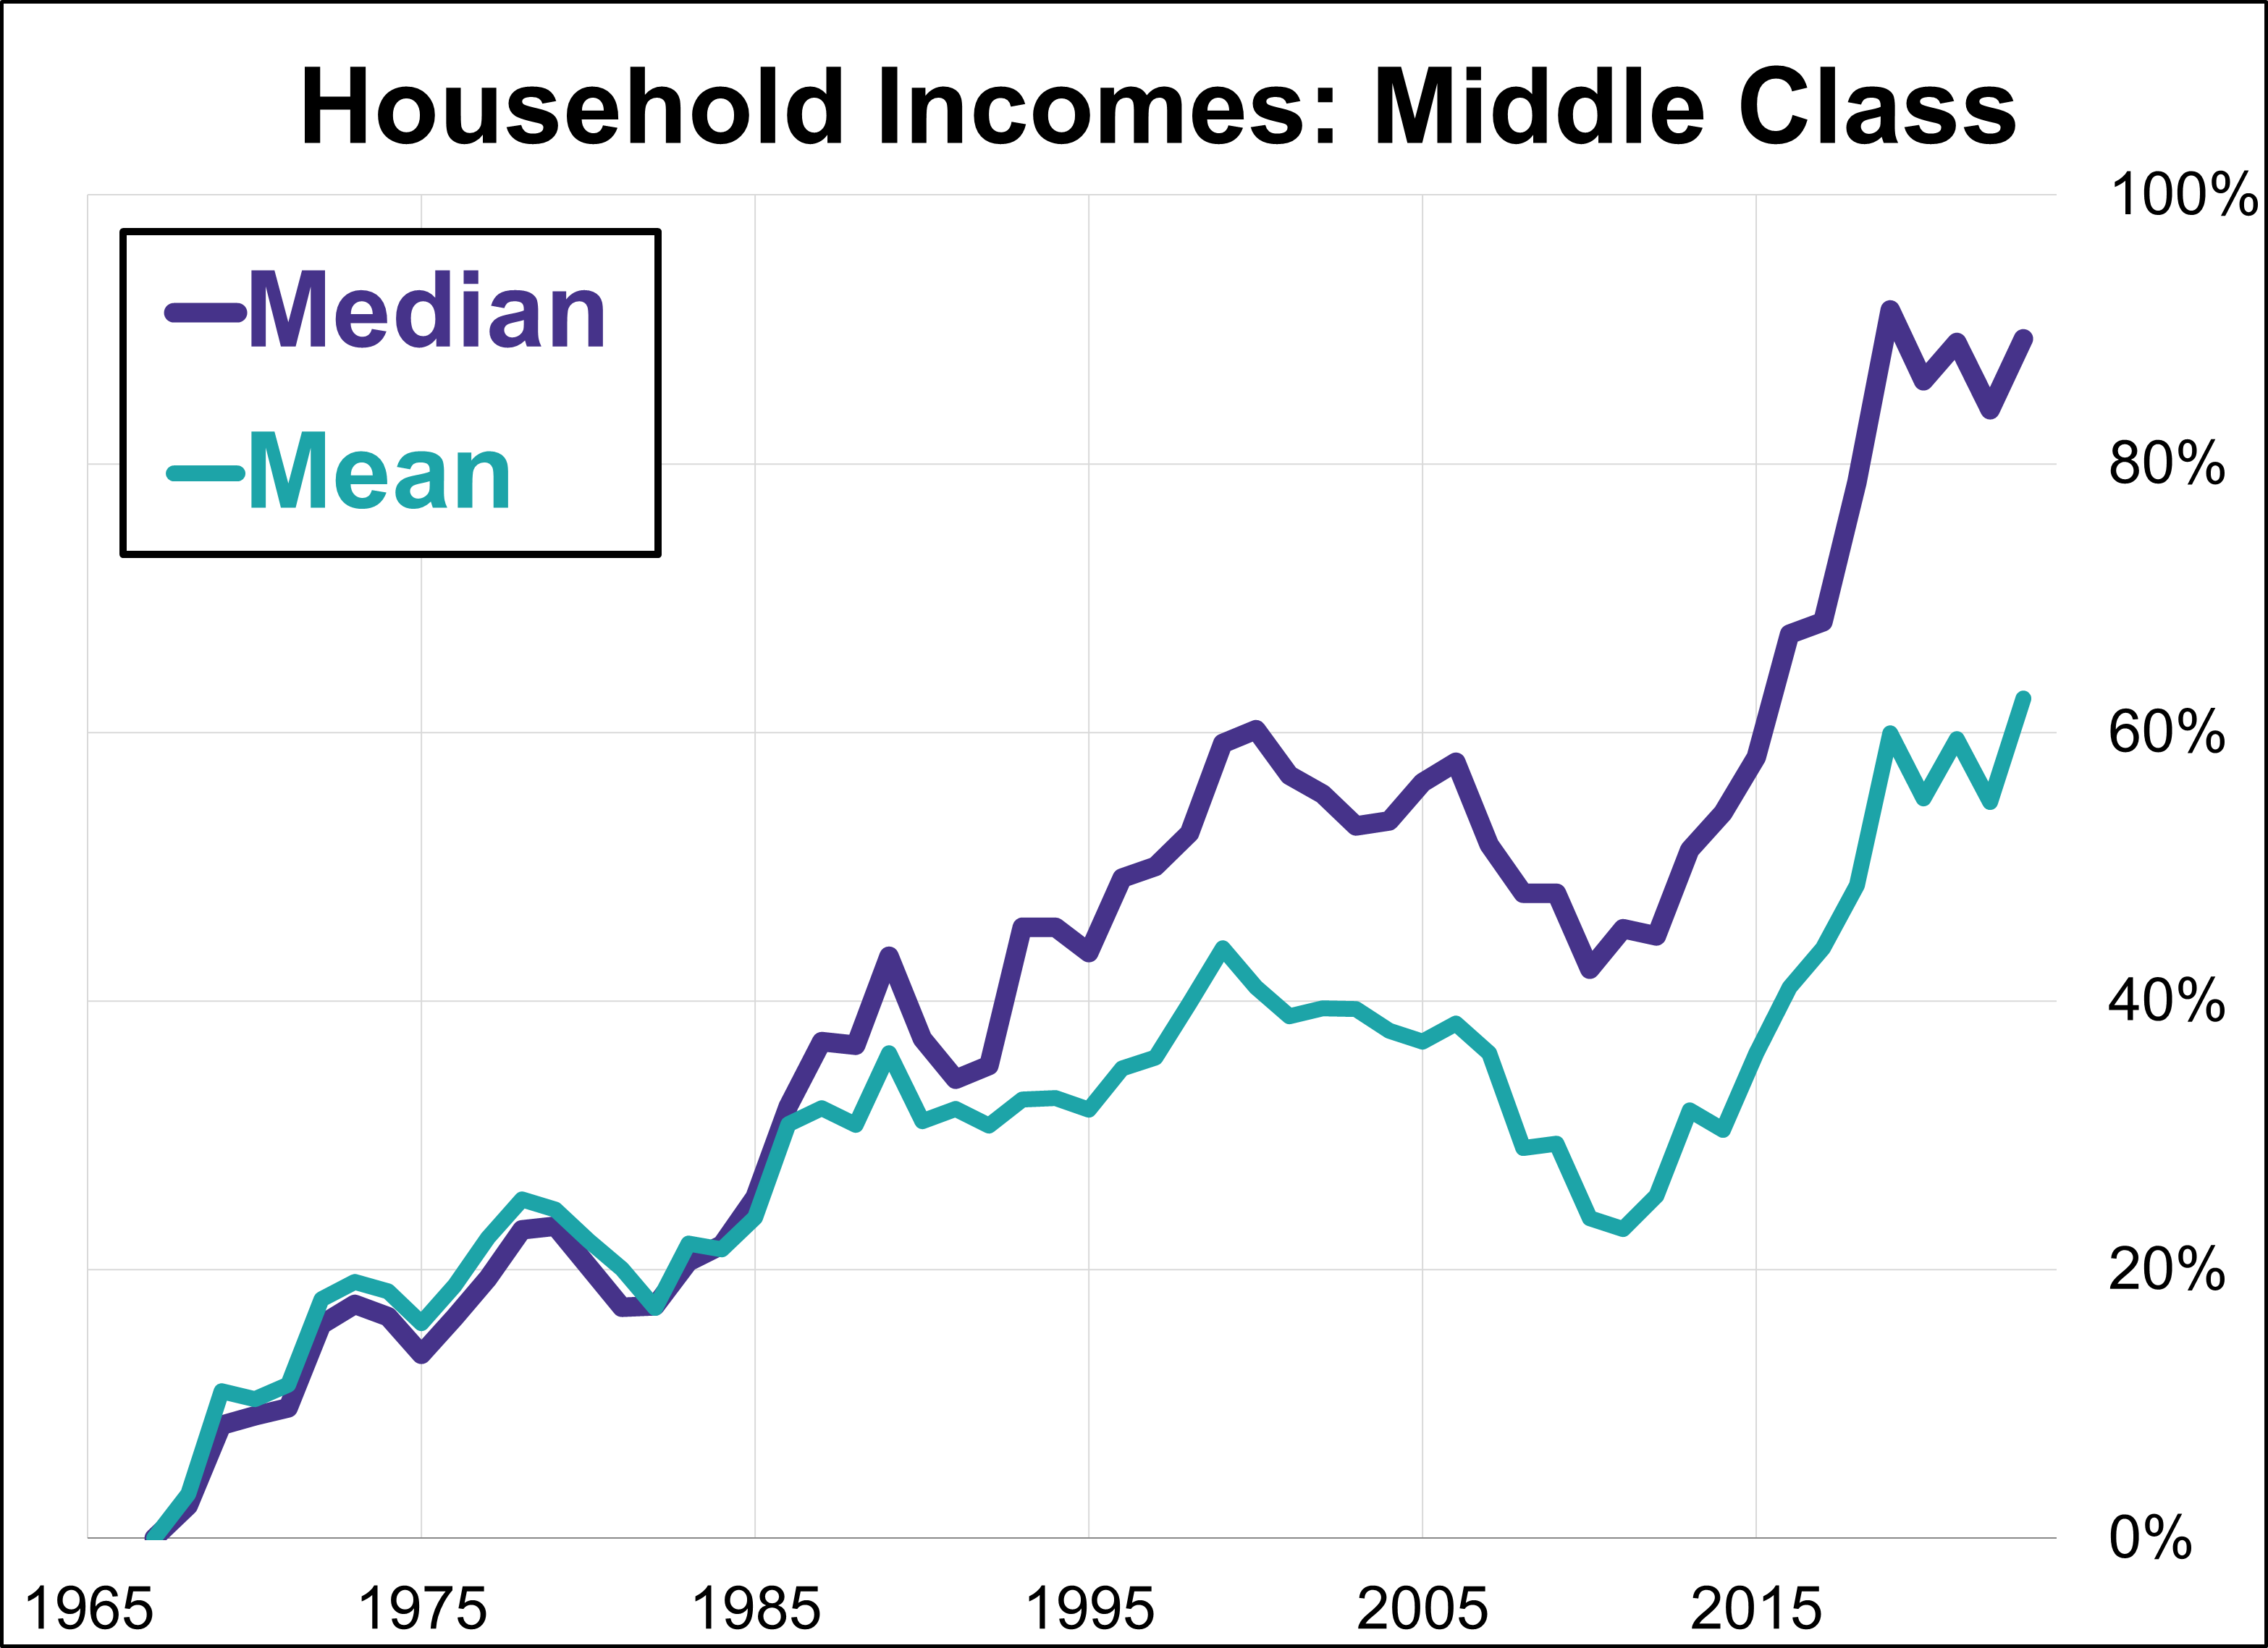
The median household is the statistical center of the Middle Class. Let's take a closer look at the Census Bureau's latest annual household income data with a focus on middle class income. In this update, we'll focus on the growing gap between the median (middle) and mean (average) household incomes across the complete time frame of the Census Bureau's annual reporting from 1867 to 2024.
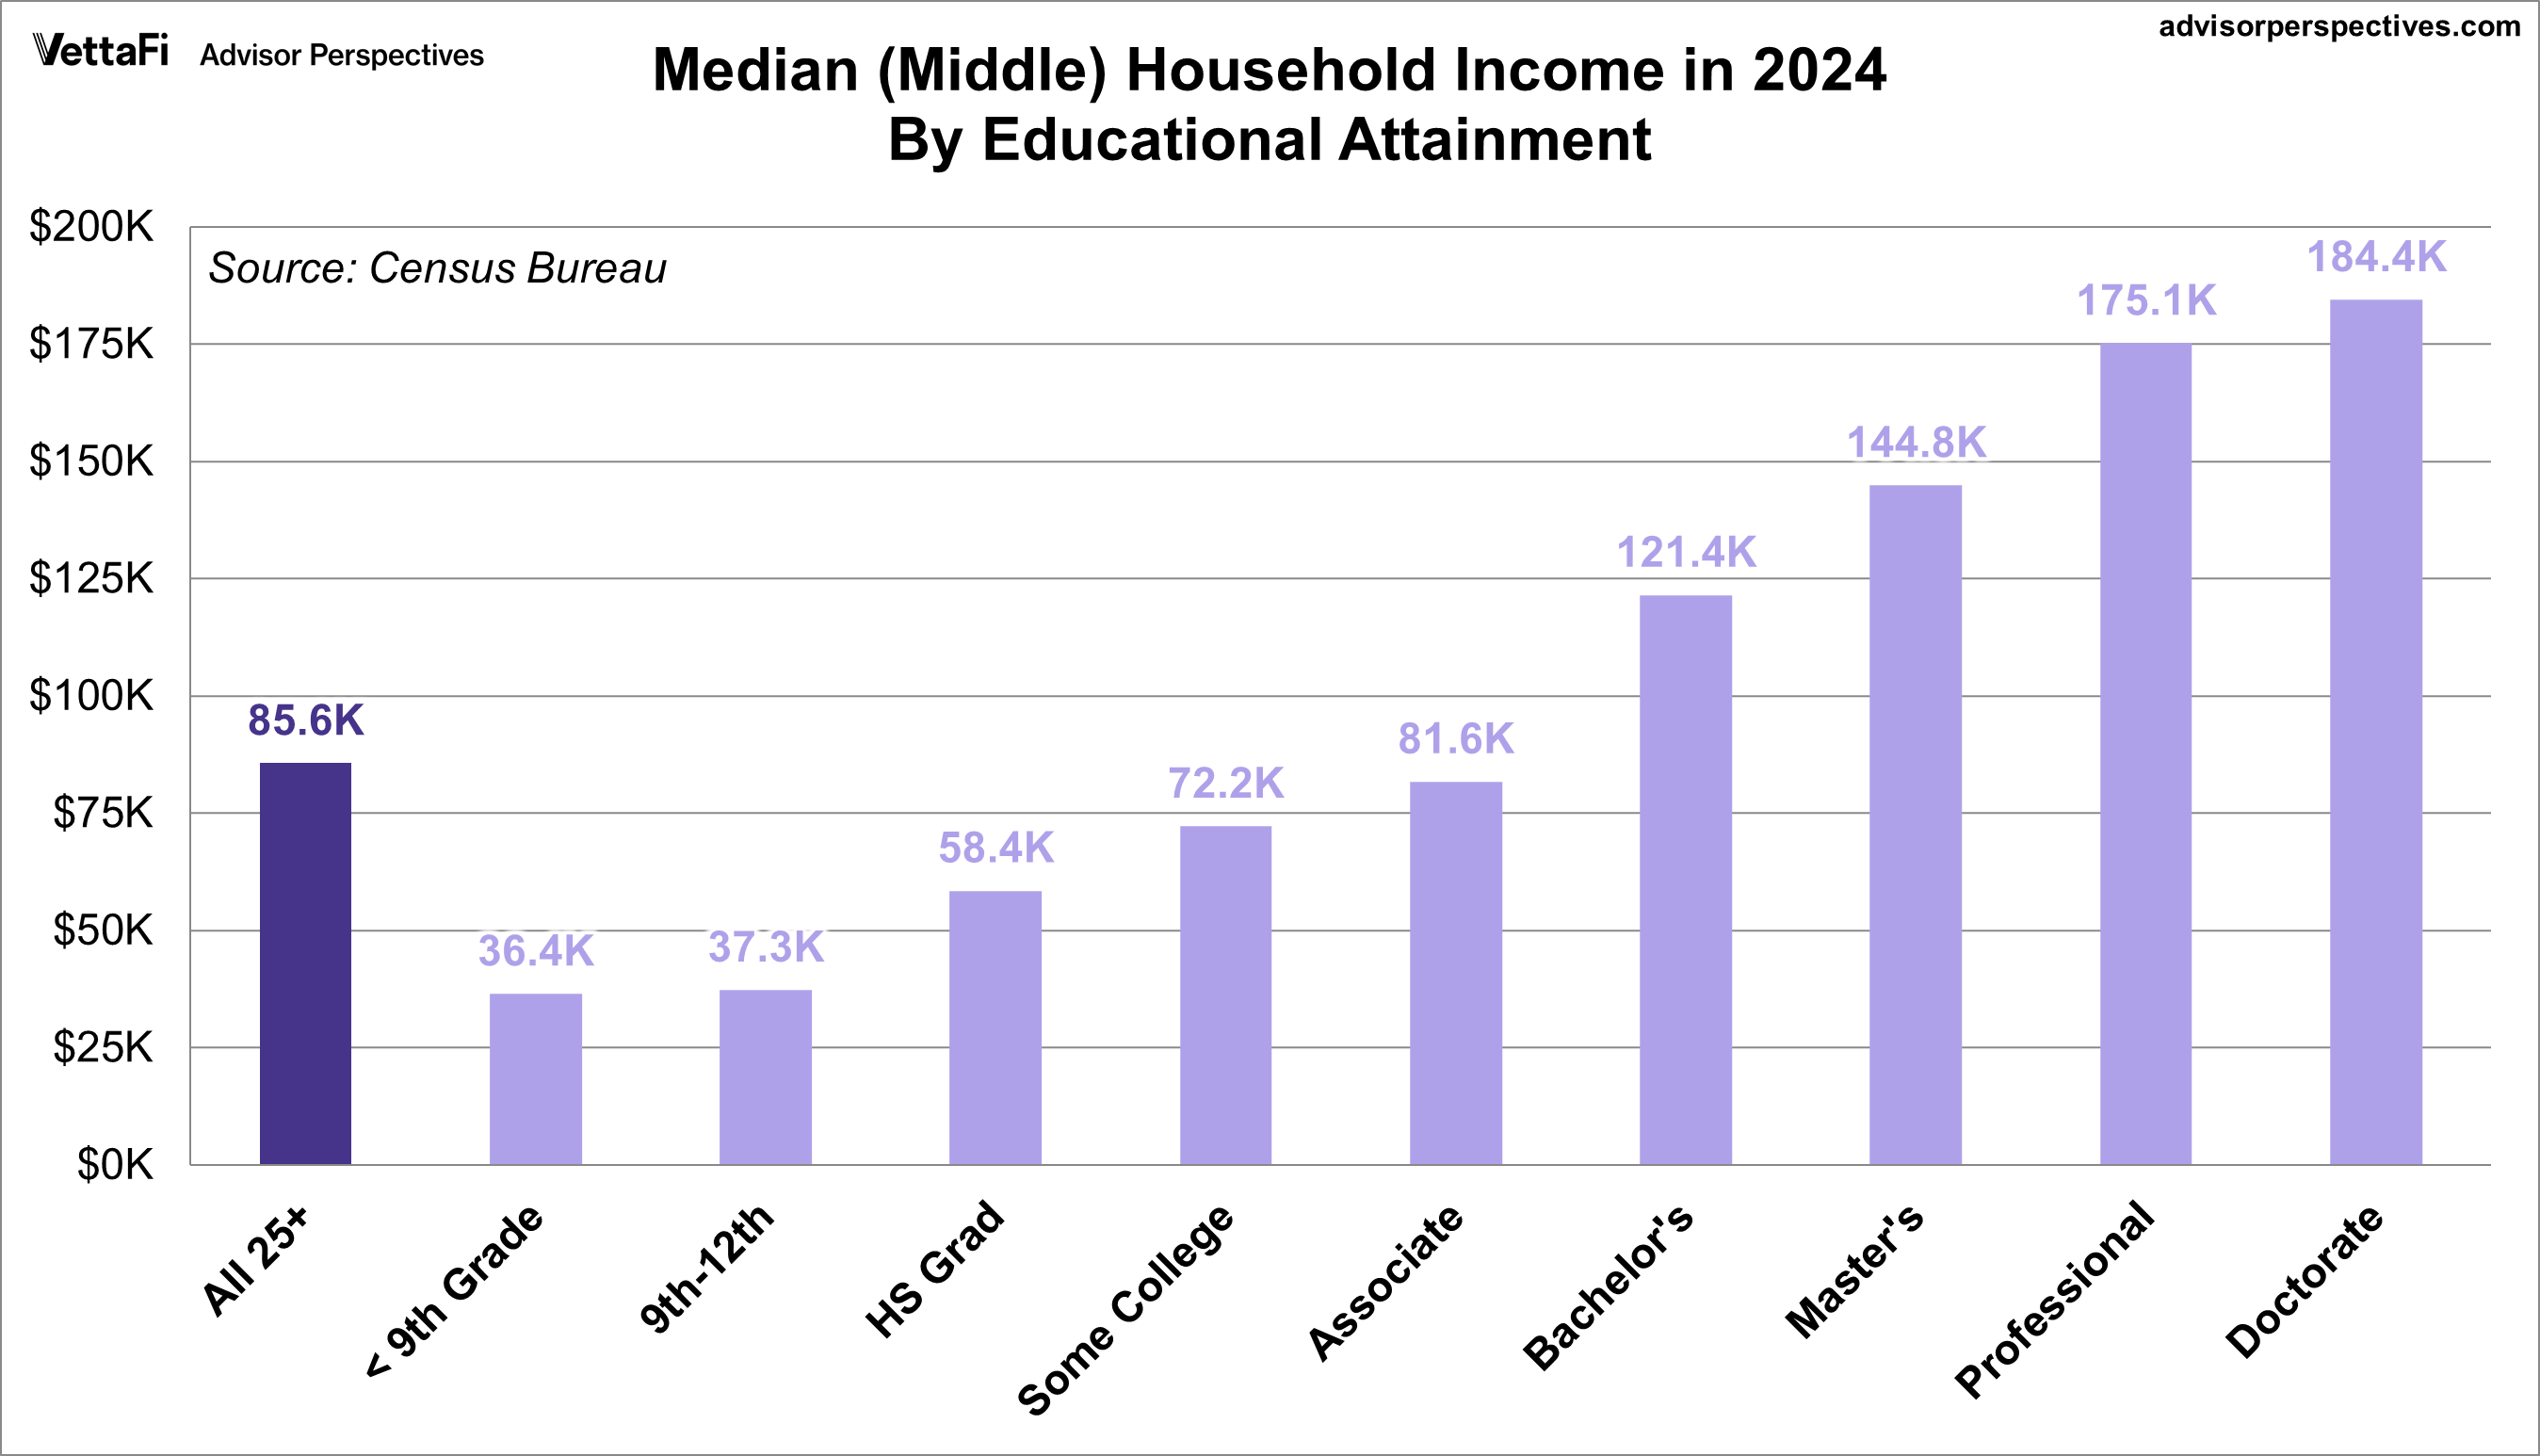
What is the relationship between education and household income? The Census Bureau’s 2024 annual survey data provides valuable insights into this question. The median household income for individuals aged 25 and older was $85,580, but how does this figure vary based on educational attainment?
The path ahead for the Fed remains complicated as it balances the need to support a softening labor market without stoking inflation. This video highlights the major economic news from the week of September 8th - 12th.
Last week's economic data presented a challenging picture for the U.S. economy with key inflation reports delivering conflicting signals and a timely labor market indicator added to the narrative of a softening labor market. Read through the major economic news from the week of September 8th - 12th.
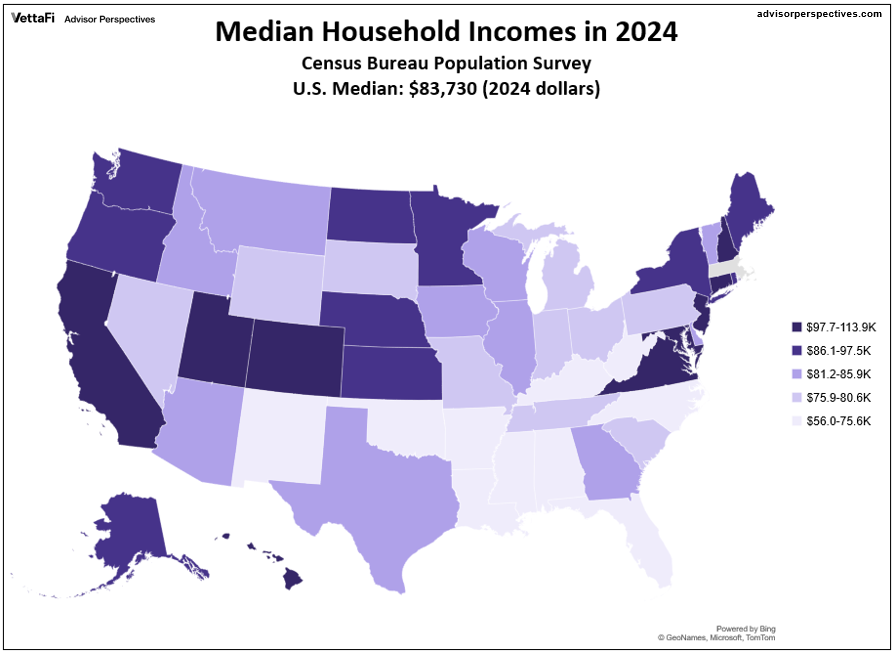
The median US income in 2024 was $83,730, up from $22,420 in 1984 — a 274% rise over the 40-year time frame. However, if we adjust for inflation chained in 2024 dollars, the 1984 median is $60.420 and the increase drops to 39%.
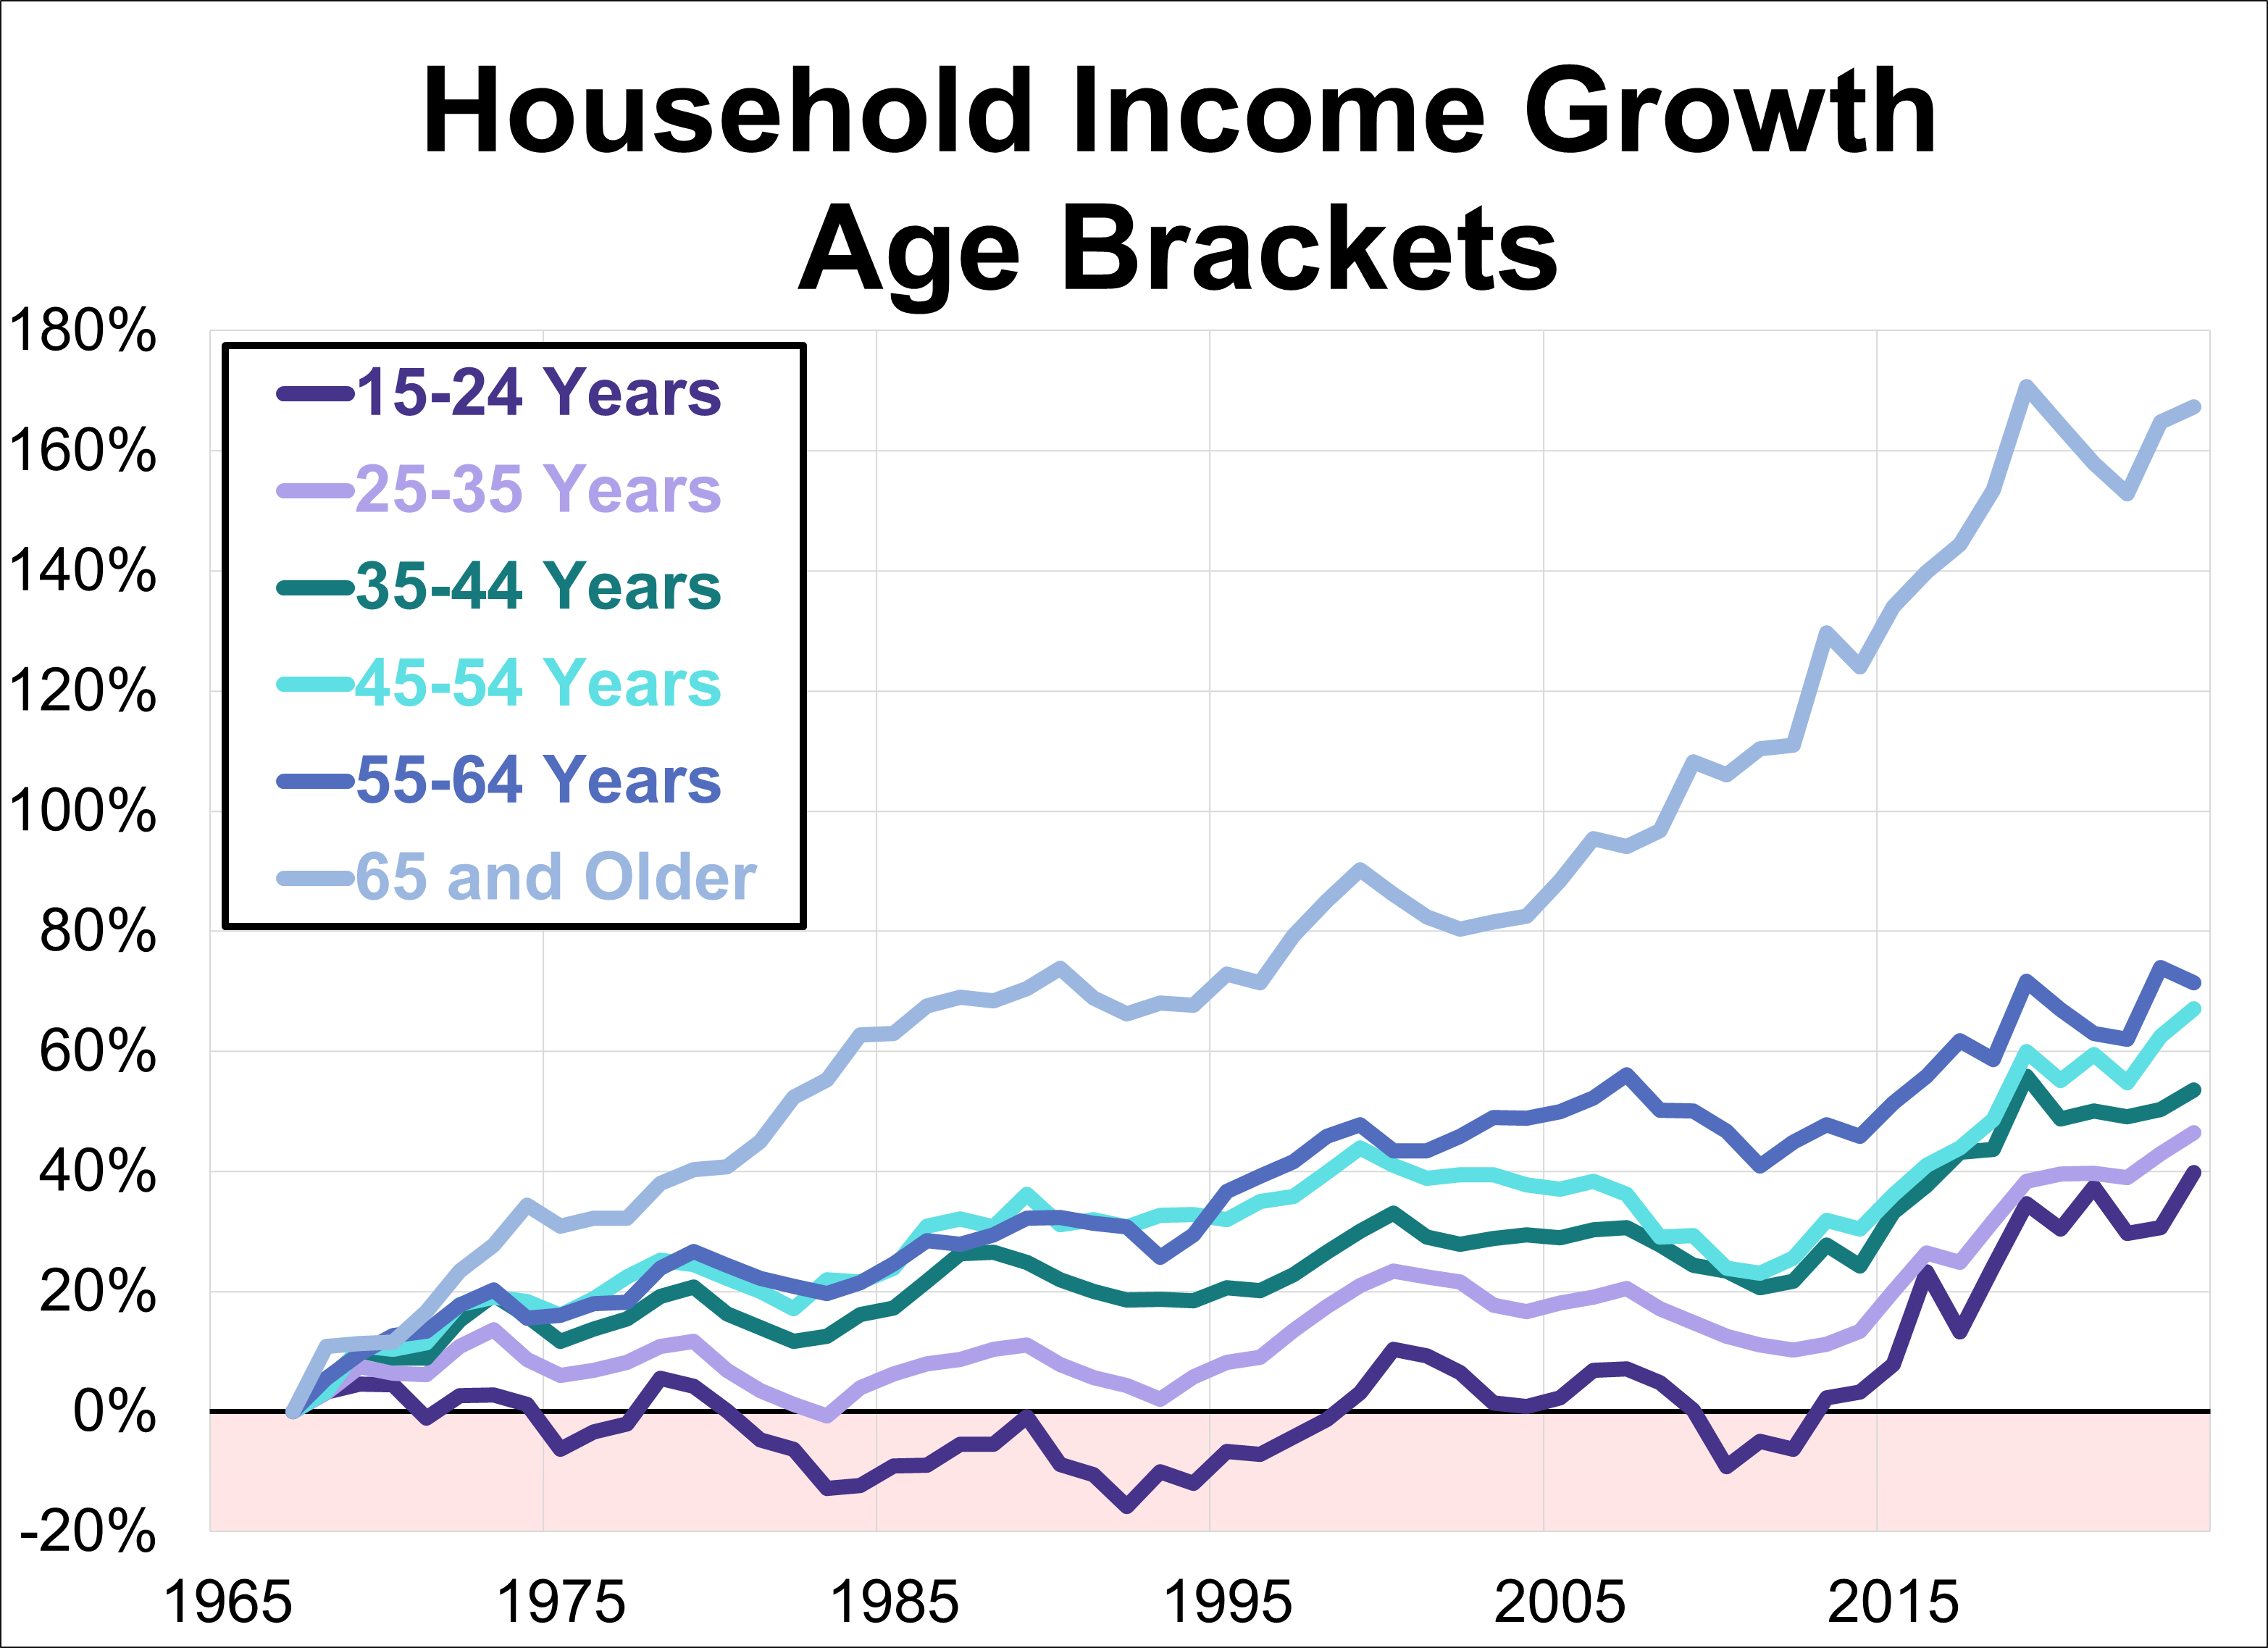
Our commentary on household income distribution offers some fascinating insights into average U.S. household incomes, but misses the implications of age for income. In this update, we examine household income with a focus on age bracket.
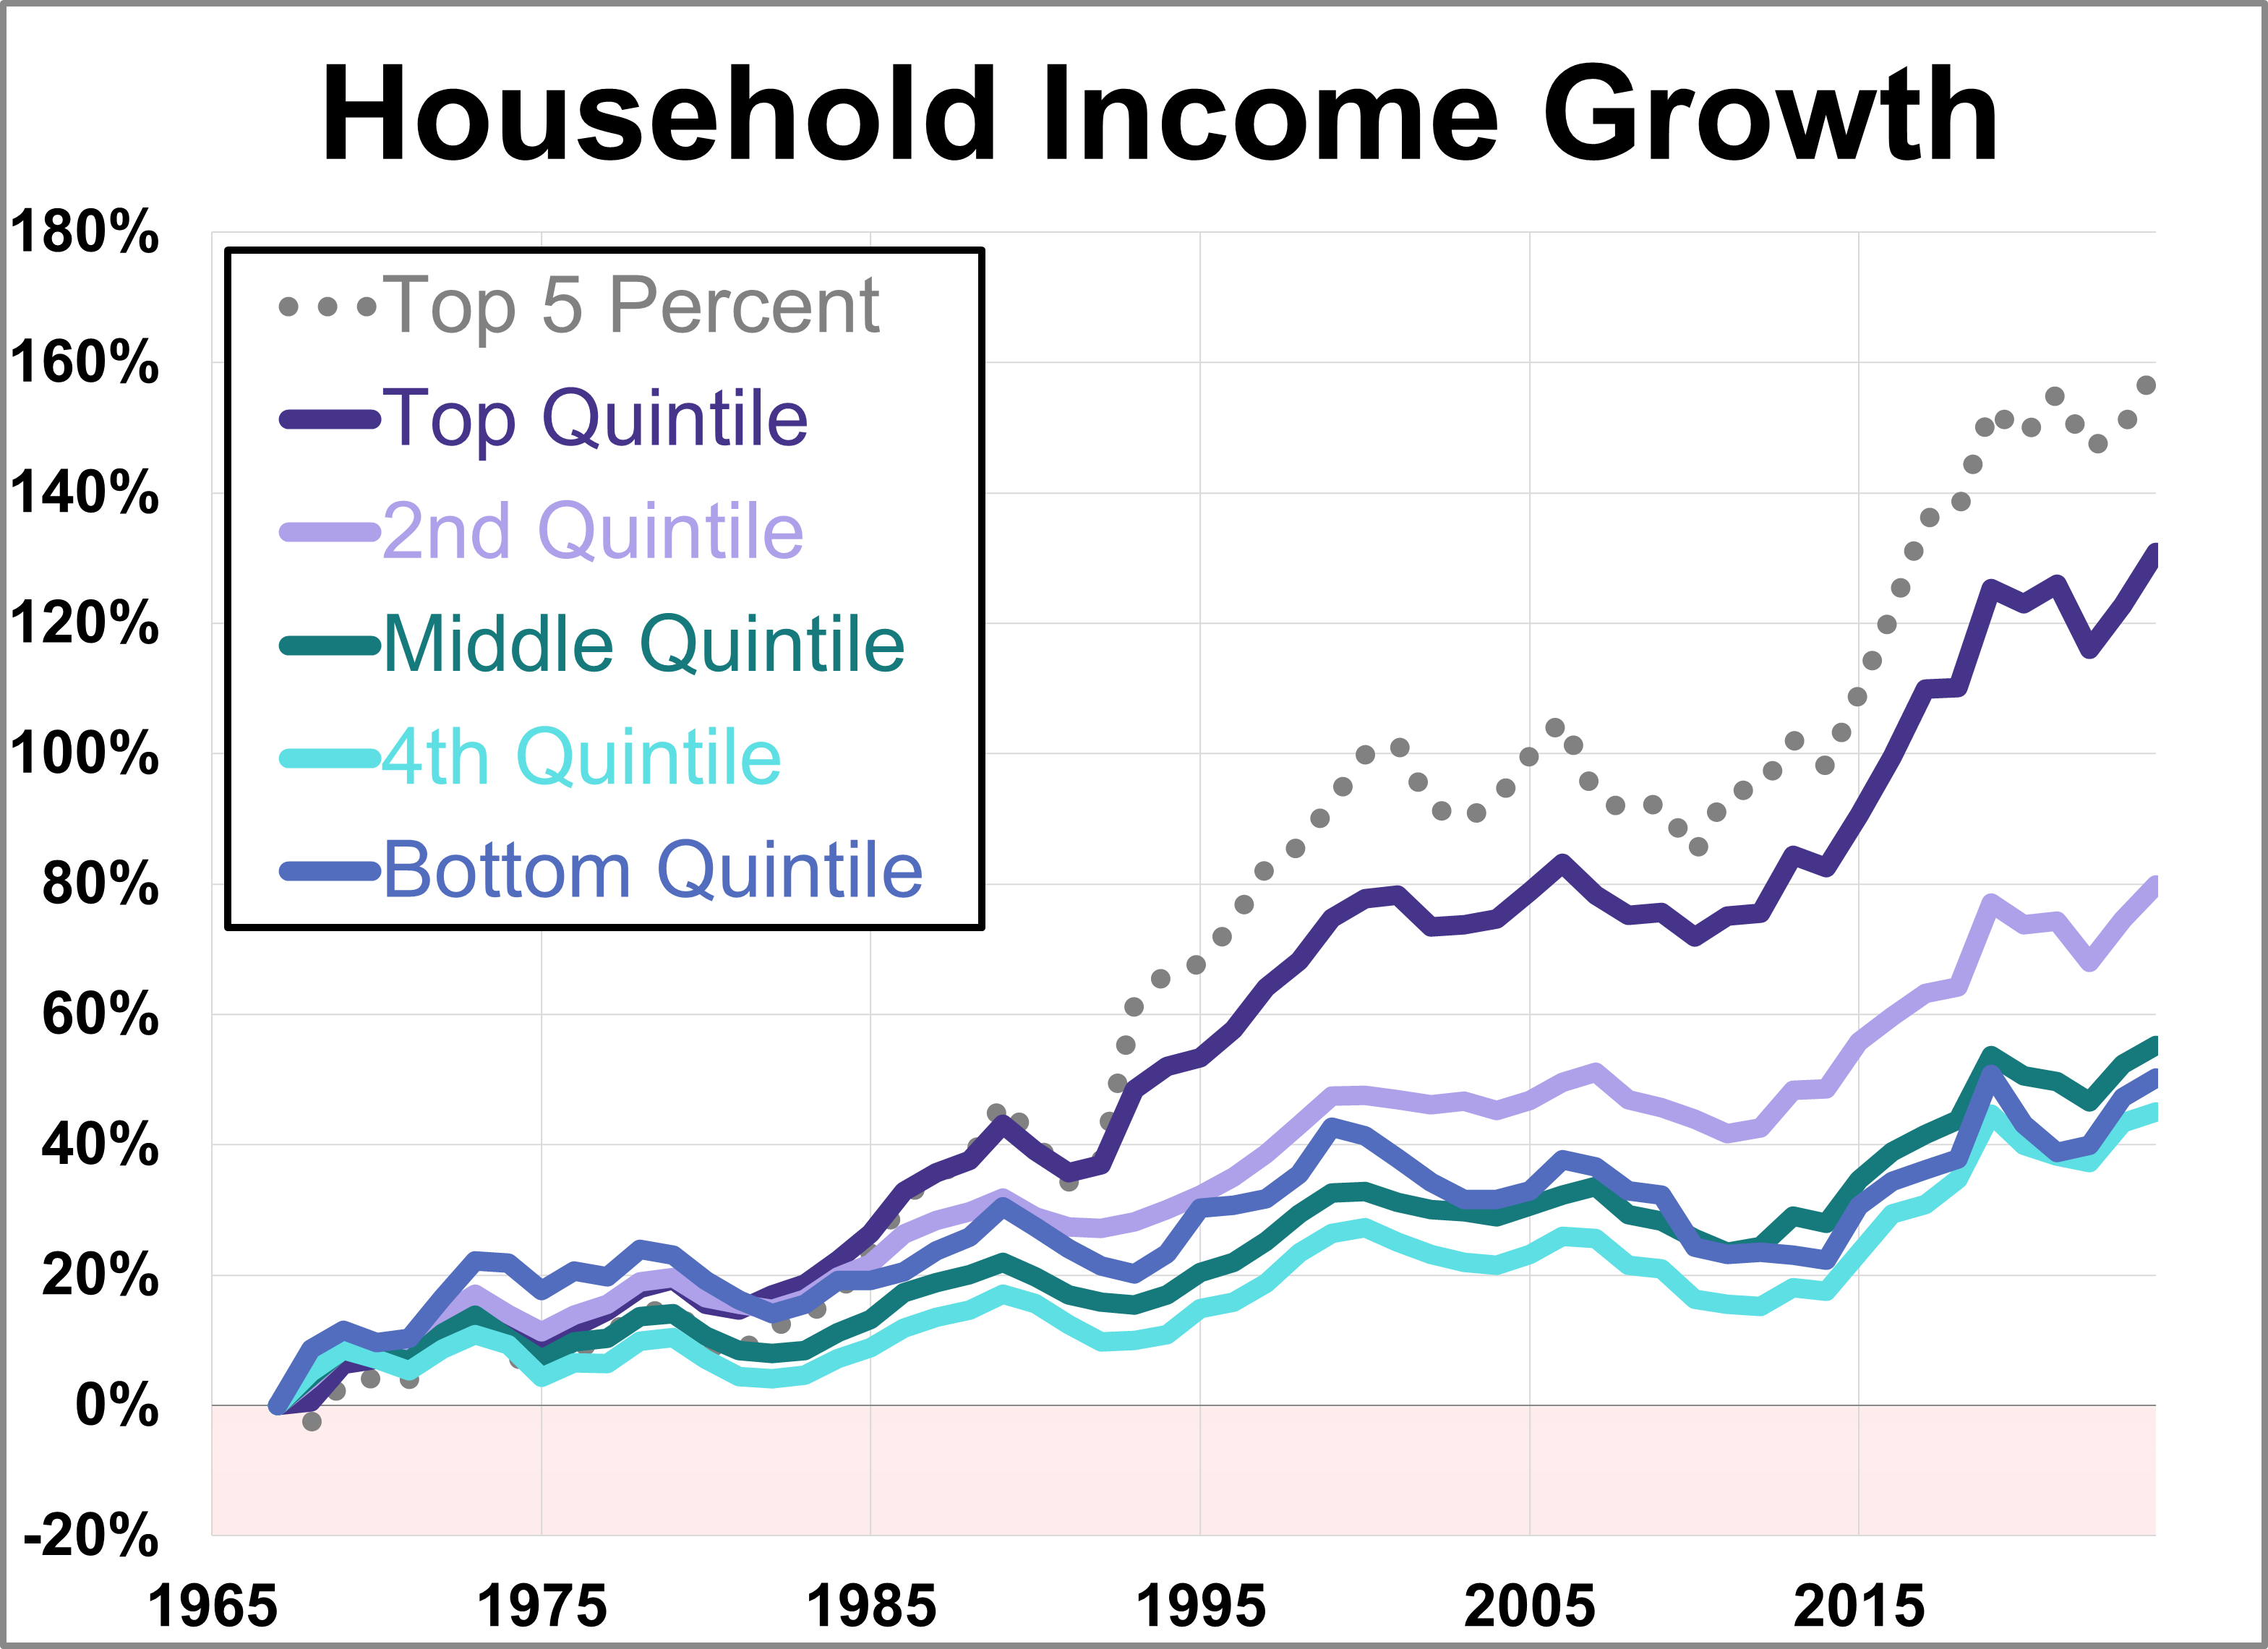
The Census Bureau recently released its annual report on household income data for 2024. The mean (average) household income for the middle quintile rose 4.5% to $84,390. Let's take a closer look at the quintile averages, which date back to 1967, along with the statistics for the top 5%.
Last week's economic data presented a challenging picture for the U.S. economy with key inflation reports delivering conflicting signals and a timely labor market indicator added to the narrative of a softening labor market.
The U.S. labor market continued to show signs of cooling, with all major labor indicators pointing to a softening trend and a weak hiring environment. Read through the major economic news from the week of September 2nd - 5th.
The U.S. labor market continued to show signs of cooling, with all major labor indicators pointing to a softening trend and a weak hiring environment.
Last week's economic data revealed strong economic growth running up against rising prices and falling confidence.
Last week was dominated by a major event in the financial world, the Jackson Hole symposium, and the subsequent reaction from the markets. Read through the major economic news form the week of August 18th - 22nd.
This video highlights the major economic news from the week of August 18th-22nd
Last week, the S&P 500 had a rally that took it to three straight record highs but the momentum cooled as economic data painted a complex picture. Read through the major economic news from the week of August 11th-15th.